
Figure 3. Indirect regulation of mitochondrial gene expression by miR-33.
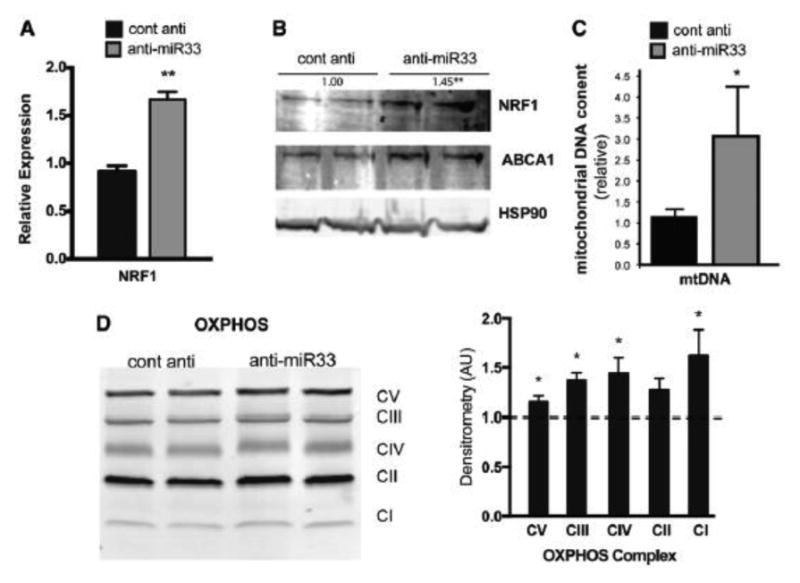
(A-B) Nrf1 mRNA (A) and protein (B) expression in peritoneal macrophages treated with control anti-miR or anti-miR33. **p≤0.01 compared to control anti-miR. (C). Mitochondrial biogenesis in peritoneal macrophages from control and anti-miR33 treated cells. Mitochondrial DNA per ng of total cellular DNA was evaluated by quantitative PCR and is expressed relative to control. **p≤0.01 compared to control anti-miR (D) OXPHOS complexes I-V in macrophages transfected with control anti-miR or anti-miR33 by Western blot and quantified using Image J. *p≤0.05 compared to control anti-miR, as measured from duplicate lanes from at least 6 independent experiments.