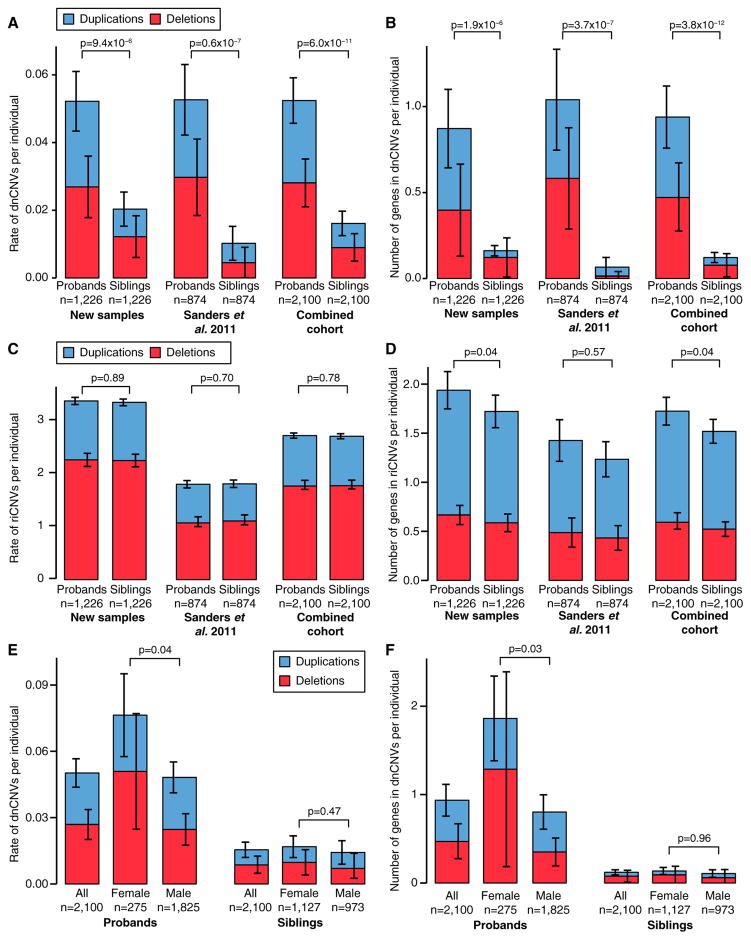
Figure 2. CNV Burden in the SSC.
(A) The rate of dnCNVs per individual in probands and family-matched sibling controls for deletions (red) and duplications (blue) are compared for new families (n = 1,226; left), previously published families (n = 874; middle), and the combination of these two cohorts (n = 2,100; right).
(B) The analysis presented in (A) is repeated except the number of genes within dnCNVs per individual is displayed rather than the rate of dnCNVs per individual. (C and D) The analyses presented in (A) and (B) are repeated using riCNVs instead of dnCNVs.
(E) The rate of dnCNVs per individual is shown for probands (left three bars) and siblings (right three bars). Within each group, the rate of dnCNVs is shown for all individuals (left), females (middle), and males (right). No statistical comparison was made between probands and siblings for this analysis.
(F) The analysis in (E) is repeated except the number of genes within dnCNVs per individual is displayed rather than the rate of dnCNVs per individual.
Statistical significance was calculated using a one-sided sign test for (A), a one-sided paired Wilcoxon ranked-sum test (WRST) for (B)–(D), and a two-sided unpaired WRST for (E) and (F). Whiskers show the 95% confidence intervals throughout (A)–(F).

