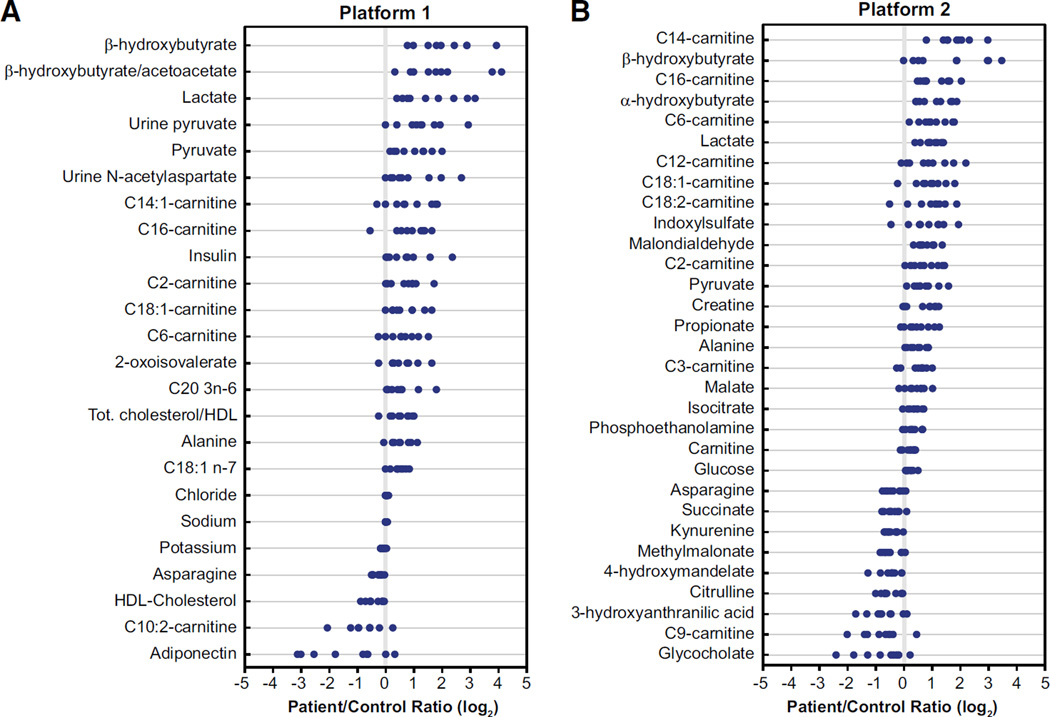
Figure 2. Individual Analytes with Statistical Significance in LSFC Patients versus Controls.
(A) Platform 1; (B) Platform 2. Each dot represents a log2-transformed patient/matched control ratio. Metabolites are ordered by mean log2-transformed patient/control ratio. See also Figure S2 for data presented as volcano plots, Figure S1 for a summary of measured analytes, and Table S2 for log2-transformed ratios and p values of all analytes.

