
Figure 7. InsG3680 and R1117X Mutant Mice Display Anxiety Behavior and Social Interaction Deficits.
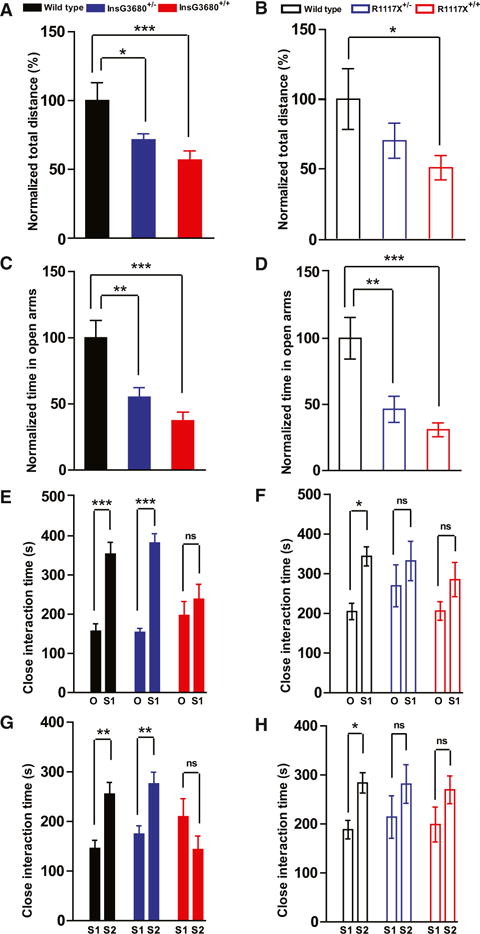
(A and B) Total distance traveled in the open field test as normalized to wild-type littermates.
(C and D) Time spent in the open arms in the elevated zero maze test as normalized to wild-type littermates.
In the InsG3680 cohort, n = 17 mice for wild-type; n = 19 mice for InsG3680+/−; n = 18 mice for InsG3680+/+ group. In the R1117X cohort, n = 15 mice for wild-type, n = 15 mice for R1117X+/−; n = 15 mice for R1117X+/+.
(E and F) Time spent on close interaction with an object (O) versus stranger mice (S1) in the phase II social interaction test.
(G and H) Time spent on close interaction with a familiar mouse (S1) versus stranger mouse (S2) in the phase III social interaction test.
In the InsG3680 cohort, n = 17 mice for wild-type; n = 19 mice for InsG3680+/−; n = 18 mice for InsG3680+/+ group; in the R1117X cohort, n = 23 for wild-type, n = 25 for R1117X+/−; n = 24 for R1117X+/+ group.
In all the panels, data are presented as mean ± SEM, *p < 0.05, **p < 0.01, ***p < 0.001; one-way ANOVA with Bonferroni post hoc test.