
Figure 1. Identification of Two Main Subtypes of Renal Oncocytoma.
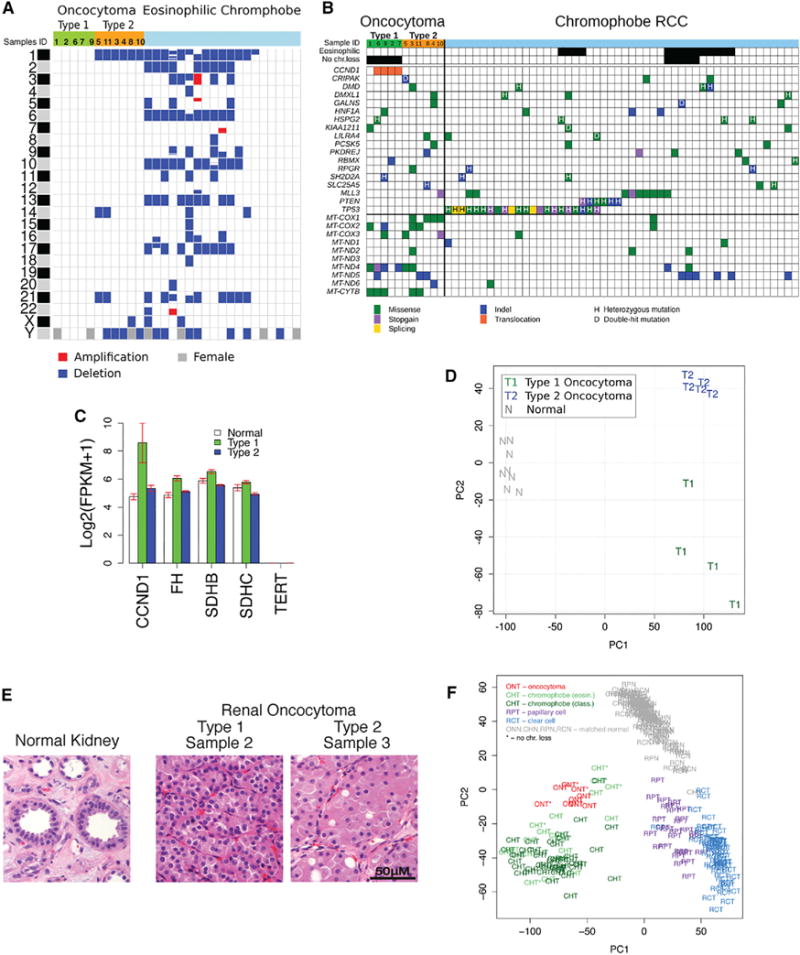
(A) Copy-number variations in renal oncocytomas in comparison to eosinophilic ChRCC (eosinophilic ChRCC sequencing data were downloaded from the TCGA CGHub repository [https://cghub.ucsc.edu/]) (Davis et al., 2014). Blue corresponds to loss of one copy, red corresponds to a gain, and gray on chromosome Y indicates a female.
(B) Somatic mutations in renal oncocytomas in comparison to ChRCC (ChRCC sequencing data were downloaded from the TCGA CGHub repository [https://cghub.ucsc.edu/]) (Davis et al., 2014). Only SNVs common between oncocytoma and ChRCC are shown; the complete list of detected somatic SNVs and indels is reported in Tables S2 and S3.
(C) Expression levels of key genes from the transcriptome analysis. Each bar represents log2-transformed transcript abundance. Error bars show SEs.
(D) Principal component analysis (PCA) of gene expression identifies two subtypes of oncocytoma. The first principal component (PC1) separates tumor and normal samples; the second principal component (PC2) separates oncocytomas into two subtypes.
(E) Type 1 and type 2 oncocytomas have distinct histology, with type 2 having a larger volume of eosinophilic cytoplasm relative to the nucleus. Error bar, 50 μm.
(F) Gene expression similarities between oncocytoma and ChRCC. PCA of gene expression for oncocytoma, ChRCC, clear cell RCC, and papillary cell RCC identify the three RCC subtypes as separate clusters with the corresponding matched normal samples forming one cluster. Oncocytomas cluster with ChRCC demonstrating similarities in gene expression patterns.