
Figure 1. Rapamycin treatment increased neuronal ATP levels.
(A) The effect of rapamycin (RAPA) on cellular ATP level was examined in 5-week neurons differentiated from human neuroprogenitor cells (NPCs) derived from H9 ESCs. Rapamycin was used at 20 nM (final concentration). Mitochondrial dysfunction was mimicked by chemicals disrupting mitochondrial oxidative function: oligomycin (2 µM), blocking complex V (ATP synthase); rotenone and antimycin A (R&A; 1 µM each), complex I and III inhibitors; CCCP (20 µM), a mitochondrial uncoupler. All were prepared in DMSO as vehicle. N-acetylcysteine (NAC) was used at 750 µM (final concentration). The treatment was done for 6 hr with neurons grown in duplicate wells from the same batch of differentiation. The relative ATP level for each treatment was calculated as percentage after normalization to DMSO-treated neurons. Bars are mean ± SD, n=3. *p<0.05. **p<0.01, calculated by two-tailed t-test. (B) Immunoblot analysis of cell lysates prepared from neurons treated with oligomycin, rapamycin or both for 6 hr. The intensity of phosphorylated protein was quantified after normalization to non-phosphorylated signal, and was presented as fold change compared to control group treated with DMSO. (C) Immunoblot analysis of cell lysates prepared from neurons treated with oligomycin or AICAR for 6 hr. (D) Oxygen consumption rate (OCR) measurement by Seahorse extracellular flux analyzer. The basal OCRs of neurons treated with rapamycin for 6 hr were compared to neurons treated with DMSO as control. Bars are mean ± SD, n=3. (E) Immunoblot analysis of cell lysates prepared from neurons treated with CCCP for 6 hr. (F) Immunoblot analysis of cell lysates prepared from neurons treated with rotenone and antimycin-A for 6 hr. (G) Immunoblot analysis of cell lysates prepared from neurons treated with oligomycin or rotenone & antimycin-A for 20 min. (H) Immunoblot analysis of cell lysates prepared from NPCs treated with rapamycin, oligomycin, and rotenone/antimycin-A for 6 hr. (I) Immunoblot analysis of cell lysates prepared from NPCs treated with oligomycin or rotenone & antimycin-A for 20 min. (J) The effect of protein synthesis inhibition on cellular ATP level was examined in 5-week neurons differentiated from human neuroprogenitor cells (NPCs) derived from H9 ESCs. Cycloheximide (CHX) was used at 20 µg/ml, and 4E1RCat was used at 50 µM. The treatment was done for 2 hr with CHX and 4E1RCat alone, and for 6 hr when combined with mitochondrial inhibitors with neurons grown in duplicate wells from the same batch of differentiation. (K) Five-week neurons differentiated from human neuroprogenitor cells (NPCs) derived from H9 ESCs were treated with vehicle (DMSO) or rotenone & antimycin-A (R&A). Protein synthesis was measured by pulsing for 2 hr with 35S-Cys/Met every 2 hr from 0 to 6 hr, and 35S incorporation into protein and neuronal ATP levels were quantified and normalized to the DMSO-treated controls. Data are mean ± SD, n=3. (L) Five-week neurons differentiated from human neuroprogenitor cells (NPCs) derived from H9 ESCs were treated for vehicle (DMSO), rotenone & antimycin-A, rapamycin or both (R&A Rapa) for 4 hr. Protein synthesis was measured by labeling for 2 hr with 35S-Cys/Met from 2 to 4 hr. **p<0.01, calculated by two-tailed t-test. (M) Protein synthesis in NPCs derived from H9 ESC treated with rotenone & antimycin-A for 6 hr. Data are mean ± SD, n=3. All the experiments were repeated at least three times. (see associated Figure 1—source data 1).
DOI: http://dx.doi.org/10.7554/eLife.13378.003

Figure 1—figure supplement 1. Five-week neurons differentiated from human neuroprogenitor cells (NPCs) derived from H9 ESCs were treated for vehicle (DMSO), cycloheximide and 4E1RCat.
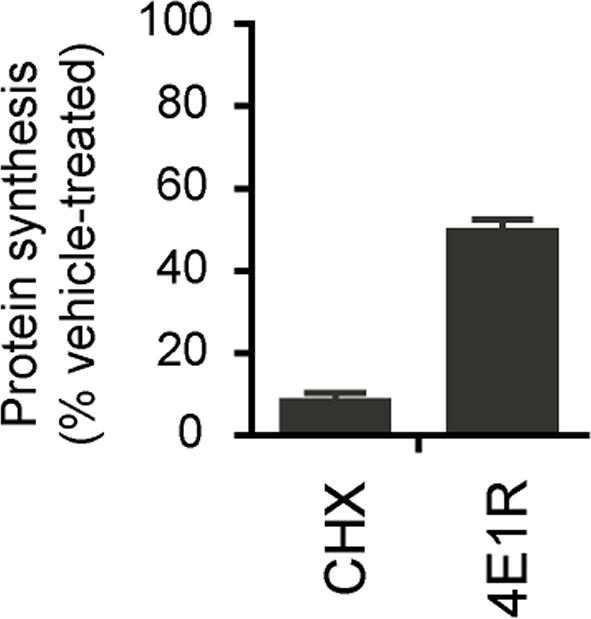
Figure 1—figure supplement 2. The glucose concentration in the medium growing 3-week neurons derived from H9 ESCs treated with DMSO and rapamycin for 8 hr were quantified by YSI 2950 metabolite analyzer.
