
Figure 2. Established iPSCs and neuroprogenitor cells (NPC) from GM13411, a MILS fibroblast line.
(A) T8993G iPSC expressed pluripotency markers that included Tra-1–60, Lin28, Tra-1–81 and Nanog. NPCs derived from T8993G iPSCs were stained with anti-Sox2 and Nestin. (B) T8993G mutation generates a Sma I restriction enzyme site. T8993G iPSCs and NPC cells still retained the mutation as confirmed by PCR and Sma I digestion. DNA products were separated on agarose gel by electrophoresis. (C) Mitochondrial membrane potential analyzed by fluorescence-activated cell sorting (FACS) using TMRE staining. Two lines of iPSCs, NPCs and neurons derived from BJ fibroblasts and one from H9 hESCs were used as controls (WT). The relative mitochondrial membrane potential was presented as percentage compared to the mean of control. Bars are mean ± SD, n=3. The experiment was repeated three times. (D) Cellular reactive oxygen species (ROS) analyzed by FACS using CM-H2DCFDA staining. Two lines of iPSCs, NPCs and neurons derived from BJ fibroblasts and one from H9 hESCs were used as control (WT). The relative ROS level was presented as percentage compared to the mean of control. Bars are mean ± SD, n=3. The experiment was repeated three times. (E) T8993G NPCs and neurons had higher expression of oxidative stress response genes including SOD1, GPX1 and GSS. Two lines of iPSCs, NPCs and neurons derived from BJ fibroblasts and one from H9 hESCs were used as control (WT). The gene expression levels were quantified by real-time PCR after normalization to β-actin. The relative expression level was presented as percentage compared to the mean of control. Bars are mean ± SD, n=3. The experiment was repeated three times. (F, H, J) Oxygen consumption rate (OCR) measured by Seahorse extracellular flux analyzer. FCCP (F) is a mitochondrial uncoupler; rotenone and antimycin A (R&A) are complex I and III inhibitors. Error bars represent SD, n=6. Non-mitochondrial oxygen consumption has been subtracted. The relative percentage of basal and maximum OCR of T8993G iPSC, NPC and neurons at 3 weeks of differentiation were calculated by comparing to the mean of BJ and H9 cells (WT). The original data was in Figure 2—figure supplement 9. (G, I, K) Measurement of lactate secreted by iPSCs, NPCs and neurons at 3 weeks of differentiation. The relative percentage of secreted lactate from T8993G iPSC, NPC and neurons was calculated by comparing to the mean of BJ and H9 cells. Bars represent mean ± SD. n=3. *p<0.05. Calculated by two-tailed t-test. The experiments were repeated three times. (see associated Figure 2—source data 1).
DOI: http://dx.doi.org/10.7554/eLife.13378.007

Figure 2—figure supplement 1. RT-PCR analysis of pluripotency genes, OCT4, NANOG, KLF4 and SOX2 in T8993G and BJ iPSCs.
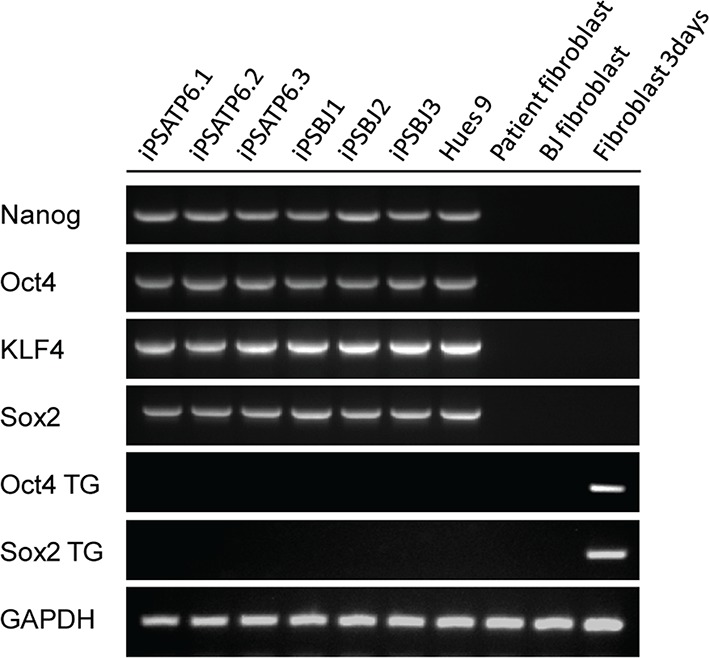
Figure 2—figure supplement 2. Karyotypes of three T8993G iPSC clones, 46, XY; and one BJ iPSC, 46, XY.
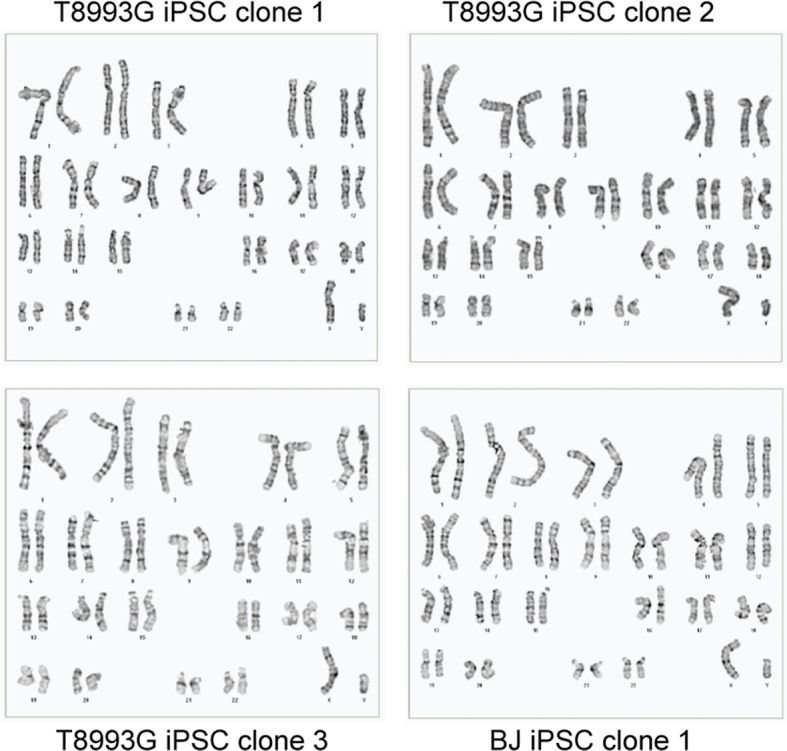
Figure 2—figure supplement 3. Sequencing of mitochondrial DNA extracted from T8993G (GM13411) and BJ iPSCs.
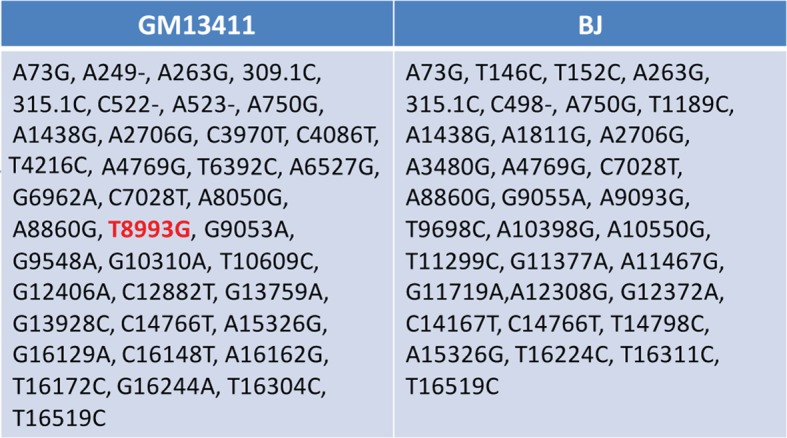
Figure 2—figure supplement 4. The outline of the protocol used to differentiate neurons from iPSCs; representative pictures of fibroblasts, iPSCs, embryoid bodies (EB) and neural rosettes.

Figure 2—figure supplement 5. Sanger sequencing confirmed the T8993G mutation (upper panel, representative result).

Figure 2—figure supplement 6. T8993G iPSCs, NPC cells and neurons all had an extremely high T8993G mtDNA mutation load as GM13411 fibroblast.
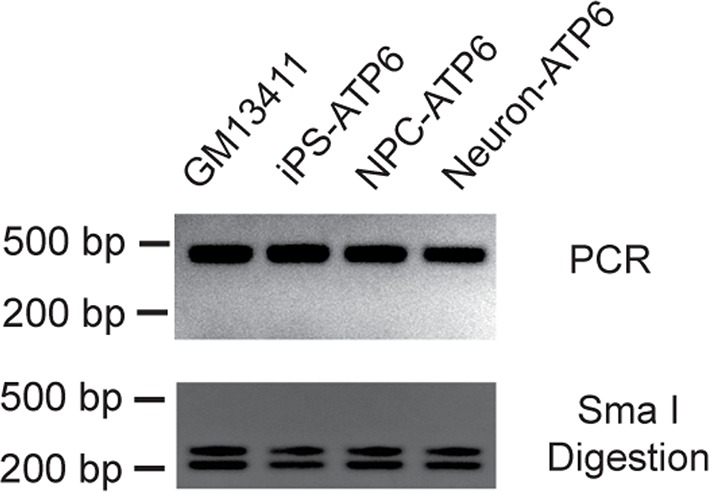
Figure 2—figure supplement 7. Neuronal marker staining.

Figure 2—figure supplement 8. Electrophysiological study of T8993G and BJ 5-week neurons.
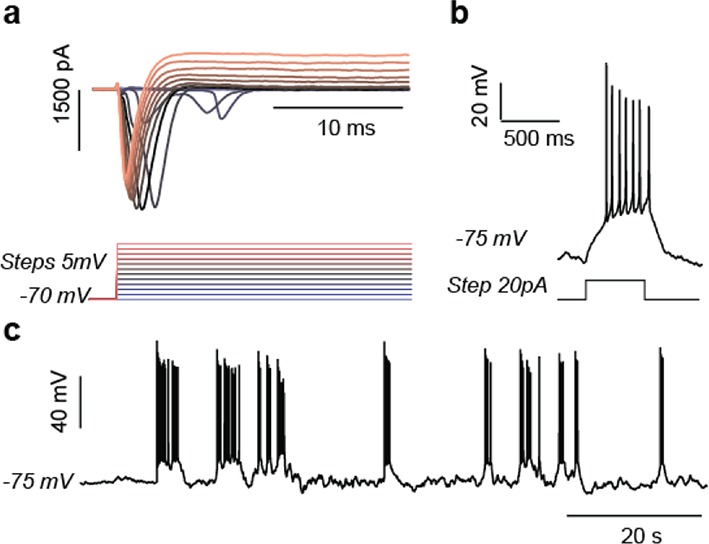
Figure 2—figure supplement 9. Oxygen consumption rate (OCR) analysis by Seahorse extracellular flux analyzer on BJ, H9 and ATP6 T8993G iPSCs, NPCs and 3-week neurons.
