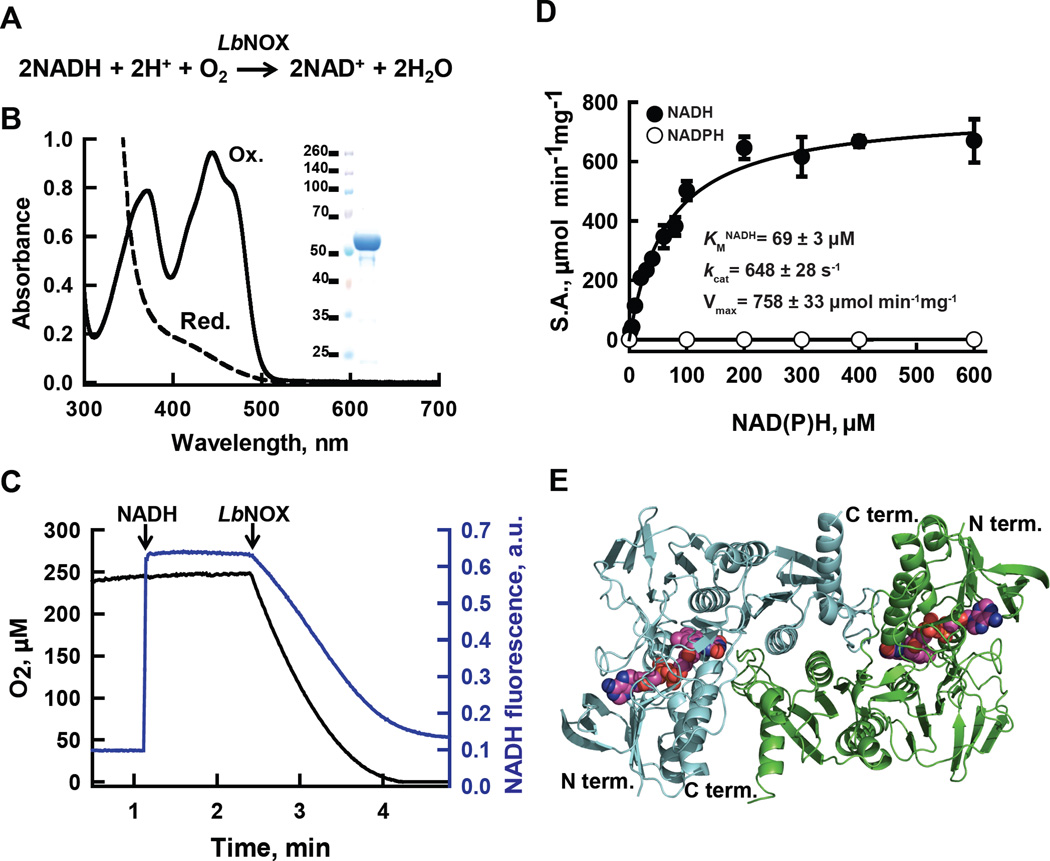
Figure 1. H2O-forming NADH oxidase from L. brevis (LbNOX.
(A) Reaction catalyzed by LbNOX. (B) UV-visible spectrum of purified LbNOX. Protein (83 µM FAD active sites) in oxidized form (solid line) and after addition of excess of sodium dithionite, reduced form (dashed line). Inset: SDS-PAGE of purified LbNOX. (C) Simultaneous measurement of NADH and oxygen consumption by LbNOX. NADH and LbNOX were added as indicated by arrows. (D) Dependence of the specific activity of recombinant LbNOX on the concentration of NADH and NADPH. Reported values for Vmax, kcat and KM for NADH represent the mean ± S.D. from n=4 independent experiments. (E) Crystal structure of the catalytic dimer of LbNOX. Each of the two-fold symmetry related monomers (cyan and green ribbons) contain bound FAD, shown here in sphere (CPK) representation. Details of the catalytic center on the si-face of FAD and of the substrate selectivity loop are shown in fig. S3A–C.

