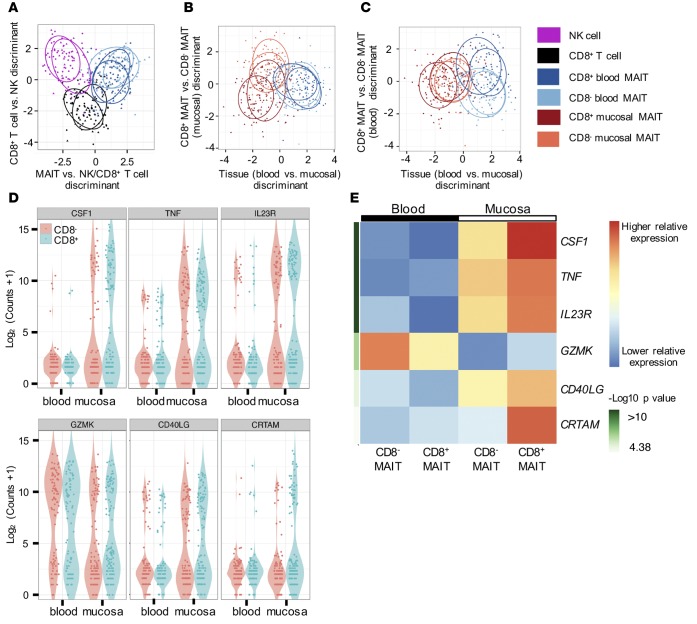
Figure 6. Mucosal MAIT cells are poised to respond more rapidly based on single cell gene expression analysis of MAIT cells isolated from blood and mucosal tissue.
(A) Linear discriminant analysis of selected activation and inflammation genes expressed in CD8+ MAIT cells (dark blue), CD8– MAIT cells (light blue), CD8+ T cells (black), and NK cells (purple) isolated from the blood (n = 2). (B and C) CD8+ and CD8– MAIT cells from blood are compared with CD8+ (dark orange) and CD8– (light orange) MAIT cells isolated from rectal mucosal tissue. A confidence ellipse shows the expression profile of each donor (n = 2). (D) Violin plots of the top 6 genes that are differentially expressed (defined by Bonferroni significance) in CD8+ and CD8– MAIT cells from blood and mucosa show gene expression on a single cell level. Each single CD8+ (blue) and CD8– (red) MAIT cell in the blood and tissue is represented as a single dot (n = 2 donors). (E) Relative gene expression levels of the top 6 genes that are differentially expressed in CD8+ and CD8– MAIT cells from blood (columns 1 and 2) and mucosa (columns 3 and 4) are indicated in red (high) and and blue (low). Significant P values comparing CD8+ and CD8– MAIT cells in blood and CD8+ and CD8– MAIT cells mucosal tissue are shown as –log10 values ranging from greater than 10 (dark green, top genes) to 4.38 (light green, bottom genes). See Methods for full statistical methods.

