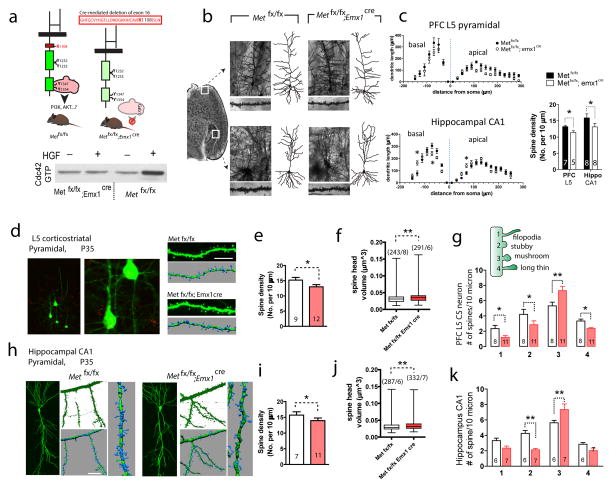
Figure 3. Conditional Met knockout leads to morphological alterations in dendritic and spine structures in forebrain neurons.
(a) Schematic representation of dorsal pallium specific Met cKO (Met fx/fx; emx1cre) mice. Cre-mediated excision of Exon 16, which encodes a critical ATP-binding site (Lys1108), inactivates the intracellular tyrosine kinase activity of MET and abrogates adaptor protein recruitment and downstream signaling. Consistently, HGF treatment in cKO PFC slices failed to induce an increase in pY1234/1235 (n = 2, quantification not shown). (b) Photomicrograph of Golgi-stained prefrontal (infra-limbic) L5 pyramidal neuron, and hippocampus CA1 neuron in Metfx/fx and cKO brains. A representative dendritic arbor reconstructed in 3D using Neurolucida for each neuron was shown on the right, and dendritic segments from which dendritic spine density was calculated were shown below the image. (c) Sholl analysis of PFC L5 and hippocampal CA1 neuron dendritic complexity. A significant reduction of dendritic length was found in PFC L5 (two-way ANOVA with Bonferroni post hoc test, F(1, 288) = 19.06. n = 7 neurons/3 mice for Metfx/fx and n = 8/4 for cKO. *p < 0.05). No significant overall difference was found for CA1 neurons (F(1, 315) = 0.003. n = 8 neurons/3 mice for Metfx/fx and n = 9/3 for cKO), while dendritic length was distributed differently (*p < 0.05). Dendritic spine density showed a significant reduction in both prefrontal L5 pyramidal neuron and CA1 pyramidal neuron in cKO brains (n = 10 neurons/3 mice, *p < 0.05, t test). (d) Dendritic spine morphology in P35 PFC L5 corticostriatal neurons, labeled by red retrograde ‘beads’, was reconstructed using Imaris and high-resolution confocal Z stack images. (e) Met cKO PFC L5 neurons showed a significant reduction in spine density (t19 = 3.67, * p < 0.05). (f) Dendritic spine head volume in cKO PFC L5 neurons is significantly larger (**p < 0.01). (g) Dendritic spines from cKO PFC L5 neurons show significantly increased number in ‘mushroom’ type (**p < 0.01), while significant decreased numbers in all other categories (* p < 0.05). Numbers labeled on bar denotes number of neurons, based on which > 500 spines were analyzed for each group. (h) Morphological reconstruction of CA1 neuron spines. (i–j) CA1 neurons from cKO mice show a significant reduction in spine density (i, t16 = 3.42, *p < 0.05), and a significant increase in dendritic spine head volume (j, **p < 0.01). (k) CA1 neuron dendritic spines from cKO mice show significant increased number in ‘mushroom’ type (**p < 0.01), and significant decreased numbers in the ‘stubby’ category (**p < 0.01).

