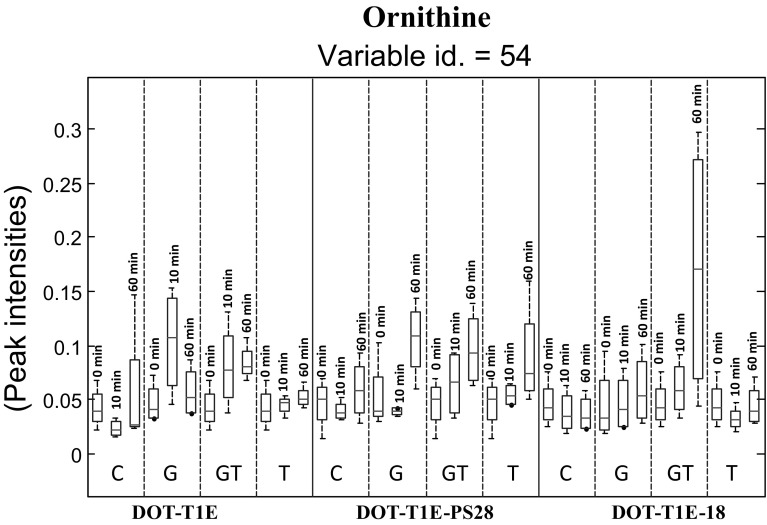
Fig. 5.
Box-whisker plot showing the alterations in ornithine levels (variable id 54) in control and cells exposed to toluene for four biological replicates. The red lines represent the median m/z intensity. Box plot represents the data for three P. putida strains, four conditions of toluene and three time points, dashed lines separate different conditions of toluene and solid line separates different strains. Code: control—no toluene (C), cells exposed to 0.1 % (v/v) toluene (T), toluene gas (G), and toluene gas and 0.1 % (v/v) toluene (GT)

