

Abstract
Most common hereditary diseases in humans are complex and multifactorial. Large scale genome-wide association studies based on SNP genotyping, have only identified a small fraction of the heritable variation of these diseases. One explanation may be that many rare variants (a minor allele frequency, MAF < 5%), which are not included in the common genotyping platforms, may contribute substantially to the genetic variation of these diseases. Next-generation sequencing, which would allow the analysis of rare variants, is now becoming so cheap that it provides a viable alternative to SNP genotyping. In this paper, we present cost-effective protocols for using next-generation sequencing in association mapping studies based on pooled and un-pooled samples, and identify optimal designs with respect to total number of individuals, number of individuals per pool, and the sequencing coverage. We perform a small empirical study to evaluate the pooling variance in a realistic setting where pooling is combined with exon capturing. To test for associations, we develop a likelihood ratio statistic that accounts for the high error rate of next-generation sequencing data. We also perform extensive simulations to determine the power and accuracy of this method. Overall, our findings suggest that with a fixed cost, sequencing many individuals at a more shallow depth with larger pool size achieves higher power than sequencing a small number of individuals in higher depth with smaller pool size, even in the presence of high error rates. Our results provide guidelines for researchers who are developing association mapping studies based on next-generation sequencing.
Introduction
Determining the genetic basis of complex genetic diseases is one of the main challenges in human genetics [Altshuler et al., 2008; Frazer et al., 2009; Kruglyak, 2008; McCarthy et al., 2008; McCarthy and Hirschhorn, 2008]. Genome-wide association mapping studies (GWAs) have revealed many susceptability loci for complex diseases such as diabetes, hypertension, bipolar, Crohn’s disease and others [Barrett et al., 2008; Consortium, 2007; Hindorff et al., accessed 1 Apr 2009; Thomas et al., 2009]. However, despite many successes, a majority of the additive generic variance still remains unexplained [Altshuler et al., 2008; Frazer et al., 2009; Kruglyak, 2008; McCarthy and Hirschhorn, 2008]. One explanation for this result is that rare variants might play a significant role in complex diseases. Since genotyping platforms include SNPs that are discovered by sequencing a small panel, most of the included SNPs are common variants (MAF > 5%; [Frazer et al., 2007]) in previous GWAs. The importance of rare variants in understanding complex traits has been discussed in a number of recent studies [Azzopardi et al., 2008; Bodmer and Bonilla, 2008; Cohen et al., 2004, 2006; Gorlov et al., 2008; Iyengar and Elston, 2007; Ji et al., 2008; McClellan et al., 2007; Polychronakos, 2008]. For example, in a re-sequencing study of three genes, Ji et al. [2008] found several rare mutations related to hypertension, appearing in the heterozygous state.
The cost of re-sequencing has dropped dramatically over the past few years [Bentley et al., 2008; Wang et al., 2008; Wheeler et al., 2008]. This recent development has made next-generation re-sequencing a viable alternative to SNP genotyping based on chips or other platforms [Bentley et al., 2008; Hillier et al., 2008; Van Tassell et al., 2008]. However, in most studies full genome-wide re-sequencing at a high depth is still prohibitively expensive. Instead, two strategies are being used to reduce costs: (1) sequencing of the exome only - using various exon capturing techniques and (2) the use of pooled samples. With recent developments in exon capturing techniques, most of the human exons can be efficiently captured [Albert et al., 2007; Gnirke et al., 2009; Hodges et al., 2007; Krishnakumar et al., 2008; Okou et al., 2007; Porreca et al., 2007]. While many functional variant may lie in noncoding regions, many of the mutations with the best potential for translational medicine are in coding regions, providing an extra motivation for focusing on the exome [Jones et al., 2009; Kryukov et al., 2009; Raymond et al., 2009].
The use of pooled samples is particularly attractive in two-stage designs [Chi et al., 2009; Skol et al., 2006; Wang et al., 2006; Zuo et al., 2008, 2006]. In the first stage of a two-stage design, a large number of markers are genotyped, or re-sequencing is being used, on a moderate number of individuals. In the second stage, the most promising markers from the first stage are further examined by genotyping in a larger set of individuals. To reduce the cost of large-scale association studies, pools of DNA from many individuals have been successfully used in the first stage of the two-stage design [Bansal et al., 2002; Boss et al., 2009; Nejentsev et al., 2009; Norton et al., 2004; Sham et al., 2002]. The use of pooled samples reduces cost, particularly when combined with techniques such as exon-capturing which has a cost associated with each pool to which it is applied. With the advent of cheap re-sequencing techniques, a viable, an economically attractive protocol for GWAs may include an initial stage of exon capturing and re-sequencing in pooled samples [Druley et al., 2009; Ingman and Gyllensten, 2008; Jones et al., 2009; Lavebratt and Sengul, 2006], and a second stage based on genotyping of the best candidate SNPs from the first stage. Such a protocol is cost effective and has the potential to detect rare SNPs that would not be captured by any of the major genotyping platforms.
Here, we examine the feasibility of this protocol, using both pooled and un-pooled samples. There are a number of issues related to this protocol that warrants further research, including the effects of sequencing errors and pooling variance, and the consequences of these factors for the choice of optimal experimental protocol.
We first make a limited experimental study based on Nimblegen R exons capturing, and sequencing using the Illumina genome analyzer®, to determine the feasibility of studies based on a combination of these techniques. We then use the results of this study to model the protocol using realistic parameters. We perform simulations to determine power and to identify optimal designs.
Methods
Experimental design
Our analyzes assume a two-stage design, where the first stage may include exon capturing and/or pooled samples, and will involve next-generation re-sequencing. The second stage is based on traditional SNP genotyping of the most promising variants from the first stage. While the properties and design of the second stage have been explored extensively in previous work [Skol et al., 2006; Zuo et al., 2008], the use of next-generation sequencing for the first stage has not previously been explored to the same degree [Nejentsev et al., 2009].
Experimental data
A small empirical study was conducted to evaluate feasibility of this novel approach and assess the variability introduced in real experiments. Genomic DNA was purified from blood leucocytes from 5 Danish volunteers recruited at Steno Diabetes Center, Denmark. The volunteers gave informed consent and the research protocol which is focused on studies of the genetics of metabolic disorders was approved by the local Ethical Committee of Copenhagen. Two pools were constructed, one with two individuals and the other with five individuals. Pooling DNA of individuals was done following the pre-PCR protocol described in Lavebratt and Sengul [2006] with some small modification. In our procedure, individual DNA was diluted to 10 ng/μl instead to 5 ng/μl before pooling. Our pooling procedure is summarized in Supplementary Figure 1. Exon-capturing was performed using a NimbleGen chip® [Albert et al., 2007], which captures 6,726 ‘exonic’ regions covering ~ 5 Mb sequence. The DNA sample in each pool was fragmented to an average size of 500bp, end repaired, ligated to Solexa adaptors®, hybridized and captured using the high-density oligonucleotide microarray. Finally, the DNA sample was amplified using PCR, and the eluted sample from it was sequenced using Solexa Genome Analyzer II®. Solexa sequence reads were aligned to the reference human genome(NCBI build 36) using read-alignment program SOAP [Li et al., 2008].
In our design, reads from individuals in pools could be identified after re-seqrencing because they were re-sequenced both individually and in pools. The individual re-sequencing allowed the identification of unique mutations specific to each individual. Pooling efficacy was then measured by the degree to which the pooled DNA was comprised of an equal contribution of DNA from each individual.
One way to model the pooling efficacy is as follows.
| (1) |
where Yi,A and Yi,a are the counts of read bases generated from the two alleles in individual i. The parameter μ is the mean depth of each allele and αp is the parameter of a standard gamma distribution used to model the pooling variance. The proportion of DNA from each individual in the pool is then . It follows from standard probability theory that (R1,…,RPs)~Dirichlet(αp), where Ps is the number of individuals per pool (pool size). If there is an equal amount of DNA from each individual then
| (2) |
The parameter αp controlling the pooling variance is estimated from the data using the maximum likelihood method.
Variation in exon-capturing efficacy introduces extra variation in read depth across the sites. High depth implies efficient exon-capturing, and low depth implies poor exon-capturing performance. We model the exon capturing efficacy as a gamma distribution.
| (3) |
where μt is the mean total depth at site j. Exon-capturing might fail for some sites. In that case, the capturing efficacy can be modeled as a mixture of a point mass at zero and a gamma distribution.
We estimate the sequencing error rate conservatively as the average mismatch rate. Specifically, all the counts of pairwise mismatches between the reference human genome and aligned reads were averaged across targeted regions as well as across the aligned reads.
Experimental cost
In order to illustrate how to make cost effective choices regarding optimal design, we will make assumptions regarding experimental cost. Obviously, costs can change rapidly and design of individual studies should take current costs into consideration. It should be noticed that our general conclusions are not dependent on the specific assumptions regarding costs made here. In the most general pooled design, the total cost of an experiment has four components: cost of obtaining DNA samples, cost of pooling DNA samples, exon-capturing, and sequencing. We will in the following ignore the cost of obtaining DNA samples and assume that such samples are available before the onset of the study. The DNA pooling cost mainly depends on the total number of individuals that are pooled. The key step in pooling is to dilute and accurately quantify the DNA concentration of each individual sample. We will here assume, for the sake of example, that initial preparation for each individual in a pool costs $2. We will assume that exon-capturing covering all human exons (~ 30Mb) costs $3,500 for each pool. The cost of sequencing is divided into two parts, a cost of preparation of the DNA sample which we will assume is $200, and a cost associated with the production of sequencing reads. We will assume a cost of $500 for Solexa-sequencing of a 30Mb exonic region at a depth of 2X (for details, see Supplementary Methods). The assumed experimental costs are summarized in Table 1. Notice that for individual sequencing, the exon-capturing cost rapidly increases with the number of individuals, even if the sequencing cost is fixed. The use of pooled samples allow deeper sequencing at the same cost.
Table 1.
Examples of experimental costs for re-sequencing of pooled or un-pooled DNA samples in targeted regions. The cost settings are obtained by assuming Solexa-sequencing of pooled or unpooled DNA samples on the human exome (~30 Mb), captured using Nimblegene arrays.
| # of cases/cases | pool size | depth per-indiv | Experimental cost (unit: $1000)
|
|||
|---|---|---|---|---|---|---|
| Pooling | Exon-capturing | Sequencing | Total | |||
| 500 | 1 | 8X | 0 | 3,500 | 2,200 | 5,700 |
| 1000 | 1 | 4X | 0 | 7,000 | 2,400 | 9,400 |
| 2000 | 1 | 2X | 0 | 14,000 | 2,800 | 16,800 |
|
| ||||||
| 500 | 1 | 8X | 0 | 3,500 | 2,200 | 5,702 |
| 1000 | 2 | 4X | 4 | 3,500 | 2,200 | 5,704 |
| 2000 | 4 | 2X | 8 | 3,500 | 2,200 | 5,708 |
| 4000 | 8 | 1X | 16 | 3,500 | 2,200 | 5,716 |
|
| ||||||
| 1000 | 5 | 4X | 4 | 1,400 | 2,080 | 3,484 |
| 1000 | 5 | 8X | 4 | 1,400 | 4,080 | 5,484 |
| 1000 | 5 | 16X | 4 | 1,400 | 8,080 | 9,484 |
Likelihood ratio test
The data produced by next-generation sequencing differs from that of SNP-chips. Genotyping, in principle, reveals the two alleles in each individual in each targeted nucleotide site. Next-generation re-sequencing produces large amounts of short reads. After mapping to the reference genome, an alignment of reads across the targeted regions is obtained. A schematic example of re-sequencing data at a single site is shown in Figure 1. In this particular example, cases and controls each consist of two pools with two individuals. Each nucleotide site in each individual is represented in reads a random number of times. It is generally unknown which of the two alleles in an individual is represented in a particular read. Also, there is a high probability of sequencing errors.
Figure 1.

Schematic illustration of the next-generation sequencing data at a single position. Each case and control sample consist of two pools with two individuals in each pool. The two alleles of each individual are shown in the ‘Genotype’ column. There are two types of alleles (A shown in black and a shown in red). Each allele appears a random number of times, and may have been affected by sequencing errors (green).
One of the main challenges in the use of next-generation sequencing data in association mapping studies aimed at detecting associations with rare SNPs, is to distinguish between true SNPs and false SNPs caused by sequencing errors. The nature of the data is such that, even after basic bioinformatic quality control procedures, sequencing errors remain a serious problem. Power can be gained by incorporating the possibility of errors into the statistical framework used for detecting associations. There is a trade-off between eliminating too many putative SNPs as sequencing errors, thereby eliminated a number of true SNPs, and eliminating too few putative SNPs, and then suffer a serious multiple testing problem. A full likelihood approach incorporated into the association mapping testing procedure may help to directly identify the optimal balance between eliminating to few or too many putative SNPs in a particular design, and to select the putative SNPs that most likely are associated with the trait. We have developed a simple version of such a likelihood approach. We have also extended this method so it can be applied to provide a more powerful method for pooling designs.
In the following, we will discuss how the method can be developed into a likelihood ratio test used to test the standard hypothesis: H0 : p1 = p2 (= p0) vs HA : p1 ≠ p2, where p1 and p2 is the minor allele frequency in cases and controls, respectively.
We test each site, j, independently of each other. Suppose that for both cases and controls, there are Npool pools with Ps individuals per pool. After re-sequencing, for each pool m, an alignment of reads is obtained, where is the kth read among the total V(m) reads in locus j. Let G(m) be the number of A (minor) alleles in pool m. (Note that G(m) is not observed.) Each observed read is a copy of one of the alleles in a pool, but copying is made with error rate ε (= P (read = A|allele = a) = P (read = a|allele = A)).
Then our likelihood ratio statistic (LRT) is computed as:
and, the likelihood for each pool m is computed as:
where is the number of A in reads. The last equation is motivated as follows: G(m) follows a binomial distribution with Spool (= 2Ps) number of trials each with probability p0 (assuming no population structure). Given that there are k minor alleles (A) in a pool, each read becomes of type A with probability k/Spool if there are no errors. If errors occur, the probability is Assuming homogeneity in sequencing efficiency across chromosomes (i.e., the number of sequenced reads for each allele follows the same distribution) and independence, the number of A reads in the pool follows a binomial distribution. Notice that the total number of reads in each pool (V(m)) is assumed to be given.
Maximization of the likelihood function was done using a bounded version of the BFGS algorithm [Broyden, 1970; Fletcher, 1970; Goldfarb, 1970; Shanno, 1970] or the Simplex method [Nelder and Mead, 1965]. Overall, the Simplex method algorithm performed better, presumably because the computational expense in numerically approximating the gradient in the BFGS algorithm overwhelmed the faster convergence of this algorithm for this low dimensional problem. Computing our LRT statistic for 1,000 sites takes 69 seconds with the Simplex algorithm, but 136 seconds with BFGS algorithm on a standard dekstop computer, for a total of 10,000 reads from 500 cases and 500 controls in 1,000 pools.
Simulating data
Assuming a single causative SNP, we performed extensive simulations to examine the statistical properties of the method. In these simulations, the power was evaluated as the probability of including the causative SNP among the set of SNPs selected for the second stage in a two-stage design. We then varied (1) the sequencing error rate per base pair, (2) the number of cases and control individuals, (3) the pool size (the number of individuals per pool), and (4) the sequencing depth per individual. To simplify the simulation procedure, we do not attempt to take population structure and linkage disequilibrium across loci into account. The general conclusions regarding relative power of different designs should not be affected by the strength of LD. For simplicity, we use equal numbers of cases and controls for all of our simulations, so, in the subsequent description, the number of total individuals is twice the number of cases (if not otherwise stated).
Each data set consists of aligned reads from a 300Kb region, which contains one causative SNP. The null set consists of two subsets, a set of true SNPs and a set of “false” SNPs. False SNPs are sites that are invariable in the sample but appear polymorphic due to sequencing errors. Based on the results of the empirical study, we will assume an error rate of 1%, if not otherwise stated. We compute the number of true SNPs in the region assuming a mutation rate of 5×10⁻⁴, as estimated in coding regions by Wang et al. [2008]. For example, with 1000 cases and 1000 controls, the number of SNPs is computed as . For each true SNP under the null, the minor allele frequency (MAF) is drawn from the distribution of sample frequencies under the assumption of a standard coalescence model. Genotypes are simulated assuming Hardy-Weinberg equilibrium and the reads are generated by copying each allele a Poisson distributed number of times with mean equal to half the per-individual depth. False SNPs are simulated by assuming a MAF of zero. Since every site has high sequencing depth and the next-generation sequencing error is relatively high, approx. 1%, almost all the invariable sites appear as false SNPs in the read alignment. The causative SNP is simulated similarly, but with different MAFs for cases and controls computed using a multiplicative disease model.
When necessary, we also simulate data with variation in pooling efficacy and exon-capturing efficacy. When both effects are introduced, we use the following model:
where Yi,j,A is the count of the A nucleotides from individual i at locus j. Dp is the depth of each pool, and Ri is the proportion of DNA from individual i. Since, αp and αc control the pooling variance and capturing variance, respectively, the pooling variance equals 1/αp and capturing variance equals 1/αc.
Results
Experimental data
We examined seven DNA samples, consisting of data from five Danish individuals, sequenced individually, and in two pools: a pool with two individuals and another pool with five individuals. The individual sequencing data was used to detect unique mutations, which allow us to identify individuals of the corresponding reads. Exon-capturing was performed for each of the seven DNA samples, using a NimbleGen chip, and was subsequently sequenced using Solexa-sequencing (for details, see Methods). We evaluated (a) the performance of DNA pooling, (b) exon-capturing efficacy, and (c) sequencing error rate.
Both pools show good pooling efficacy, i.e. an approximately equal amount of DNA from each individual in the pool (Figure 2). We first identified mutations that are specific to each individual. Using such mutations, we then estimated the relative amount of DNA from each individual by averaging the number of reads from the unique mutations across the sequenced region.
Figure 2.

Pooling variance observed in the empirial study in the pool of five individuals. Using individual sequencing data, unique mutations for each of the five individuals were obtained, and the number of reads with each mutation was counted in the pooled sample. The box plots shows the lower quartile, median (black line), and upper quartile of the number of reads with each mutations (y-axis) for each individual (x-axis). The variation among individuals is relatively small compared to the variation within individuals.
In the pool with five individuals, 28,026 reads can be uniquely assigned to an individual based on 3,217 diagnostic mutations. The estimated proportion of DNA from each individuals was 0.186 0.210 0.191 0.211 and 0.202, respectively, showing that the proportions differ only slightly. Assuming the model in Equation 1, the estimated pooling variance (1/αp) is 1/300, which is very small. The pool with two individuals shows even better performance (data not shown).
The exon-capturing efficacy varies significantly across the genome compared to the Poisson distribution expected under a constant capturing efficacy across the genome (Supplementary Figure 2). The estimated exon-capturing variance is approx. 1/2 (i.e., αc is 2) (see Equation 3). Nonetheless, exon-capturing efficacy across samples were homogeneous (Supplementary Figure 3).
On average, a sequencing error rate of 0.9% was estimated in the Illumina/Solexa raw reads (Table 2) using the method described in Methods.
Table 2.
Summary of the empirical data consisting of sequences from seven samples in 5 MB of exonic regions. The seven samples consist of five individual samples (Indiv 1 – Indiv 5) and two pooled samples, one with a pool size of two (Pool 1) and the other with a pool size of five (Pool 2). Sequencing error rates are conservatively estimated as the average mismatch rate. ‘Generated reads’ is the number of the reads after filtering out contaminated reads. ‘The percentage of reads mapped to exons’ is the fraction of the reads mapped to exons among the generated reads. ‘Average coverage for the targeted region’ is the average number of reads per base-pair across targeted exon regions.
| Indiv 1 | Indiv 2 | Indiv 3 | Indiv 4 | Indiv 5 | Pool 1 1+2 |
Pool 2 1+2+3+4+5 |
|
|---|---|---|---|---|---|---|---|
| Sequencing error rate(%) | 0.93 | 0.89 | 0.89 | 0.86 | 0.96 | 1.05 | 0.86 |
| Generated reads (Mb) | 92.9 | 86.9 | 111.5 | 112.1 | 104.2 | 110.0 | 122.9 |
| % of reads mapped to exons | 47.4 | 44.6 | 47.6 | 47.0 | 52.6 | 49.8 | 49.6 |
| Average coverage for the targeted region | 18.01 | 16.86 | 21.6 | 21.73 | 20.22 | 21.27 | 21.24 |
Distribution of the LRT
We examined the distribution of the likelihood ratio statistic using simulations. As suggested by standard asymptotic theory, the distribution of the test statistic closely follows a chi-square distribution with one degree of freedom, except in cases in which the parameters are close to the boundary (Supplementary Figure 4). Across a range of MAFs covering 0.05%–0.5%, the distribution of p-values computed based on the chi-square distribution is nearly uniform. However, when the MAF is very small relative to the assumed sequencing error rate, a sharp peak near 1.0 appears in the distribution of p-values, implying an excess of test statistics with nearly zero values. This is due to difficulty in distinguishing true SNPs with very low minor alleles from false ones, and thus MAFs under both the null and the alternative hypothesis are estimated to be zero.
We also varied the number of individuals in a pool (pool size) as well as the sequencing depth per individual. Again, the distribution of the LRT statistic closely follows the chi-square distribution across a range of pool sizes and sequencing depths, except for the boundary cases (Supplementary Figures 5 and 6). When the MAF is very small, the distribution is affected by the pool size and the sequence depth. With increased pool size but constant total read depth, the peak in the distribution becomes more pronounced (Supplementary Figure 5), because it becomes more difficult to distinguish false SNPs from true SNPs. As sequencing depth increases, the peaks tends to be less pronounced, since high depth helps especially when only a few minor alleles exist (Supplementary Figure 6).
In summary, the LRT statistic has good statistical properties, can be used for testing for association, and will form the basis for our analyses of designs.
Power of LRT statistic
To examine the power of different experimental designs, we compared the power (computed based on our LRT statistic) varying several parameters: the number of individuals in cases n1, pool size Ps, individual depth Di and sequencing error rate ε, pooling variance 1/αp and the capturing variance 1/αc (for detailed definition, see Methods). Note that for computational reasons, we computed the power by selecting 50 SNPs with the strongest association out of 300,000 sites. This corresponds to selecting 5,000 candidate SNPs out of the human exome (approx. ~ 30 Mb) for further genotyping.
For simplicity, we will denote a disease variant with minor allele frequency (MAF) of m and relative risk (RR) of r as Dm,r.
Effect of sample size
As expected, increasing sample size increases power significantly, across a range of MAFs and relative risks (Figure 3A). For example, sequencing 500 cases at 4X with a pool size of five individuals, the power to detect a D1%, 2 is 29.8%. However, increasing the sample size by two-fold (1000 cases) and four-fold (2000 cases), the power becomes 53.8% and 84.3%, respectively. Also, the power to detect a D5%, 1.5 is 43.2%, 72.8%, and 95.7%, using 500, 1000, and 2000 cases.
Figure 3.

Power comparison across a range of sample sizes (number of cases, n1), pool sizes Ps, individual sequencing depths Di, sequencing error rates ε, pooling variances Vp, and capturing variances Vc. Note that the power is defined as the probability of including the causative SNP among the set of the 50 SNPs with strongest signal of association among 300,000 sites. Each plot shows the power (y-axis) to detect a causative SNP with a specified minor allele frequency (black: 0.5%, red: 1%, and blue: 5%) and a specified relative risk (x-axis), across a range of a parameter settings of interest (line types). The default experimental setting is to sequence 1000 cases and 1000 controls at 4X using a pool size of five, and the default condition assumes a sequencing error rate of 1%, ideal pooling performance, and constant capturing efficacy. Notice that the solid line in the plots A–D corresponds to the default setting and condition.
Effect of pool size
By pooling DNA samples, the cost of exon capturing can be reduced. However, reads from pools cannot in general be assigned to individuals without additional labeling, potentially leading to a reduction in statistical power and accuracy. To explore this issue, we performed simulations for different pool sizes, but with a fixed number of individuals and a fixed sequencing depth. We find that the power decreases as pool size increases (Figure 3B), suggesting that our LRT statistic successfully captures the increased information associated with a smaller pool size. Nonetheless, the loss in power is relatively small. For example, the power to detect a D1%, 2 is 64.8%, with sequencing 1000 cases individually at 4X. By pooling five individuals or even 100 individuals, the power is only reduced to 53.8% and 45.5%, respectively. These results assume that pools with an equal amount of DNA from each individual can be constructed. However, even when using a pooling variance that is 100-fold of the estimated variance from the experimental data, the results remain almost the same (Supplementary Figure 7)
Effect of sequencing depth
The sequencing depth is the average number of reads covering a site. As expected, the power increases with increasing depth (Figure 3C). For example, the power to detect a D1%, 2 is 33.0%, using sequencing of 1000 cases at 2X with a pool size of five. However, with a depth of 4X, the power is 53.8%, and with depth of 8X, the power is 72.9%. The increased power at higher sequencing depth is caused by an increased ability to distinguish between true SNPs and sequencing errors. The advantage of a higher sequencing depth will, therefore, also depend on the error rate.
Effect of sequencing error rate
The sequencing error rate is one of the major concerns in association studies targeting rare mutations based on re-sequencing. Nonetheless, we find that the sequencing error rate has a relatively small effect on the power, when the error rate is similar or lower than the MAF of the disease SNP (Figure 3D). For example, even if the error rate decreases by half, from 1% to 0.5%, the power to detect a disease variant with MAF of 1% or more increases only slightly, at most 5%. This also suggests that our LRT statistic properly takes the sequencing error rate into account. With an error rate of 2%, there is a more pronounced decrease of power, especially for a MAF of 1% or less (Figure 3D). However, in most studies, the error rate will probably be at 1% or below.
Effect of pooling performance
Our simulation results suggest that the effect of the pooling variance is of minor concern, for the pool sizes considered here. The pooling variance estimated from our empirical study corresponds to Vp = 1/300, and the power with this pooling variance is nearly the same as with a variance equal to zero (Figure 3E). Even if the variance increases by 100-fold, the power decreases only slightly (Figure 3E). For example, the power to detact a D1%, 2 is 53.8% without pooling variance, and it is 51.8% with a pooling variance of 1/3.
Effect of exon-capturing efficacy
Exon-capturing efficacy may vary across sites. In our empirical study, the total depth varied significantly across the sites, and the estimated exon-capturing variance was 1/2. This leads to a markedly reduced power compared to the case of almost no variation in exon-capturing efficacy (Vc = 1/100) (Figure 3F). For example, the power to detect a D1%, 2 is 53.9% without exon-capturing variance, while, the power is 24% with Vc = 1/2. The major reason is that with a high exon capturing variance, there in an increased probability of low sequencing depth in the site containing the causal SNP.
Power of the LRT with estimated error rate
Our LRT statistic is computed assuming a known sequencing error rate. In practice, the sequencing error rate will be estimated from the data, possibly by averaging across sites in a region assumed to have a constant error rate. Mis-specification of the error rate may reduce the performance of our LRT statistic. Supplementary Figure 8 shows that mis-specification of the error rate as 0.5% when the true error rate is 1% decreases the power significantly. However, the loss of power due to mis-specification of the error rate is less of our concern, since the error rate can be estimated at each site under the null hypothesis. With thousands of reads, an error rate close to 1% can be reasonably accurately estimated as long as the pool size is not too large (i.e., > 100), and thus the likelihood ratio test achieves a power very close to the case when the true error rate is known. Additionally, most sequencing platforms provide quality scores that can be interpreted as error rates. Even when these quality scores are not quite accurate, they can be re-calibrated to accurately reflect the error rate. Mis-specification of the error rate is, therefore, not likely to affect carefully constructed real studies.
Optimal design with a fixed cost
In this section, we explore options for maximizing the power for a fixed experimental cost. (Examples of cost are shown in Table 1.) For a given cost, the factors we can control are the number of cases n1, pool size Ps, and the individual sequencing depth Di. Note, however, that the power is also affected by the sequencing error rate, pooling performance, and exon-capturing effects.
Un-pooled samples
Even if pooling DNA samples may reduce cost significantly, sequencing un-pooled samples is of great interest as well, since eventually, sequencing whole genome might be feasible at a low cost. An important question then arises as how to balance the trade-off between the number of individuals and the individual sequencing depth, with a fixed sequencing cost. To illuminate this issue, we examined three designs with 500 cases, 1000 cases, and 2000 cases, and a fixed total depth among cases of 4000X or 8000X. Under our simulation conditions, power increases as the number of individuals increases (Figure 4A). For example, when the error rate is 1%, for a disease variant with MAF of 1% and a relative risk of 2, the power using 16X sequencing of 500 individuals is 52.1%, while the power using 4X sequencing of 2000 individuals is 91.1%. When the total depth is reduced by half, so that the individual depth for 2000 cases is 2X, the pattern is still the same (Figure 4B). These observations suggest that with a reasonable sequencing error rate, such as 1%, individual sequencing of many individuals at a shallower depth achieves better power than sequencing less individuals at a higher depth. This finding might be surprising given that it is difficult to call rare SNPs in the presence of high error rates. Real error rates might be lower than the 1% assumed here, which would further strengthen our conclusions. If DNA from many individuals is readily available, there seems to be very little reason to sequence few individuals at a depth >2X. Rather, statistical power is maximized by sequencing more individuals at a lower depth (e.g. 2X).
Figure 4.

Power comparison among different sequencing strategies with a fixed sequencing cost. Power is defined as in Figure 3. The different strategies are specified in the bottom right corner of each plot. n1 and Di specifies the number of cases and sequencing depth per individual, respectively. Notice that the total sequencing depth is the same across the three settings compared. The power to detect a causative SNP with a minor allele frequency (red: 1%, blue: 5%) and a specified relative risk (x-axis) are compared for different settings (line types).
Pooled samples
We investigated optimal strategies for pooled samples with a fixed cost. To fix the cost, we fix the total number of pools as well as the total depth, thus fixing exon-capturing cost as well as sequencing cost. We use four different parameter settings, in which, the setting with the lowest sample size corresponds to sequencing 500 cases individually at 8X. The setting with the biggest sample size corresponds to sequencing 4000 cases at 1X with a pool size of 8 individuals. The four settings are shown in the x-axis of Figure 5A, in the order of sample size. For each parameter setting, we compared the power to detect a disease SNP with MAF of 1% and RR of 2, under various experimental scenarios, considering the error rate, pooling performance as well as exon-capturing efficacy. With an error rate of 1%, the power increases with sample size, even in the presence of a more shallow sequencing depth and a larger pool size (Figure 5A). This may be surprising since, when individuals are pooled, it becomes even harder to distinguish true SNPs from errors. With a lower error rate of 0.5%, the gain in power with increased sample size is more pronounced. For example, when the error rate decreases from 1% to 0.5%, the power of sequencing 500 cases individually at 8X remains almost the same. While, the power of sequencing 4000 cases at 1X with a pool size of 8 increases from 66% to 78%. This suggests that when the individual depth is sufficiently enough, not much is gained by having a low error rate, but when depth is shallow and pool size is relatively large, then the low error rate helps considerably in distinguishing rare SNPs from errors. For similar reasons, a very high error rate such as 2% tends to make designs with a shallow sequencing depth and large pool size less favorable. Indeed, with an error rate of 2%, we observe that the power when sequencing 2000 individuals at 2X with a pool size of 4, is lower than when sequencing 1000 individuals at 4X with a pool size of two. However, such high error rates are unlikely to occur in practice. Assuming the the pooling variance and exon-capturing variance estimated in the empirical study, the power for all the settings decrease but the overall pattern remains the same. Presumably, the decrease in the power is mostly due to variation in exon-capturing efficacy. We also note that the overall pattern discussed above holds true for a range of MAFs and RR, especially for the most relevant ones, such as a MAF higher than 1% and RR larger than 1.3.
Figure 5.
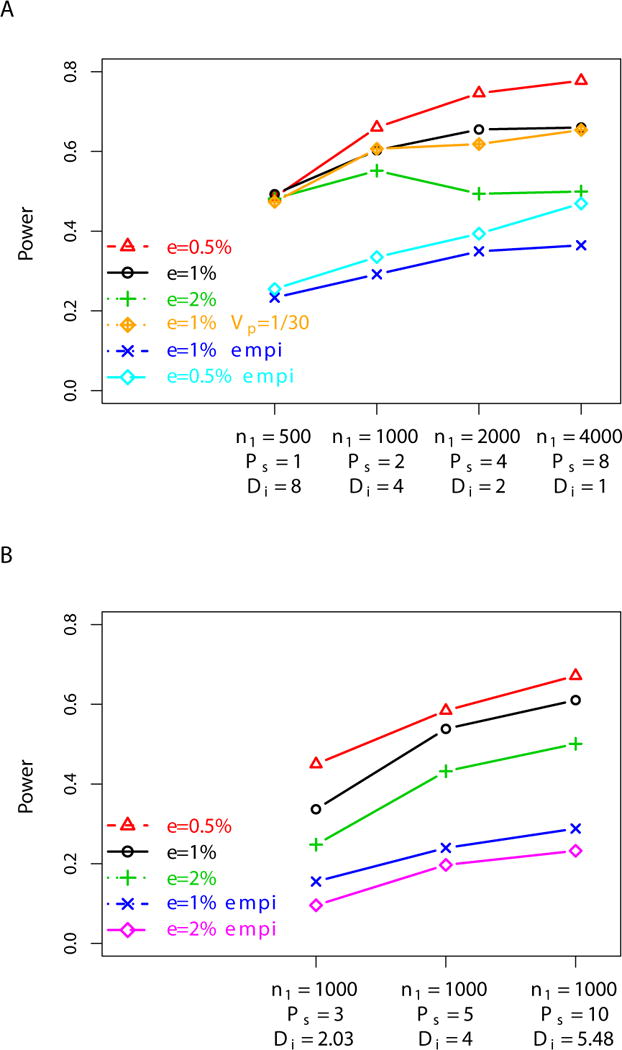
Optimal strategies with pooled samples. The power to detect a causative SNP with MAF of 1% and relative risk of 2, is compared for different experimental settings with a fixed cost. Power is defined as in Figure 3. In the upper panel, the total number of pools and the total depth are fixed across the four settings, but the sample size is varied (x-axis). In the lower panel, the sample size is fixed across the three settings, but the depth varies (x-axis). Each color corresponds to different sequencing error rates, pooling variance, and exon-capuring variance. In the legend, ε specifies an error rate (red: 0.5%, black: 1%, and green: 2%), and empi denotes the condition using the pooling variance and exon-capturing variance estimated from the empirical study (see Results).
As the number of individuals available for sequencing or genotyping often is fixed, it is also of relevance to consider designs in which both the cost and the number of individuals is fixed, but the sequencing depth and pool size can vary. We create three experimental settings based on sequencing 1000 individuals. Figure 5B shows that with a fixed number of individuals, it is better to sequence at a higher depth with a larger pool size than to sequence in a more shallower depth with a smaller pool size. For example, with a sequencing error rate of 1%, a pool size of 3 and a sequencing depth of 2X, the power is 45%. However, with a pool size of 10 and a sequencing depth of 5.48X the power is 67.2%. A similar pattern is observed across a range of sequencing error rates from 0.5% to 2%. This conclusions also holds when taking pooling variance and exon-capturing variance into account (Figure 5B).
Overall, our finding suggests that sequencing pooled DNA samples in the region of interest works as an efficient protocol in association studies, especially when there is a significant cost involved in capturing the targeted regions. In particular, when the cost of obtaining DNA from individuals is low, sequencing many individuals at a more shallow depth with larger pool size achieves higher power than sequencing a small number of individuals in higher depth with smaller pool size. When a fixed number of individuals are available for the study, it is better to pool more individuals to save cost in capturing rather to spend more money on sequencing each pool deeper.
Discussion
We have here presented a simple likelihood ratio test for association mapping based on next-generation sequencing data in pooled or un-pooled samples. The method can be improved in a number of ways, to take into account quality scores and known error rates. The real pattern of sequencing errors is much more complicated than assumed in our simulaitons (e.g., [Li et al., 2009]). Most of these potential extensions are relatively trivial and should not affect the conclusions from the simulation studies presented here. However, it might be worthwhile in future studies to explore other methods than independent likelihood ratio tests for detecting associated SNPs. It might be natural to implement empirical Bayes approaches which first estimates the number of SNPs with an association and then provides a posterior for each SNP. Such methods could also attempt to take advantage of LD and haplotype patterns in the data. In many real studies, it might also be relevant to use imputation to leverage available SNP data from other studies [Marchini et al., 2007; Scott et al., 2007; Servin and Stephens, 2007]. However, we have not pursued such approaches here as the primary aim of this paper is to use very fast computational methods to explore issues regarding design of association mapping studies based next-generation sequencing data.
We used a small empirical study to estimate parameters relating to exon-capturing variance and pooling variance in order to have reasonable parameters for use in the simulations. In general, none of the conclusions in the manuscript seems particularly sensitive to assumptions regarding exon capturing and pooling variance. However, we should note that our conclusions may not necessarily generalize to pools much larger than 5 individuals. Our assumption has been that pooling variance does not depend on sample size. If it is considerably more difficult to make pools of, say, 50 individuals than 5 individuals, this assumption may not hold. We do not have sufficient data to determine the potential accuracy of pooling in large samples.
We used the likelihood ratio test and the empirically estimated parameters to simulate association mapping studies under realistic conditions. In these simulations we ignored LD to increase the computational speed. While this is not a realistic assumption, it should not affect our general results, as LD is not expected to have a different effect on pooled and un-poled samples, or in samples with deep versus shallow sequencing, and since our tests statistic is based on marginal analyses of each SNP.
Our major conclusions from the simulation studies is that relatively shallow sequencing and relatively large pools are almost always preferred. We have assumed quite high error rates in this study, in part because higher error rates makes identification of rare mutations harder, and this effect is exasperated under shallow sequencing and in pools where reads from each individual cannot be identified. Assuming high error rates, therefore, biases our conclusions in the opposite direction of the observed results, towards deep sequencing and small pools. It might be surprising that even when rare mutations are difficult to identify, shallow sequencing is still preferred. The main reason is that the power to detect an association depends on the ability to estimate allele frequencies among cases and controls. With a fixed amount of sequencing data being produced, the variance in the estimate of the allele frequency is always lower with more individuals than with few individuals. This effect is balanced by a potentially reduced ability to determine which sites contain true SNPs and which sites do not contain true SNPs. However, as illustrated by the simulations, any possible reduction in our ability to call SNPs does not offset the gains in power achieved by the more accurate estimation of allele frequencies.
As sequencing cost continues to decrease, and as focus is changing towards rare alleles, next-generation sequencing is becoming a viable alternative for association mapping. We emphasize that at the moment, economically optimal designs are probably not based entirely on next-generation sequencing. A two-stage approach involving sequencing in the first stage and genotyping in the second stage is almost always a more efficient design, especially since imputation can be used in the second stage to increase power [Marchini et al., 2007; Scott et al., 2007; Servin and Stephens, 2007]. In fact, power in our studies was measured in terms of the probability of selecting a causative SNP in the first stage of a two-stage design. However, it is possible that in the near future, sequencing becomes so cheap that designs based entirely on sequencing should be considered. Our conclusions favoring shallow sequencing in many individuals and pooled samples as a cost-reducing measure, should be relevant in both candidate gene studies using sequencing and in GWAs based on either a mixed two-stage design or based entirely on next-generation sequencing.
Supplementary Material
Supplementary Figure 1: Illustration of the pooling procedure used in the empirical study, based on the original method by Lavebratt and Sengul [Lavebratt and Sengul, 2006].
Supplementary Figure 10: Effect of filtering low-MAF sites on the power for different settings with a fixed cost. The four panels correspond to no filtering (top left), filtering at 0.5% (top right), filtering at 1% (bottom left), and filtering at 2% (bottom right), respectively. For details about filtering, see the caption of Supplementary Figure 9. For details about the experimental settings, see the caption of Figure 5A.
Supplementary Figure 2: Variation in total depth across 17,550 polymorphic sites that were found, using five individuals sequenced in our empirical study (see Results). The polymorphic sites were identified using the program SOAPsnp [Li et al., 2009]. The histogram of total depth is superimposed on the density function of the Poisson distribution with mean equal to the average of the total depth (blue vertical line).
Supplementary Figure 3: Strong correlation in total read depth across the sites between two individually sequenced samples. The sites in the sequenced regions were binned based on the total depth of sample 3, then, within each bin, the total depth of sample 4 was used to draw a box-plot.
Supplementary Figure 4: Distribution of p-values of our LRT statistic for SNPs with different MAFs. The p-values were computed based on an asymptotic approximation (i.e., by assuming that our LRT statistic follows a chi-squre distribution with degrees of freedom of 1). The dotted green line indicates the expected counts when the p-values are uniformly distributed. Sites are simulated, assuming sequencing 1000 cases and 1000 controls at 8X using a pool size of five.
Supplementary Figure 5: Distribution of p-values for SNPs with different MAFs and pool sizes. Sites are simulated assuming sequencing of 1000 cases and 1000 controls at 8X using various pool sizes. For more details, see caption of Supplementary Figure 4.
Supplementary Figure 6: Distribution of p-values for SNPs with different MAFs and individual depths. Sites are simulated assuming sequencing of 1000 cases and 1000 controls at various depth, using a pool size of five. For more details, see caption of Supplementary Figure 4.
Supplementary Figure 7: Effect of pool size Ps on the power when the pooling variance Vp is 1/3. Note that the estimated pooling variance from our empirical study is 1/300 (see Results). For more details of caption, see Figure 3B.
Supplementary Figure 8: Effect of mis-specification of error rate on the power. To compute the power, the LRT statistic is computed using the true error rate (true), using the estimated error rate at each site (estimated), and two mis-specified error rates (given). A range of minor allele frequencies (black: 0.5%, red: 1%, and blue: 5%) and relative risks (x-axis) for the disease variant are examined. Sites are simulated assuming sequencing of 1000 cases and 1000 controls at 4X using a pool size of five.
Supplementary Figure 9: Effect of filtering low-MAF sites on the power. Here, the power is defined as the chance of including the causative SNP with a MAF of black: 0.5%, red: 1%, and blue: 5% and a specified relative risk (x-axis), among the 50 SNPs with strongest signal of association among 300,000 sites. Sites with estimated MAF less than ‘f’ were eliminated from the sample. The simulations assume sequencing of 1000 cases and 1000 controls at 4X using a pool size of five.
Acknowledgments
This study was supported by the research consortium entitled The Lundbeck Foundation Centre of Applied Medical Genomics in Personalized Disease Prediction, Prevention and Care (LuCAMP), and by NIH grants R01-HG003229 and R01-MH084691.
References
- Albert TJ, Molla MN, Muzny DM, Nazareth L, Wheeler D, Song X, Richmond TA, Middle CM, Rodesch MJ, Packard CJ, Weinstock GM, Gibbs RA. Direct selection of human genomic loci by microarray hybridization. Nat Methods. 2007;4:903–905. doi: 10.1038/nmeth1111. [DOI] [PubMed] [Google Scholar]
- Altshuler D, Daly MJ, Lander ES. Genetic mapping in human disease. Science. 2008;322:881–888. doi: 10.1126/science.1156409. [DOI] [PMC free article] [PubMed] [Google Scholar]
- Azzopardi D, Dallosso AR, Eliason K, Hendrickson BC, Jones N, Rawstorne E, Colley J, Moskvina V, Frye C, Sampson JR, Wenstrup R, Scholl T, Cheadle JP. Multiple rare nonsynonymous variants in the adenomatous polyposis coli gene predispose to colorectal adenomas. Cancer Res. 2008;68:358–363. doi: 10.1158/0008-5472.CAN-07-5733. [DOI] [PubMed] [Google Scholar]
- Bansal A, van den Boom D, Kammerer S, Honisch C, Adam G, Cantor CR, Kleyn P, Braun A. Association testing by DNA pooling: an effective initial screen. Proc Natl Acad Sci USA. 2002;99:16871–16874. doi: 10.1073/pnas.262671399. [DOI] [PMC free article] [PubMed] [Google Scholar]
- Barrett JC, Hansoul S, Nicolae DL, Cho JH, Duerr RH, Rioux JD, Brant SR, Silverberg MS, Taylor KD, Barmada MM, Bitton A, Dassopoulos T, Datta LW, Green T, Griffiths AM, Kistner EO, Murtha MT, Regueiro MD, Rotter JI, Schumm LP, Steinhart AH, Targan SR, Xavier RJ, Libioulle C, Sandor C, Lathrop M, Belaiche J, Dewit O, Gut I, Heath S, Laukens D, Mni M, Rutgeerts P, Van Gossum A, Zelenika D, Franchimont D, Hugot JP, de Vos M, Vermeire S, Louis E, Cardon LR, Anderson CA, Drummond H, Nimmo E, Ahmad T, Prescott NJ, Onnie CM, Fisher SA, Marchini J, Ghori J, Bumpstead S, Gwilliam R, Tremelling M, Deloukas P, Mansfield J, Jewell D, Satsangi J, Mathew CG, Parkes M, Georges M, Daly MJ. Genome-wide association defines more than 30 distinct susceptibility loci for Crohn’s disease. Nat Genet. 2008;40:955–962. doi: 10.1038/NG.175. [DOI] [PMC free article] [PubMed] [Google Scholar]
- Bentley DR, Balasubramanian S, Swerdlow HP, Smith GP, Milton J, Brown CG, Hall KP, Evers DJ, Barnes CL, Bignell HR, Boutell JM, Bryant J, Carter RJ, Keira Cheetham R, Cox AJ, Ellis DJ, Flatbush MR, Gormley NA, Humphray SJ, Irving LJ, Karbelashvili MS, Kirk SM, Li H, Liu X, Maisinger KS, Murray LJ, Obradovic B, Ost T, Parkinson ML, Pratt MR, Rasolonjatovo IM, Reed MT, Rigatti R, Rodighiero C, Ross MT, Sabot A, Sankar SV, Scally A, Schroth GP, Smith ME, Smith VP, Spiridou A, Torrance PE, Tzonev SS, Vermaas EH, Walter K, Wu X, Zhang L, Alam MD, Anastasi C, Aniebo IC, Bailey DM, Bancarz IR, Banerjee S, Barbour SG, Baybayan PA, Rusman E, Sanches-Kuiper RM, Schenker MR, Seoane JM, Shaw RJ, Shiver MK, Short SW, Sizto NL, Sluis JP, Smith MA, Ernest Sohna Sohna J, Spence EJ, Stevens K, Sutton N, Szajkowski L, Tregidgo CL, Turcatti G, Vandevondele S, Verhovsky Y, Virk SM, Wakelin S, Walcott GC, Wang J, Worsley GJ, Yan J, Yau L, Zuerlein M, Rogers J, Mullikin JC, Hurles ME, McCooke NJ, West JS, Oaks FL, Lundberg PL, Klenerman D, Durbin R, Smith AJ. Accurate whole human genome sequencing using reversible terminator chemistry. Nature. 2008;456:53–59. doi: 10.1038/nature07517. [DOI] [PMC free article] [PubMed] [Google Scholar]
- Bodmer W, Bonilla C. Common and rare variants in multifactorial susceptibility to common diseases. Nat Genet. 2008;40:695–701. doi: 10.1038/ng.f.136. [DOI] [PMC free article] [PubMed] [Google Scholar]
- Boss Y, Bacot F, Montpetit A, Rung J, Qu HQ, Engert JC, Polychronakos C, Hudson TJ, Froguel P, Sladek R, Desrosiers M. Identification of susceptibility genes for complex diseases using pooling-based genome-wide association scans. Hum Genet. 2009;125:305–318. doi: 10.1007/s00439-009-0626-9. [DOI] [PubMed] [Google Scholar]
- Broyden CG. The convergence of a class of double-rank minimization algorithms. J Inst Maths Applics. 1970;6:222–231. [Google Scholar]
- Chi A, Schymick JC, Restagno G, Scholz SW, Lombardo F, Lai SL, Mora G, Fung HC, Britton A, Arepalli S, Gibbs JR, Nalls M, Berger S, Kwee LC, Oddone EZ, Ding J, Crews C, Rafferty I, Washecka N, Hernandez D, Ferrucci L, Bandinelli S, Guralnik J, Macciardi F, Torri F, Lupoli S, Chanock SJ, Thomas G, Hunter DJ, Gieger C, Wichmann HE, Calvo A, Mutani R, Battistini S, Giannini F, Caponnetto C, Mancardi GL, La Bella V, Valentino F, Monsurr MR, Tedeschi G, Marinou K, Sabatelli M, Conte A, Mandrioli J, Sola P, Salvi F, Bartolomei I, Siciliano G, Carlesi C, Orrell RW, Talbot K, Simmons Z, Connor J, Pioro EP, Dunkley T, Stephan DA, Kasperaviciute D, Fisher EM, Jabonka S, Sendtner M, Beck M, Bruijn L, Rothstein J, Schmidt S, Singleton A, Hardy J, Traynor BJ. A two-stage genome-wide association study of sporadic amyotrophic lateral sclerosis. Hum Mol Genet. 2009;18:1524–1532. doi: 10.1093/hmg/ddp059. [DOI] [PMC free article] [PubMed] [Google Scholar]
- Cohen JC, Kiss RS, Pertsemlidis A, Marcel YL, McPherson R, Hobbs HH. Multiple rare alleles contribute to low plasma levels of HDL cholesterol. Science. 2004;305:869–872. doi: 10.1126/science.1099870. [DOI] [PubMed] [Google Scholar]
- Cohen JC, Pertsemlidis A, Fahmi S, Esmail S, Vega GL, Grundy SM, Hobbs HH. Multiple rare variants in NPC1L1 associated with reduced sterol absorption and plasma low-density lipoprotein levels. Proc Natl Acad Sci USA. 2006;103:1810–1815. doi: 10.1073/pnas.0508483103. [DOI] [PMC free article] [PubMed] [Google Scholar]
- Consortium T.W.T.C.C. Genome-wide association study of 14,000 cases of seven common diseases and 3,000 shared controls. Nature. 2007;447:661–678. doi: 10.1038/nature05911. [DOI] [PMC free article] [PubMed] [Google Scholar]
- Druley TE, Vallania FL, Wegner DJ, Varley KE, Knowles OL, Bonds JA, Robison SW, Doniger SW, Hamvas A, Cole FS, Fay JC, Mitra RD. Quantification of rare allelic variants from pooled genomic DNA. Nat Methods. 2009 doi: 10.1038/nmeth.1307. [DOI] [PMC free article] [PubMed] [Google Scholar]
- Fletcher R. A new approach to variable metric algorithms. Computer Journal. 1970;13:317–322. [Google Scholar]
- Frazer KA, Ballinger DG, Cox DR, Hinds DA, Stuve LL, Gibbs RA, Belmont JW, Boudreau A, Hardenbol P, Leal SM, Pasternak S, Wheeler DA, Willis TD, Yu F, Yang H, Zeng C, Gao Y, Hu H, Hu W, Li C, Lin W, Liu S, Pan H, Tang X, Wang J, Wang W, Yu J, Zhang B, Zhang Q, Zhao H, Zhao H, Zhou J, Gabriel SB, Barry R, Blumenstiel B, Camargo A, Defelice M, Faggart M, Goyette M, Gupta S, Moore J, Nguyen H, Onofrio RC, Parkin M, Roy J, Stahl E, Winchester E, Ziaugra L, Altshuler D, Shen Y, Yao Z, Niikawa N, Adewole IF, Knoppers BM, Foster MW, Clayton EW, Watkin J, Gibbs RA, Belmont JW, Muzny D, Nazareth L, Sodergren E, Weinstock GM, Wheeler DA, Yakub I, Gabriel SB, Onofrio RC, Richter DJ, Ziaugra L, Birren BW, Daly MJ, Altshuler D, Wilson RK, Fulton LL, Rogers J, Burton J, Carter NP, Clee CM, Griffiths M, Jones MC, McLay K, Plumb RW, Ross MT, Sims SK, Willey DL, Chen Z, Han H, Kang L, Godbout M, Wallenburg JC, L’Archevque P, Bellemare G, Saeki K, Wang H, An D, Fu H, Li Q, Wang Z, Wang R, Holden AL, Brooks LD, McEwen JE, Guyer MS, Wang VO, Peterson JL, Shi M, Spiegel J, Sung LM, Zacharia LF, Collins FS, Kennedy K, Jamieson R, Stewart J. A second generation human haplotype map of over 3.1 million SNPs. Nature. 2007;449:851–861. doi: 10.1038/nature06258. [DOI] [PMC free article] [PubMed] [Google Scholar]
- Frazer KA, Murray SS, Schork NJ, Topol EJ. Human genetic variation and its contribution to complex traits. Nat Rev Genet. 2009;10:241–251. doi: 10.1038/nrg2554. [DOI] [PubMed] [Google Scholar]
- Gnirke A, Melnikov A, Maguire J, Rogov P, LeProust EM, Brockman W, Fennell T, Giannoukos G, Fisher S, Russ C, Gabriel S, Jaffe DB, Lander ES, Nusbaum C. Solution hybrid selection with ultra-long oligonucleotides for massively parallel targeted sequencing. Nat Biotechnol. 2009;27:182–189. doi: 10.1038/nbt.1523. [DOI] [PMC free article] [PubMed] [Google Scholar]
- Goldfarb D. A Family of variable-metric methods derived by variational means. Math Comp. 1970;24:23–26. [Google Scholar]
- Gorlov IP, Gorlova OY, Sunyaev SR, Spitz MR, Amos CI. Shifting paradigm of association studies: value of rare single-nucleotide polymorphisms. Am J Hum Genet. 2008;82:100–112. doi: 10.1016/j.ajhg.2007.09.006. [DOI] [PMC free article] [PubMed] [Google Scholar]
- Hillier LW, Marth GT, Quinlan AR, Dooling D, Fewell G, Barnett D, Fox P, Glasscock JI, Hickenbotham M, Huang W, Magrini VJ, Richt RJ, Sander SN, Stewart DA, Stromberg M, Tsung EF, Wylie T, Schedl T, Wilson RK, Mardisom ER. Whole-genome sequencing and variant discovery in C. elegans. Nat Methods. 2008;5:183–188. doi: 10.1038/nmeth.1179. [DOI] [PubMed] [Google Scholar]
- Hindorff LA, Junkins HA, Mehta JP, Manolio TA. A Catalog of Published Genome-Wide Association Studies. National Human Genome Research Institute. (accessed 1 Apr 2009) [online], www.genome.gov/26525384.
- Hodges E, Xuan Z, Balija V, Kramer M, Molla MN, Smith SW, Middle CM, Rodesch MJ, Albert TJ, Hannon GJ, McCombie WR. Genome-wide in situ exon capture for selective resequencing. Nat Genet. 2007;39:1522–1527. doi: 10.1038/ng.2007.42. [DOI] [PubMed] [Google Scholar]
- Ingman M, Gyllensten U. SNP frequency estimation using massively parallel sequencing of pooled DNA. Eur J Hum Genet. 2008 doi: 10.1038/ejhg.2008.182. [DOI] [PMC free article] [PubMed] [Google Scholar]
- Iyengar SK, Elston RC. The genetic basis of complex traits: rare variants or “common gene, common disease”? Methods Mol Biol. 2007;376:71–84. doi: 10.1007/978-1-59745-389-9_6. [DOI] [PubMed] [Google Scholar]
- Ji W, Foo JN, O’Roak BJ, Zhao H, Larson MG, Simon DB, Newton-Cheh C, State MW, Levy D, Lifton RP. Rare independent mutations in renal salt handling genes contribute to blood pressure variation. Nat Genet. 2008;40:592–599. doi: 10.1038/ng.118. [DOI] [PMC free article] [PubMed] [Google Scholar]
- Jones S, Hruban RH, Kamiyama M, Borges M, Zhang X, Parsons DW, Lin JC, Palmisano E, Brune K, Jaffee EM, Iacobuzio-Donahue CA, Maitra A, Parmigiani G, Kern SE, Velculescu VE, Kinzler KW, Vogelstein B, Eshleman JR, Goggins M, Klein AP. Exomic sequencing identifies PALB2 as a pancreatic cancer susceptibility gene. Science. 2009;324:217. doi: 10.1126/science.1171202. [DOI] [PMC free article] [PubMed] [Google Scholar]
- Krishnakumar S, Zheng J, Wilhelmy J, Faham M, Mindrinos M, Davis R. A comprehensive assay for targeted multiplex amplification of human DNA sequences. Proc Natl Acad Sci USA. 2008;105:9296–9301. doi: 10.1073/pnas.0803240105. [DOI] [PMC free article] [PubMed] [Google Scholar]
- Kruglyak L. The road to genome-wide association studies. Nat Rev Genet. 2008;9:314–318. doi: 10.1038/nrg2316. [DOI] [PubMed] [Google Scholar]
- Kryukov GV, Shpunt A, Stamatoyannopoulos JA, Sunyaev SR. Power of deep, all-exon resequencing for discovery of human trait genes. Proc Natl Acad Sci USA. 2009;106:3871–3876. doi: 10.1073/pnas.0812824106. [DOI] [PMC free article] [PubMed] [Google Scholar]
- Lavebratt C, Sengul S. Single nucleotide polymorphism (SNP) allele frequency estimation in DNA pools using Pyrosequencing. Nat Protoc. 2006;1:2573–2582. doi: 10.1038/nprot.2006.442. [DOI] [PubMed] [Google Scholar]
- Li R, Li Y, Fang X, Yang H, Wang J, Kristiansen K, Wang J. SNP detection for massively parallel whole-genome resequencing. Genome Res. 2009;19:1124–1132. doi: 10.1101/gr.088013.108. [DOI] [PMC free article] [PubMed] [Google Scholar]
- Li R, Li Y, Kristiansen K, Wang J. SOAP: short oligonucleotide alignment program. Bioinformatics. 2008;24:713–714. doi: 10.1093/bioinformatics/btn025. [DOI] [PubMed] [Google Scholar]
- Marchini J, Howie B, Myers S, McVean G, Donnelly P. A new multipoint method for genome-wide association studies by imputation of genotypes. Nat Genet. 2007;39:906–913. doi: 10.1038/ng2088. [DOI] [PubMed] [Google Scholar]
- McCarthy MI, Abecasis GR, Cardon LR, Goldstein DB, Little J, Ioannidis JP, Hirschhorn JN. Genome-wide association studies for complex traits: consensus, uncertainty and challenges. Nat Rev Genet. 2008;9:356–369. doi: 10.1038/nrg2344. [DOI] [PubMed] [Google Scholar]
- McCarthy MI, Hirschhorn JN. Genome-wide association studies: potential next steps on a genetic journey. Hum Mol Genet. 2008;17:R156–165. doi: 10.1093/hmg/ddn289. [DOI] [PMC free article] [PubMed] [Google Scholar]
- McClellan JM, Susser E, King MC. Schizophrenia: a common disease caused by multiple rare alleles. Br J Psychiatry. 2007;190:194–199. doi: 10.1192/bjp.bp.106.025585. [DOI] [PubMed] [Google Scholar]
- Nejentsev S, Walker N, Riches D, Egholm M, Todd JA. Rare variants of IFIH1, a gene implicated in antiviral responses, protect against type 1 diabetes. Science. 2009;324:387–389. doi: 10.1126/science.1167728. [DOI] [PMC free article] [PubMed] [Google Scholar]
- Nelder JA, Mead R. A simplex method for function minimization. Computer Journal. 1965;7:303–307. [Google Scholar]
- Norton N, Williams NM, O’Donovan MC, Owen MJ. DNA pooling as a tool for large-scale association studies in complex traits. Ann Med. 2004;36:146–152. doi: 10.1080/07853890310021724. [DOI] [PubMed] [Google Scholar]
- Okou DT, Steinberg KM, Middle C, Cutler DJ, Albert TJ, Zwick ME. Microarray-based genomic selection for high-throughput resequencing. Nat Methods. 2007;4:907–909. doi: 10.1038/nmeth1109. [DOI] [PubMed] [Google Scholar]
- Polychronakos C. Common and rare alleles as causes of complex phenotypes. Curr Atheroscler Rep. 2008;10:194–200. doi: 10.1007/s11883-008-0031-1. [DOI] [PubMed] [Google Scholar]
- Porreca GJ, Zhang K, Li JB, Xie B, Austin D, Vassallo SL, LeProust EM, Peck BJ, Emig CJ, Dahl F, Gao Y, Church GM, Shendure J. Multiplex amplification of large sets of human exons. Nat Methods. 2007;4:931–936. doi: 10.1038/nmeth1110. [DOI] [PubMed] [Google Scholar]
- Raymond FL, Whibley A, Stratton MR, Gecz J. Lessons learnt from large-scale exon re-sequencing of the X chromosome. Hum Mol Genet. 2009;18:R60–64. doi: 10.1093/hmg/ddp071. [DOI] [PMC free article] [PubMed] [Google Scholar]
- Scott LJ, Mohlke KL, Bonnycastle LL, Willer CJ, Li Y, Duren WL, Erdos MR, Stringham HM, Chines PS, Jackson AU, Prokunina-Olsson L, Ding CJ, Swift AJ, Narisu N, Hu T, Pruim R, Xiao R, Li XY, Conneely KN, Riebow NL, Sprau AG, Tong M, White PP, Hetrick KN, Barnhart MW, Bark CW, Goldstein JL, Watkins L, Xiang F, Saramies J, Buchanan TA, Watanabe RM, Valle TT, Kinnunen L, Abecasis GR, Pugh EW, Doheny KF, Bergman RN, Tuomilehto J, Collins FS, Boehnke M. A genome-wide association study of type 2 diabetes in Finns detects multiple susceptibility variants. Science. 2007;316:1341–1345. doi: 10.1126/science.1142382. [DOI] [PMC free article] [PubMed] [Google Scholar]
- Servin B, Stephens M. Imputation-based analysis of association studies: candidate regions and quantitative traits. PLoS Genet. 2007;3:e114. doi: 10.1371/journal.pgen.0030114. [DOI] [PMC free article] [PubMed] [Google Scholar]
- Sham P, Bader JS, Craig I, O’Donovan M, Owen M. DNA Pooling: a tool for large-scale association studies. Nat Rev Genet. 2002;3:862–871. doi: 10.1038/nrg930. [DOI] [PubMed] [Google Scholar]
- Shanno DF. Conditioning of Quasi-Newton methods for function minimization. Math Comp. 1970;24:647–656. [Google Scholar]
- Skol AD, Scott LJ, Abecasis GR, Boehnke M. Joint analysis is more efficient than replication-based analysis for two-stage genome-wide association studies. Nat Genet. 2006;38:209–213. doi: 10.1038/ng1706. [DOI] [PubMed] [Google Scholar]
- Thomas G, Jacobs KB, Kraft P, Yeager M, Wacholder S, Cox DG, Hankinson SE, Hutchinson A, Wang Z, Yu K, Chatterjee N, Garcia-Closas M, Gonzalez-Bosquet J, Prokunina-Olsson L, Orr N, Willett WC, Colditz GA, Ziegler RG, Berg CD, Buys SS, McCarty CA, Feigelson HS, Calle EE, Thun MJ, Diver R, Prentice R, Jackson R, Kooperberg C, Chlebowski R, Lissowska J, Peplonska B, Brinton LA, Sigurdson A, Doody M, Bhatti P, Alexander BH, Buring J, Lee IM, Vatten LJ, Hveem K, Kumle M, Hayes RB, Tucker M, Gerhard DS, Fraumeni JF, Hoover RN, Chanock SJ, Hunter DJ. A multistage genome-wide association study in breast cancer identifies two new risk alleles at 1p11.2 and 14q24.1 (RAD51L1) Nat Genet. 2009 doi: 10.1038/ng.353. [DOI] [PMC free article] [PubMed] [Google Scholar]
- Van Tassell CP, Smith TP, Matukumalli LK, Taylor JF, Schnabel RD, Lawley CT, Haudenschild CD, Moore SS, Warren WC, Sonstegard TS. SNP discovery and allele frequency estimation by deep sequencing of reduced representation libraries. Nat Methods. 2008;5:247–252. doi: 10.1038/nmeth.1185. [DOI] [PubMed] [Google Scholar]
- Wang H, Thomas DC, Pe’er I, Stram DO. Optimal two-stage genotyping designs for genome-wide association scans. Genet Epidemiol. 2006;30:356–368. doi: 10.1002/gepi.20150. [DOI] [PubMed] [Google Scholar]
- Wang J, Wang W, Li R, Li Y, Tian G, Goodman L, Fan W, Zhang J, Li J, Zhang J, Guo Y, Feng B, Li H, Lu Y, Fang X, Liang H, Du Z, Li D, Zhao Y, Hu Y, Yang Z, Zheng H, Hellmann I, Inouye M, Pool J, Yi X, Zhao J, Duan J, Zhou Y, Qin J, Ma L, Li G, Yang Z, Zhang G, Yang B, Yu C, Liang F, Li W, Li S, Li D, Ni P, Ruan J, Li Q, Zhu H, Liu D, Lu Z, Li N, Guo G, Zhang J, Ye J, Fang L, Hao Q, Chen Q, Liang Y, Su Y, San A, Ping C, Yang S, Chen F, Li L, Zhou K, Zheng H, Ren Y, Yang L, Gao Y, Yang G, Li Z, Feng X, Kristiansen K, Wong GK, Nielsen R, Durbin R, Bolund L, Zhang X, Li S, Yang H, Wang J. The diploid genome sequence of an Asian individual. Nature. 2008;456:60–65. doi: 10.1038/nature07484. [DOI] [PMC free article] [PubMed] [Google Scholar]
- Wheeler DA, Srinivasan M, Egholm M, Shen Y, Chen L, McGuire A, He W, Chen YJ, Makhijani V, Roth GT, Gomes X, Tartaro K, Niazi F, Turcotte CL, Irzyk GP, Lupski JR, Chinault C, Song XZ, Liu Y, Yuan Y, Nazareth L, Qin X, Muzny DM, Margulies M, Weinstock GM, Gibbs RA, Rothberg JM. The complete genome of an individual by massively parallel DNA sequencing. Nature. 2008;452:872–876. doi: 10.1038/nature06884. [DOI] [PubMed] [Google Scholar]
- Zuo Y, Zou G, Wang J, Zhao H, Liang H. Optimal two-stage design for case-control association analysis incorporating genotyping errors. Ann Hum Genet. 2008;72:375–387. doi: 10.1111/j.1469-1809.2007.00419.x. [DOI] [PMC free article] [PubMed] [Google Scholar]
- Zuo Y, Zou G, Zhao H. Two-stage designs in case-control association analysis. Genetics. 2006;173:1747–1760. doi: 10.1534/genetics.105.042648. [DOI] [PMC free article] [PubMed] [Google Scholar]
Associated Data
This section collects any data citations, data availability statements, or supplementary materials included in this article.
Supplementary Materials
Supplementary Figure 1: Illustration of the pooling procedure used in the empirical study, based on the original method by Lavebratt and Sengul [Lavebratt and Sengul, 2006].
Supplementary Figure 10: Effect of filtering low-MAF sites on the power for different settings with a fixed cost. The four panels correspond to no filtering (top left), filtering at 0.5% (top right), filtering at 1% (bottom left), and filtering at 2% (bottom right), respectively. For details about filtering, see the caption of Supplementary Figure 9. For details about the experimental settings, see the caption of Figure 5A.
Supplementary Figure 2: Variation in total depth across 17,550 polymorphic sites that were found, using five individuals sequenced in our empirical study (see Results). The polymorphic sites were identified using the program SOAPsnp [Li et al., 2009]. The histogram of total depth is superimposed on the density function of the Poisson distribution with mean equal to the average of the total depth (blue vertical line).
Supplementary Figure 3: Strong correlation in total read depth across the sites between two individually sequenced samples. The sites in the sequenced regions were binned based on the total depth of sample 3, then, within each bin, the total depth of sample 4 was used to draw a box-plot.
Supplementary Figure 4: Distribution of p-values of our LRT statistic for SNPs with different MAFs. The p-values were computed based on an asymptotic approximation (i.e., by assuming that our LRT statistic follows a chi-squre distribution with degrees of freedom of 1). The dotted green line indicates the expected counts when the p-values are uniformly distributed. Sites are simulated, assuming sequencing 1000 cases and 1000 controls at 8X using a pool size of five.
Supplementary Figure 5: Distribution of p-values for SNPs with different MAFs and pool sizes. Sites are simulated assuming sequencing of 1000 cases and 1000 controls at 8X using various pool sizes. For more details, see caption of Supplementary Figure 4.
Supplementary Figure 6: Distribution of p-values for SNPs with different MAFs and individual depths. Sites are simulated assuming sequencing of 1000 cases and 1000 controls at various depth, using a pool size of five. For more details, see caption of Supplementary Figure 4.
Supplementary Figure 7: Effect of pool size Ps on the power when the pooling variance Vp is 1/3. Note that the estimated pooling variance from our empirical study is 1/300 (see Results). For more details of caption, see Figure 3B.
Supplementary Figure 8: Effect of mis-specification of error rate on the power. To compute the power, the LRT statistic is computed using the true error rate (true), using the estimated error rate at each site (estimated), and two mis-specified error rates (given). A range of minor allele frequencies (black: 0.5%, red: 1%, and blue: 5%) and relative risks (x-axis) for the disease variant are examined. Sites are simulated assuming sequencing of 1000 cases and 1000 controls at 4X using a pool size of five.
Supplementary Figure 9: Effect of filtering low-MAF sites on the power. Here, the power is defined as the chance of including the causative SNP with a MAF of black: 0.5%, red: 1%, and blue: 5% and a specified relative risk (x-axis), among the 50 SNPs with strongest signal of association among 300,000 sites. Sites with estimated MAF less than ‘f’ were eliminated from the sample. The simulations assume sequencing of 1000 cases and 1000 controls at 4X using a pool size of five.