

Abstract
The striatum contributes to many cognitive processes and disorders, but its cell types are incompletely characterized. We show that microfluidic and FACS-based single-cell RNA sequencing of mouse striatum provides a well-resolved classification of striatal cell type diversity. Transcriptome analysis revealed 10 differentiated distinct cell types, including neurons, astrocytes, oligodendrocytes, ependymal, immune, and vascular cells, and enabled the discovery of numerous marker genes. Furthermore, we identified two discrete subtypes of medium spiny neurons (MSN) which have specific markers and which overexpress genes linked to cognitive disorders and addiction. We also describe continuous cellular identities, which increase heterogeneity within discrete cell types. Finally, we identified cell type specific transcription and splicing factors that shape cellular identities by regulating splicing and expression patterns. Our findings suggest that functional diversity within a complex tissue arises from a small number of discrete cell types, which can exist in a continuous spectrum of functional states.
Graphical abstract

INTRODUCTION
The striatum, the gateway to basal ganglia circuitry, is involved in translating cortical activity into adaptive motor actions. Striatal dysfunction in neuronal and non-neuronal cells, conversely, contributes to many neuropsychiatric disorders, including Parkinson’s and Huntington’s disease, schizophrenia, obsessive-compulsive disorder, addiction and autism (Kreitzer and Malenka, 2008; Maia and Frank, 2011; Robison and Nestler, 2011).
The principal projection neurons in the striatum are the medium spiny neurons (MSNs), which constitute 90–95% of all the neurons in the striatum. The classical model of basal ganglia circuits proposes that MSNs are composed of two subtypes with opposing circuit functions. D1-MSNs preferentially express D1-dopamine receptors and promote movement while D2-MSNs primarily express D2-dopamine receptors and inhibit movement (Delong and Wichmann, 2009). Recent anatomical and functional evidence suggests that this model, while heuristically useful, may need to be modified by incorporating a detailed characterization of the phenotypic diversity of striatal MSNs (Calabresi et al., 2014; Cui et al., 2013; Kupchik et al., 2015; Nelson and Kreitzer, 2014). Previous efforts to characterize striatal diversity have been either low-dimensional, measuring a small number of transcripts in single cells, or reliant on pooling large numbers of striatal cells for bulk RNA sequencing and obscuring heterogeneity within the pooled populations (Fuccillo et al., 2015; Heiman et al., 2008; Lobo et al., 2006).
Recent technological advances in single-cell mRNA-sequencing (scRNAseq) have enabled description of the cellular diversity of tissues, and allowed identification of distinct cell subtypes in the developing mouse lung (Treutlein et al., 2014a), the murine spleen (Jaitin et al., 2014), the mouse and human cortex and hippocampus (Darmanis et al., 2015; Zeisel et al., 2015a), other neuronal tissues (Pollen et al., 2014; Usoskin et al., 2014), and the intestine (Grün et al., 2015). Here, we use scRNAseq of 1208 striatal cells combined with unbiased computational analysis to reconstruct the phenotypic heterogeneity of the striatum.
RESULTS
Identification of major striatal cell types by transcriptome clustering
We measured the transcriptome of 1208 single striatal cells using two complementary approaches; microfluidic single-cell RNAseq (Mic-scRNAseq) and single cell isolation by FACS (FACS-scRNAseq) (Table S1). We sampled cells either randomly or enriched specifically for MSNs or astrocytes using FACS from D1- tdTomato (tdTom)/D2-GFP or Aldhl1-GFP mice, respectively (Figure 1A)(Heintz, 2004; Shuen et al., 2008). We assessed technical noise, cell quality and dynamic range using RNA control spike-in standards (Figure S1A-D). Saturation analysis confirmed that our sequencing depth of 1-5×10⁶ reads per cell is sufficient to detect most genes expressed (Figure S1E) and that the number of genes detected per cell is independent of the sequencing depth (Figure S1F-H).
Figure 1. Reverse engineering of mouse striatum by single-cell RNAseq.

A) Workflow for obtaining and sequencing cDNA from single cells. Striatal slices from D1-tdTom/D2-GFP and Aldhl1-GFP mice were dissociated and cells collected by FACS or MACS. Cells were then captured, imaged, and cDNA amplified in microfluidic chips.
B) Unbiased clustering of ten major classes of cells using t-distributed stochastic neighbor embedding (tSNE), which distributes cells according to their whole-transcriptome correlation distance. Each single cell is represented as a dot and colored by a clustering algorithm (DBSCAN).
C) Box-and-whisker plots showing total number of genes detected per cell for major cell types.
D) Expression of putative marker genes for each of 10 major cell types. Scaled expression of marker genes is shown by the color of the cell points. Each tSNE cluster is enriched for one marker, and we were able to cells to one of 10 major cell types.
E) Heatmap of top 50 genes most highly correlated to each cell type. Each row is a single cell and each column is a single gene. Bar on the right shows the experimental origin of cells. Bar on the left shows DBSCAN clustering of cells and the bottom shows the cell type assignment for each set of 50 genes. Within each 50-gene set, the genes are ordered by increasing p-value of correlation to that cell type from left to right.
To identify distinct cell populations in Mic-scRNAseq cells, we visualized cells using 2D tSNE on whole-transcriptome data weighted by a Bayesian noise model (Figure 1B) (Kharchenko et al., 2014; Maaten et al., 2008). Examining the expression of known cell type markers, we assigned cell type names to the major clusters (Figure 1B-D) (Doetsch et al., 1999; Zhang et al., 2014). Our analysis revealed 368 neuronal cells, 119 immune cells (microglia and macrophages), 107 astrocytes, 43 oligodendrocytes, 43 vascular cells, 39 ependymal cells (ciliated and secretory), and 20 stem cells (Figure S3A). The stem cells were composed of neuronal stem cells (NSCs), likely captured from the rostral migratory stream (Aguirre et al., 2010), and oligodendrocyte precursor cells (OPCs).
The number of expressed genes per cell significantly differed between cell types independent of sequencing depth. Single striatal neurons expressed more genes than all other striatal cell types, suggesting that neurons possess higher level of functional complexity (Figure 1C S1E-H).
Cells captured in FACS enrichment of Aldh1l1-GFP mice were mostly confined in the astrocyte cluster, and cells from FACS enrichment of Drd1a-tdTom/Drd2-GFP cells were confined largely to the neuronal cluster. However, neither tSNE nor whole-transcriptome PCA (Figure 1B and S2), separated D1 MSNs from D2 MSNs within the neuronal cluster, suggesting that their overall gene expression pattern is very similar. All identified cell types were sampled in multiple experiments involving a total of 26 mice (Figures 1E, S2, Table S1).
Unbiased identification of cell type specific genes
We identified marker genes for these cell types by the Spearman correlation of genes to cell cluster (Figure 1E and Table S2). Interestingly, NSCs expressed many astrocyte- and neuron-specific genes, further evidence for their proposed origin from astrocytes and eventual fate as neurons.
Striatal neurons show the highest correlation with Trank1 (also called Lba1), whose genetic variants recently were associated with bipolar disorder (Mühleisen et al., 2014). The second highest correlating genes for striatal neurons is Atp1a3, which encodes the α3 subunit of Na+/K+-ATPase, and is associated with rapid-onset dystonia parkinsonism and alternating hemiplegia of childhood (Heinzen et al., 2014). The highest correlating gene for striatal astrocytes is Gjb6, which is required for intercellular trafficking of glucose and its metabolites to neurons (Pannasch et al., 2014), and is associated with non-syndromic autosomal dominant deafness (Rouach et al., 2008). For perivascular macrophages, the highest correlating gene is Pf4 (also known as Cxcl4), which plays a role in coagulation and inflammation (Amiral et al., 1996). Microglia are defined by specific expression of Tmem119, a gene that has been proposed to clearly discriminate microglia from perivascular macrophages (Satoh et al., 2015). The highest correlating gene with OPC is A930009A15Rik, a gene that has not yet been functionally characterized (Table S2). Finally, ependymal cells were divided into two subtypes: ciliated ependymal cells are correlated with Spag17, Armc4, Hydin and Dnali1, genes which are involved in cilium movement. The second subtype of secretory ependymal cells correlated with Npr3, Prlr and Slc4a5, genes that are involved in cellular secretion (Table S2).
Gene Ontology (GO) analysis based on cell-type specific correlating genes found terms associated with the given cell type function, such as synaptic transmission for neurons, vascular biology for vascular cells, cilium movement for ciliated ependymal cells, and cell division or cell cycle exit for NSCs. GO analysis returned only 2 terms for OPC and none for secretary ependymal cells, highlighting the limited knowledge of their biology (Tables S3, S4).
Discrete subtypes of striatal medium spiny neurons
The neuronal composition of the striatum is defined by a large population of D1- and D2-MSNs and a small population of interneurons (Kreitzer and Malenka, 2008). Using a set of known interneuron and MSN markers, we identified five interneurons, too few to explore their diversity (Figure S3B, Tables S5). Using Mic-scRNAseq, we analyzed a total of 334 MSNs captured either randomly or enriched using FACS (Figure S3C-E). The fluorescence signal emitted by each cell was monitored on the microfluidic chip (Figure S3E). In order to unbiasedly identify MSN subtype specific genes, we used pairwise correlation analysis to identify genes that showed high correlation of expression within a group of genes and strong anticorrelation to another group of correlated genes. This revealed two sets of genes that are specific to D1- or D2-MSNs (Figure 2A). Tac1, Drd1a and Isl1 are known to be required for D1-MSN differentiation and function (Ehrman et al., 2013; Heiman et al., 2008). The D2-specific gene cluster included the known D2-MSN markers Drd2, Adora2a, Penk, Gpr6, and Gpr52 (Heiman et al., 2008; Lobo et al., 2006) as well as the transcription factor Sp9 (Figure 2A). We performed robust PCA (rPCA) (Todorov and Filzmoser, 2009) using those genes, and observed a clearly bimodal distribution of PC1 scores, indicating that the D1/D2 division represented discrete subtypes and independent of cell isolation methods (Figure S3C).
Figure 2. Characterization of discrete MSN subtypes.

A) Hierarchical clustering of the highest pairwise gene correlations in MSNs shows two strongly anticorrelated clusters of genes which include known MSN subtype markers for D1- and D2-MSNs.
B) rPCA of MSNs, Cells (rows) are ordered by their projection onto PC1 and genes (columns) by their positive (left) or negative (right) contribution to PC1. This identifies three molecularly distinct populations, assigned to D1-MSN (red), D2-MSN (green) and D1/2 hybrid MSN (yellow). Bar on the left shows the experimental origin of cells.
C) The distribution of single MSNs projected onto the D1-D2 scores. The D1 and D2 score is calculated by summing the scaled expression values of the genes shown in Fig 2B. D1- and D2-MSNs form distinct peaks, and the novel MSNs are distributed between the 2 peaks.
D) Biplot of D1- and D2-MSN cells by their expression of D1 genes (y-axis) and of D2 genes (x-axis). Scaled expression of Drd1 is shown by the color of the cell points.
E) Sagittal brain section of a D2-GFP/D1-TdTom double reporter mouse showing tdTom-GFP double positive novel MSNs in both nucleus accumbens and dorsal striatum.
F) Confocal imaging of striatal slices of D2-GFP/D1-TdTom double reporter mice demonstrating the existence of D1/2 hybrid MSNs in striatum.
G) rPCA of MSNs in D1 part of Figure 2D using all expressed genes, cells (rows) are ordered by their projection onto PC1 and genes (columns) by their positive (left) or negative (right) contribution to PC1. This identifies two molecularly distinct populations, assigned to Major (Foxp1) D1-MSN (red), and Pcdh8-MSN (yellow).
H) Biplot of major D1- and Pcdh8-MSN cells by their expression of D1 genes (y-axis) and of Pcdh8 genes (x-axis). Scaled expression of Penk is shown by the color of the cell points.
I) The distribution of MSNs projected onto Pcdh8-Foxp1 scores. Major-D1 and Tacr1-MSNs form distinct peaks
J) Box plots showing specific Pcdh8 and Tacr1 expression in Tacr1-MSNs compared to other cell types in MSN.
K) rPCA of MSNs in D2 part of Figure 2D, cells (rows) are ordered by their projection onto PC1 and genes (columns) by their positive (left) or negative (right) contribution to PC1. This identifies two molecularly distinct populations, assigned to D2-MSN (green), and Htr7-MSN (light green).
L) Biplot of D2- and Htr7-MSN cells by their expression of Htr7- genes (y-axis) and of Synpr- genes (x-axis). Scaled expression of Tac1 is shown by the color of the cell points.
M) The distribution of MSNs projected onto Htr7-Synpr scores. Major D2- and Htr7-MSNs form distinct peaks
N) Box plots showing specific Htr7 and Agtr1a expression in Htr7-MSNs compared to other cell types in MSN.
We confirmed our findings using an independent approach, where we sequenced additional 570 single MSNs from 5 mice using FACS-scRNAseq. We scored MSNs based on their expression of the D1 and D2 marker genes (D1-D2 scores, see Supplementary Methods) and observed a clearly bimodal distribution of cells based on these scores (Figure 2B-C), indicating the existence of two discrete subtypes, D1 and D2-MSNs (Figure 2D). Interestingly, we noticed that some MSNs coexpressed several D1 and D2 markers. We confirmed their existence in the tissue by in situ imaging of the striatum of D2-GFP/D1-TdTom double reporter mice. We could identify tdTom-GFP double-positive MSNs in both nucleus accumbens and dorsal striatum using fluorescence microscopy (Figure 2E-F, S3F). rPCA of D1-MSNs revealed a set of genes that separated D1-MSNs into two subpopulations: a majority subpopulation expressing high levels of Foxp1 and Camk4 and a minor subpopulation defined by expression of genes such as Pcdh8, Tacr1, and Adarb2 (Pcdh8-MSN) (Figure 2G-Js, Table S6). Notably, the Pcdh8-MSN subpopulation coexpressed the D2 neuropeptide Penk along with Tac1 (Figure 2H). We scored D1-MSNs based on expression of rPCA-identified genes (Pcdh8-Foxp1 scores), which revealed a clearly bimodal population distribution defining two discrete subpopulations (Fig 2I). Many of the genes that were enriched in Pcdh8-MSNs are related to neurological disorders (Nrxn2, Sema3e, Sema4a, Sema5a, Sema5b, Sema6d, Pcdh7, Pcdh8, Ptprg, Ptprm, Ptpro and Ptpru)(Redies et al., 2012; De Rubeis et al., 2014; Südhof, 2008), tachykinin signaling (Tac2 and Tacr1) (Steinhoff et al., 2014), and RNA binding (Elavl4, Adarb2, Khdrbs3, Rbm20, Aff2, Lrpprc and Celf4) (Li et al., 2007; Noureddine et al., 2005). Pcdh8-MSNs are also depleted of important neuronal genes like Nlgn1 and Calb1 (Table S6).
Similar to D1-MSNs, rPCA of D2-MSNs revealed two discrete subpopulations: a small subpopulation marked by unique expression of many genes, including Htr7 and Agtr1a, as well as the coexpression of D1 and D2 neuropeptides Penk and Tac1 (Htr7-MSN) (Figure 2K-N, Table S6). Genes enriched in the Htr7-MSN subpopulation included receptors Htr7, Ptprt, Ngfr, Grik3, Cacng5 and Tmeff2, and transcription factors Sox9, Sp8, Runx1, Mafb and Litaf. Htr7-MSNs are significantly depleted of important neuronal genes like Cacna2d3 and Synpr compared to the major D2 population (Table S6) and showed coexpression of the Gfp and tdTom transgenes.
Continuous transcriptional gradients within MSN subtypes
We continued our analysis of heterogeneity within subpopulations of MSNs. rPCA on Foxp1-high D1 MSNs revealed a subpopulation expressing high levels of Dner, Cxcl14 and Tnnt1 and lacking Meis2 (D1-Dner, Figure 3A-C, S4A, Table S6). Similarly, rPCA on Synpr-high D2 MSNs revealed a small population expressing Cartpt and Kcnip1 but lacking Calb1 (Figure 3G-H, S4C). rPCA on the Meis2+/Dner-subpopulation of D1-MSNs revealed a gradient of transcriptome states (Figure 3D), indicated by the unimodal distribution of cells’ Crym – Cnr1 score (Figure 3E, S4B). Some of the genes defining the opposing gradients are known to be differentially expressed between striatal matrix (e.g. Cnr1) and striosome (e.g. Nnat and Gfra1) microzones (Crittenden and Graybiel, 2011) (Figure 3D-E, S4B). rPCA revealed similar unimodal gene expression gradients for the other main MSN subtypes (Figure 3J-R, S4D). The transcriptional gradients within all the main MSN subtypes shared several genes (e.g. Cnr1, Crym, and Wfs1).
Figure 3. Identification of heterogeneity within MSN subtypes.
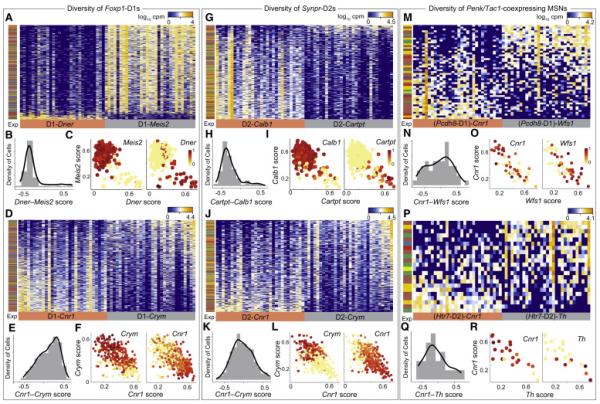
A) rPCA of major D1-MSNs using all expressed genes, reveals a molecularly distinct sub-population of D1-Dner MSNs. Bar on the left shows the experimental origin of cells.
B) The distribution of D1-MSNs projected onto Meis2-Dner gene group scores.
C) Biplot of D1- and D1-Dner MSNs by their expression of D1-Meis2 genes (y-axis) and of D1-Tnnt1 genes (x-axis). Scaled expression of Meis2 and Tnnt1 are shown by the color of the cell points
D) rPCA of D1-MSNs using all expressed genes, reveals a continuous transcriptional gradient marked by opposing expression gradients of Cnr1 and Wfs1. Bar on the left shows the experimental origin of cells.
E) The distribution of D1-MSNs projected onto Cnr1-Wfs1 gradient scores.
F) Biplot of D1-MSNs by their expression of Wfs1 gradient genes (y-axis) and of Cnr1 gradient genes (x-axis). Scaled expression of Cnr1 and Wfs1 are shown by the color of the cell points.
G) rPCA of D2-MSNs using all expressed genes, reveals a sub-population of D2-Cartpt MSNs. Bar on the left shows the experimental origin of cells.
H) The distribution of D2-MSNs projected onto Calb1-Cartpt gene group scores.
I) Biplot of D2-Calb1 and D2-Cartpt MSNs by their expression of Cartpt group genes (y-axis) and of Calb1 group genes (x-axis). Scaled expression of Calb1 and Cartpt are shown by the color of the cell points.
J) rPCA of D2-MSNs using all expressed genes, reveals a continuous transcriptional gradient marked by opposing expression gradients of Cnr1 and Crym. Bar on the left shows the experimental origin of cells.
K) The distribution of D1-MSNs projected onto Cnr1-Crym gradient scores.
L) Biplot of D1- MSNs by their expression of Crym gradient genes (y-axis) and of Cnr1 gradient genes (x-axis). Scaled expression of Cnr1 and Crym are shown by the color of the cell points
M) rPCA of Pcdh8-MSNs using all expressed genes, reveals a continuous transcriptional gradient marked by opposing expression gradients of Cnr1 and Wfs1 similar to 2D. Bar on the left shows the experimental origin of cells
N) The distribution of Pcdh8-MSNs projected onto Cnr1-Wfs1 gradient scores.
O) Biplot of Pcdh8-MSNs by their expression of Wfs1 gradient genes (y-axis) and of Cnr1 gradient genes (x-axis). Scaled expression of Cnr1 and Wfs1 are shown by the color of the cell points.
P) rPCA of Htr7-MSNs, reveals a continuous transcriptional gradient marked by opposing expression gradients of Cnr1 and Th. Bar on the left shows the experimental origin of cells
Q) The distribution of Htr7-MSNs projected onto Cnr1-Th gradient scores.
R) Biplot of Htr7-MSNs by their expression of Th gradient genes (y-axis) and of Cnr1 gradient genes (x-axis). Scaled expression of Cnr1 and Th are shown by the color of the cell points.
Subtypes of non-neuronal striatal cell types
We next characterized heterogeneity within vascular cells, immune cells, oligodendrocytes and astrocytes. Within vascular cells, pairwise correlation analysis revealed two large anticorrelated gene groups (Figure 4A). rPCA using these genes revealed two discrete subpopulations: a population of vascular smooth muscle cells (VSMCs, expression of Myl9 and Tagln), and a population as endothelial cells (expression of Pltp and Ly6c1) (Zeisel et al., 2015a)(Figure 4B,C). Likewise, within immune cells, pairwise correlation analysis and rPCA revealed two discrete subpopulations: microglia cells expressing Cx3cr1, Olfml3, and Mlxipl, and macrophages expressing Mrc1 and Dab2 (Figure 4D-F).
Figure 4. Characterization of vascular cells, astrocytes, and oligodendrocytes.

A) Hierarchical clustering of the highest pairwise gene correlations within vascular cells reveals two large clusters of subtype specific transcripts.
B) rPCA of 43 striatal vascular cells identifies two molecularly distinct populations, assigned to vascular smooth muscle cells (VSMC) that express Myl9 and Tagln and endothelial cells that express Ly6e and Pltp.
C) A histogram of vascular cells’ PC1 scores shows a clearly bimodal distribution and confirms the existence of two distinct subtypes.
D) Hierarchical clustering of the highest pairwise gene correlations within immune cells reveals two large clusters of interconnected transcripts.
E) rPCA of 119 immune cells (microglia and macrophages) identifies two molecularly distinct populations, assigned to microglia that express Sparc and macrophages that express Mrc1.
F) The distribution of single immune cells along the first PC1 of rPCA. Cells form two distinct peaks.
G) Hierarchical clustering of the highest pairwise gene correlations within oligodendrocytes reveals two large clusters of interconnected transcripts.
H) rPCA of 43 striatal oligodendrocytes identifies two distinct oligodendrocyte populations: mature oligodendrocytes (MO) which express Klk6 and Sec11c, and newly formed oligodendrocytes (NFO) which express Nfasc and Ckb. There are also a significant number of oligodendrocytes with intermediate expression of both sets of genes, which are likely transitioning between NFO and MO.
I) The distribution of single oligodendrocytes along the first PC1 of rPCA. MO and NFO cells form two distinct peaks with transitioning oligodendrocytes bridging the two peaks.
J) Hierarchical clustering of the highest pairwise gene correlations within astrocytes did not reveal interconnected transcripts, instead showing low correlation values between genes.
J) rPCA of 107 single striatal astrocytes reveals transcripts that increase or decrease continuously without defining distinct subpopulations. Cells (rows) are ordered by their PC1 scores and genes (columns) are ordered by their PC1 loading. The continuum of astrocyte transcriptional states on one side is marked by higher expression of transcripts related to synaptic communication (Slc6a11, Slc6a1, Slc6a9, Gria1 and Gria2) and on the other side transcripts related to translation (Rpl9, Rpl14, Rps5 and Rpsa) and cell polarity regulators (Cdc42).
L) The distribution of single astrocytes along PC1 is unimodal indicating striatal astrocytes exhibit continuous transcriptional variation within one discrete subtype.
Within oligodendrocytes, we found two large anticorrelated gene groups (Figure 4G). Projecting the cells onto PC1 revealed 2 discrete oligodendrocyte subtypes: a population of newly forming oligodendrocytes (NFO) expressing Nfasc, and a population of mature oligodendrocytes (MO) expressing Klk6 (Zhang et al., 2014). These two discrete populations were connected by cells which co-expressed both NFO and MO genes and which may represent a transitioning population (Figure 4H,I).
The pairwise correlation analysis did not identify two clearly anticorrelated gene groups for astrocytes (Figure 4J); instead, whole-transcriptome rPCA revealed a continuous transcriptional gradient defined by a unimodal population distribution (Figure 4K,L). The genes defining this gradient were on one side related to synaptic communication such as neurotransmitter transporters (Slc6a11, Slc6a1 and Slc6a9) and glutamate receptors (Gria1 and Gria2) and on the other side related to translation, like ribosomal proteins (Rpl9, Rpl14, Rps5 and Rpsa) and cell polarity regulators (Cdc42) (Etienne-manneville and Hall, 2003).
Distinct groups of transcription factors maintain cell type identity
We used correlation analysis to identify transcription factors (TFs) expressed specifically (Spearman correlation coefficient >0.5) in single cells of a given type and visualized the pairwise correlation of the resulting 69 TFs in a correlogram (Figure 5A, Table S7). We found that striatal neurons correlated with the largest set of TFs (22) (Figure 1C) independent of the number of cells per subtype (Figure S5). Interestingly, the most specific neuronal TF, Myt1l, is able to induce neuronal cell identity in vitro when expressed in fibroblasts with two additional TFs (Vierbuchen et al., 2010). Generally, many of the cell-type-specific TFs identified by our analysis have been used in TF-based direct conversion protocols. Among them are Sox9 for astrocytes (Caiazzo et al., 2015), Sox10 for oligodendrocytes (Yang et al., 2013), Gata2 for endothelial cells (Elcheva et al., 2014), and Maf for macrophages (Hegde et al., 1999). Thus we also provide candidate transcription factors for stem cell transformation into cell types for which there are no existing protocols (Lmx1a for secretory ependymal cells, Foxj1 for ciliated ependymal cells, Tbx2 for vascular smooth muscle cells (VSMC), E2f8 for NSC, Mlxipl for microglia, Isl1 for D1-MSNs and Sp9 for D2-MSNs (Figure 5A, Table S7).
Figure 5. Cell type specific transcriptional factors identified by single-cell transcriptome analysis.

A) Correlogram visualizing correlation of single-cell gene expression between cell type-specific TFs.
B) Scaled expression of the TFs that are most specific to discrete cell types. Scaled expression of marker genes is shown by the color of the cell points.
While Isl1 is known to be required for normal functioning of D1-MSNs (Ehrman et al., 2013), a role of Sp9 in MSNs has not previously been described. Therefore, we analyzed the effect of Sp9 overexpression on expression of MSN markers in primary striatal cultures. The overexpression of Sp9 significantly lowered the expression of Drd1a without significantly altering the expression of D1-MSN markers Tac1, Pdyn or D2-MSN marker Drd2. These results suggest that Sp9 overexpression may disrupt the normal development of D1 MSNs (Figure S7).
Cell type-specific regulation of RNA splicing
Alternative splicing is a key mechanism for generating transcriptomic diversity. We used correlation analysis (SI Methods) to explore cell type-specific expression of RNA splice factors. We found eighteen splice factors that were specific to neurons and only one (Pcbp4) that correlated with oligodendrocytes (Figure 6A-B). No splice factors were found with high correlation to any of the other cell types. The factors specific to striatal neurons include all six members of the CUG-BP, Elav-like family (Celf), which are associated with autism, epilepsy and Alzheimer’s disease (Ladd, 2013) as well as all three of the RNA-binding Fox family of splicing factors, Rbfox1 (also known as Fox-1 or A2BP1), Rbfox2 (also known as Fox-2 or RBM9), and Rbfox3 (also known as Fox-3, HRNBP3 or NeuN). The Rbfox family of splice factors has been shown to maintain mature neuronal physiology and is also linked to autism(Gehman et al., 2012). Khdrbs2 (also called SLM1), which may contribute to alternative splicing of neurexins, was also enriched in neurons (Iijima et al., 2014). Many other neuron-enriched splice factors have not yet been well characterized for their neuronal roles (Snrpn, Txnl4a, Psip1, Rbm24, and Rbm3). In summary, analysis of cell type-specific splice factors showed that the regulatory diversity of splicing is higher in neurons than in other cell types in striatum.
Figure 6. Single-cell transcriptome analysis reveals splicing factors specific to neurons.

A) Hierarchical clustering of pairwise gene correlations for cell type specific splicing factors (SF).
B) tSNE plot of single cells colored by the scaled expression selected splicing factors: the neuronal-enriched splice factors Celf4 and Rbfox1 and the oligodendrocyte-enriched splice factor Pcbp4.
To complement this analysis, we identified 45,843 sites of alternative splicing by the reads mapping to exon junctions at splice sites. Using a Fisher Exact Test, we defined splice junctions that are differentially spliced (p<10−5) in one or more of the cell types (Figure 7A, S7A Table S8). These splice sites included genes such as Csde1 whose splicing is dysregulated in schizophrenia and for which a de novo loss-of-function mutation causes autism (Sanders et al., 2012), Hnrnpk (heterogeneous nuclear ribonucleoprotein K) which is associated with intellectual disability (Au et al., 2015), and Hspa5, which is linked to bipolar disorders and schizophrenia (Kakiuchi et al., 2003). The visualization of cell type-specific alternative splicing revealed many single cells that expressed both the major and minor variants, a phenomenon we termed “compound splicing” (Figure 7A, S7A-D, Table S8).
Figure 7. Differential splicing analysis reveals several modes of single-cell splicing regulation.

A) Expression of selected splice sites that have significant cell type-specific regulation. The number of reads per cell (log10) aligning to the major and minor variants are plotted on the x- and y-axes, respectively. Many single cells are located on the diagonal of the plots, indicating they express both the major and minor variants of that splice site (compound splice sites).
B) Box plots showing the total number of compound splice sites detected per cell across cell types.
It had been previously reported that single immune cells exclusively express either the major or minor splice variant (Shalek et al., 2013). However, we had observed that individual neurons were capable of expressing both splice versions of neurexins using single-cell qPCR (Fuccillo et al., 2015). Here, we performed a global analysis to quantify and compare genes with compound splice sites by cell type (Figure 7B). We detected very few compound splice sites in immune cells of the striatum, but higher numbers in single neurons as well as in NSCs, oligodendrocytes and secretory ependymal cells. There was no relationship between sequencing depth and number of compound splice sites detected per cell, ruling out systematic differences in sequencing depth as an explanation (Figure S7B). Moreover, 3′ - 5′ RNA coverage bias was similar across all cell types and between bulk controls and single cells (Figure S1 I-J).
DISCUSSION
Previous studies on the heterogeneity of striatal MSNs provided various classification schemes, including the classical distinction between D1- and D2-MSN subtypes based on expression of the D1- versus the D2-dopamine receptor (Kreitzer and Malenka, 2008), the anatomical location of MSNs in dorsal striatum or the nucleus accumbens (O’Doherty et al., 2004), and the position of a MSN within a striosome or matrix microzone (Crittenden and Graybiel, 2011).
We analyzed MSNs using single-cell RNA-Seq and found that D1-MSNs could be subdivided into two discrete populations: Pchd8-D1s and Foxp1-D1s. The Foxp1-D1 population could be further subdivided into Foxo1-high or Dner-high populations, although it was not clear how discrete the Foxo1-Dner division is. Similarly, we could subdivide D2-MSNs into two discrete subpopulations: Htr7-D2s and Synpr-D2s. The Synpr-D2 neurons could be further subdivided into Calb1-high or Cartpt-high subpopulations, though, as with Dner-D1s, it was not clear how discrete this division was. Two marker genes for Pchd8-D1 and Htr7-D2 subtypes, Htr7 and Tacr1, are linked to alcohol dependence (Blaine et al., 2013; Zlojutro et al., 2011) and repeated cocaine exposure regulates epigenetic control of Pcdh8-MSN marker 4932411E22Rik (Feng et al., 2015). The Pchd8-MSN subtype co-expresses Drd1a and Drd2 and therefore may possess atypical signaling and distinct properties Previous studies also suggested the possible existence of a third MSN population that co-express Drd1a and Drd2. However none of these studies provided specific markers for this population or resolved them into distinct subtypes (Ade et al., 2011; Bertran-Gonzalez, 2010; Frederick et al., 2015; Surmeier et al., 1997). An important result of our work is that we have conclusively proved existence of MSN subtype that co-express several D1- and D2-specific genes and shown that there are in fact two distinct such populations each with own specific markers. Given the involvement of MSNs in cognitive disorders, novel and discrete MSN subtypes expressing neuronal plasticity and addiction-related genes are likely to have important functions, which can be characterized in future studies using genetic tools based on markers identified here.
Within the discrete MSN subtypes, we identified a large degree of heterogeneity that did not further separate the cells into clear subtypes. We termed this a continuous transcriptional gradient, as the neurons had a range of expression of the opposing gene sets and a roughly unimodal expression distribution. The continua within all the main subtypes shared several genes (particularly Cnr1, Crym, and Wfs1), suggesting a common origin of these gradients. Previous single-cell RNA-Seq analyses have largely assumed that the identity of post-mitotic adult neurons is discrete: every neuron can be assigned a single subtype (Darmanis et al., 2015; Tasic et al., 2016; Usoskin et al., 2014; Zeisel et al., 2015b). Here, we find that there are at least two distinct aspects to neuronal identity: discrete subtypes, where two or more groups of neurons are clearly separated with few intermediates, and continuous gradients, where neurons within a subtype lie on a spectrum of gene expression, with most having a range of intermediate expression values of two gene sets.
We found continuous transcriptional gradients within glial cells as well. Astrocytes have been reported to be a heterogeneous cell type (Hochstim et al., 2008; Matthias et al., 2003). We discovered a continuum (Figure 4J-L) wherein genes for neurotransmitter transporters and receptors are anticorrelated to genes coding for ribosomal proteins and the cell polarity regulator Cdc42. This may therefore represent a continuum of astrocyte states, ranging from more actively involved in synaptic communication (Matthias et al., 2003) to more inactive or developmentally more immature (Etienne-manneville and Hall, 2003). We applied our analysis approach to other striatal cell types identified by tSNE. Pairwise correlation analysis of the vascular cells, the immune cells and the oligodendrocytes identified subtypes and large set of subtype specific markers (Figure 4A-L).
We also identified cell type-specific TFs (Figure 5A-B, Table S7), which provides a mechanistic explanation for the maintenance of discrete cell type identities. Interestingly, the most cell type-specific TFs we found were often previously observed to fuel direct conversion of cells into that cell type (Caiazzo et al., 2015; Elcheva et al., 2014; Hegde et al., 1999; Pang et al., 2011; Vierbuchen et al., 2010; Yang et al., 2013). We found that D2-MSN-specific TF identified here first, Sp9, disrupted D1-MSN-specific gene expression, further confirming the functional relevance of these cell type-specific TFs (Figure S6).
Finally, we observed that neurons contribute to the brain’s uniquely high level alternative splicing more than any other cell type (Grosso et al., 2008; Yeo et al., 2005). We found that neurons express more specific splice factors, and that the overall complexity of alternative splicing is higher in neurons than in other cell types. For many sites of alternative splicing, we detected both variants in each neuron (compound splice sites), revealing an alternative splicing machinery that can increase the diversity of the transcriptome by altering alternative splicing ratios.
Our results show that the phenotypic diversity of striatal neurons arises from a small number of discrete subtypes, within which neurons lie on a continuum of gene expression states. Our analysis methods distinguish between discrete subtypes (with transitioning intermediates when the cells are actively differentiating) and continuous heterogeneity. These distinctions may prove fundamental to understanding the phenotypic diversity of the cells that form complex tissues.
EXPERIMENTAL PROCEDURES
Animals
All procedures conformed to the NIH Guidelines for the Care and Use of Laboratory Animals and were approved by the Stanford University Administrative Panel on Laboratory Animal Care.
Single-Cell Transcriptional Profiling
Acute brain slices were cut from 5-7 weeks old male mouse and after papain treatment dissociated mechanically (SI Methods). Live cells were purified by either magnetic bead-activated cell sorting (MACS;Miltenyi Biotec) or by fluorescence-activated cell sorting (FACS). For cell type specific isolation genetically labeled MSN subtypes D1-, D2-MSN, and astrocytes were purified by FACS. Single cells were captured on a microfluidic chip on the C1 system (Fluidigm) and whole-transcriptome amplified cDNA was prepared on chip using theSMARTer Ultra LowRNAkit for Illumina (Clontech). For smart-seq2 protocol, three MSN populations (D1-MSN tdTom+, D1-MSN GFP+ and tdTom+/GFP+ MSNs) sorted individually into 96 well plates with lysis buffer and spun down and frozen at −80°C and amplified using the protocol as described previously (Picelli et al., 2013). Single-cell libraries were constructed as described previously (Treutlein et al., 2014b) (SI Methods).
Immunohistochemistry
Vibratome sections from perfusion-fixed mouse brains were stained with antibody for GFP (Rockland) and immunofluorescence imaging done on an Olympus fluorescent microscope or Nikon confocal microscope.
Supplementary Material
Highlights.
Transcriptomes of 1208 single striatal cells
Description of previously-unknown medium spiny neuron subtypes
Discrete cell types exist in a continuous spectrum of transcriptional states
Neurons have the largest transcriptome and more complex splicing patterns
Acknowledgements
We would like to thank all members of the Quake and Südhof laboratories for helpful discussions and Ben Barres for providing Aldhl1-GFP mice. This work was supported by grants from the NIDA (K99DA038112 to OG), the NIH (R37MH52804 to TCS), and the Brain and Behavior Research Foundation to OG.
Footnotes
Accession Numbers The accession number for the single cell sequencing raw data reported in this paper is GEO: GSE82187.
Author Contributions O.G., G.S, B.T., T.C.S. and S.R.Q. designed the study. O.G., G.S, B.T. and N.F.N. performed the experiments. O.G., G.S and B.T., analyzed datasets. T.C.S and S.R.Q provided intellectual guidance in the interpretation of the data. P.E.R., R.C.M., and M.V.F. provided reagents. O.G., G.S, B.T., G.J.C., T.C.S. and S.R.Q. wrote the manuscript.
Publisher's Disclaimer: This is a PDF file of an unedited manuscript that has been accepted for publication. As a service to our customers we are providing this early version of the manuscript. The manuscript will undergo copyediting, typesetting, and review of the resulting proof before it is published in its final citable form. Please note that during the production process errors may be discovered which could affect the content, and all legal disclaimers that apply to the journal pertain.
REFERENCES
- Ade KK, Wan Y, Chen M, Gloss B, Calakos N. An Improved BAC Transgenic Fluorescent Reporter Line for Sensitive and Specific Identification of Striatonigral Medium Spiny Neurons. Front. Syst. Neurosci. 2011;5:32. doi: 10.3389/fnsys.2011.00032. [DOI] [PMC free article] [PubMed] [Google Scholar]
- Aguirre A, Rubio ME, Gallo V. Notch and EGFR pathway interaction regulates neural stem cell number and self-renewal. Nature. 2010;467:323–327. doi: 10.1038/nature09347. [DOI] [PMC free article] [PubMed] [Google Scholar]
- Amiral J, Wolf M, Fischer A, Boyer Neumann C, Vissac A, Meyer D. Pathogenicity of IgA and/or IgM antibodies to heparin–PF4 complexes in patients with heparin induced thrombocytopenia. Br. J. Haematol. 1996;92:954–959. doi: 10.1046/j.1365-2141.1996.407945.x. [DOI] [PubMed] [Google Scholar]
- Au PYB, You J, Caluseriu O, Schwartzentruber J, Majewski J, Bernier FP, Ferguson M, Valle D, Parboosingh JS, Sobreira N, et al. GeneMatcher Aids in the Identification of a New Malformation Syndrome with Intellectual Disability, Unique Facial Dysmorphisms, and Skeletal and Connective Tissue Abnormalities Caused by De Novo Variants in HNRNPK. Hum. Mutat. 2015;36:1009–1014. doi: 10.1002/humu.22837. [DOI] [PMC free article] [PubMed] [Google Scholar]
- Bertran-Gonzalez J. What is the degree of segregation between striatonigral and striatopallidal projections? Front. Neuroanat. 2010;4:1–9. doi: 10.3389/fnana.2010.00136. [DOI] [PMC free article] [PubMed] [Google Scholar]
- Blaine S, Claus E, Harlaar N, Hutchison K. TACR1 Genotypes Predict fMRI Response to Alcohol Cues and Level of Alcohol Dependence. Alcohol. Clin. Exp. Res. 2013;37 doi: 10.1111/j.1530-0277.2012.01923.x. [DOI] [PMC free article] [PubMed] [Google Scholar]
- Caiazzo M, Giannelli S, Valente P, Lignani G, Carissimo A, Sessa A, Colasante G, Bartolomeo R, Massimino L, Ferroni S, et al. Direct Conversion of Fibroblasts into Functional Astrocytes by Defined Transcription Factors. Stem Cell Reports. 2015;4:25–36. doi: 10.1016/j.stemcr.2014.12.002. [DOI] [PMC free article] [PubMed] [Google Scholar]
- Calabresi P, Picconi B, Tozzi A, Ghiglieri V, Di Filippo M. Direct and indirect pathways of basal ganglia: a critical reappraisal. Nat. Neurosci. 2014;17:1022–1030. doi: 10.1038/nn.3743. [DOI] [PubMed] [Google Scholar]
- Crittenden JR, Graybiel AM. Basal Ganglia disorders associated with imbalances in the striatal striosome and matrix compartments. Front. Neuroanat. 2011;5:59. doi: 10.3389/fnana.2011.00059. [DOI] [PMC free article] [PubMed] [Google Scholar]
- Cui G, Jun SB, Jin X, Pham MD, Vogel SS, Lovinger DM, Costa RM. Concurrent activation of striatal direct and indirect pathways during action initiation. Nature. 2013;494:238–242. doi: 10.1038/nature11846. [DOI] [PMC free article] [PubMed] [Google Scholar]
- Darmanis S, Sloan S. a., Zhang Y, Enge M, Caneda C, Shuer LM, Hayden Gephart MG, Barres B. a., Quake SR. A survey of human brain transcriptome diversity at the single cell level. Proc. Natl. Acad. Sci. 2015 doi: 10.1073/pnas.1507125112. 201507125. [DOI] [PMC free article] [PubMed] [Google Scholar]
- Delong M, Wichmann T. Update on models of basal ganglia function and dysfunction. Parkinsonism Relat. Disord. 2009;15(Suppl 3):S237–S240. doi: 10.1016/S1353-8020(09)70822-3. [DOI] [PMC free article] [PubMed] [Google Scholar]
- Doetsch F, Caille I, Lim DA, Garcı JM, Alvarez-buylla A. Subventricular Zone Astrocytes Are Neural Stem Cells in the Adult Mammalian Brain. 1999;97:703–716. doi: 10.1016/s0092-8674(00)80783-7. [DOI] [PubMed] [Google Scholar]
- Ehrman LA, Mu X, Waclaw RR, Yoshida Y, Vorhees CV, Klein WH, Campbell K. The LIM homeobox gene Isl1 is required for the correct development of the striatonigral pathway in the mouse. Proc. Natl. Acad. Sci. U. S. A. 2013:1–10. doi: 10.1073/pnas.1308275110. [DOI] [PMC free article] [PubMed] [Google Scholar]
- Elcheva I, Brok-Volchanskaya V, Kumar A, Liu P, Lee J-H, Tong L, Vodyanik M, Swanson S, Stewart R, Kyba M, et al. Direct induction of haematoendothelial programs in human pluripotent stem cells by transcriptional regulators. Nat. Commun. 2014;5:4372. doi: 10.1038/ncomms5372. [DOI] [PMC free article] [PubMed] [Google Scholar]
- Etienne-manneville S, Hall A. Cdc42 regulates GSK-3 b and adenomatous polyposis coli to control cell polarity. 2003;421:753–756. doi: 10.1038/nature01423. [DOI] [PubMed] [Google Scholar]
- Feng J, Shao N, Szulwach KE, Vialou V, Huynh J, Zhong C, Le T, Ferguson D, Cahill ME, Li Y, et al. Role of Tet1 and 5-hydroxymethylcytosine in cocaine action. Nat. Neurosci. 2015;18:536–544. doi: 10.1038/nn.3976. [DOI] [PMC free article] [PubMed] [Google Scholar]
- Frederick a L., Yano H, Trifilieff P, Vishwasrao HD, Biezonski D, Mészáros J, Urizar E, Sibley DR, Kellendonk C, Sonntag KC, et al. Evidence against dopamine D1/D2 receptor heteromers. Mol. Psychiatry. 2015:1–13. doi: 10.1038/mp.2014.166. [DOI] [PMC free article] [PubMed] [Google Scholar]
- Fuccillo MV, Földy C, Gökce Ö, Rothwell PE, Sun GL, Malenka RC, Südhof TC. Single-Cell mRNA Profiling Reveals Cell-Type-Specific Expression of Neurexin Isoforms. Neuron. 2015;87:326–340. doi: 10.1016/j.neuron.2015.06.028. [DOI] [PMC free article] [PubMed] [Google Scholar]
- Gehman LT, Meera P, Stoilov P, Shiue L, O’Brien JE, Meisler MH, Ares M, Otis TS, Black DL. The splicing regulator Rbfox2 is required for both cerebellar development and mature motor function. Genes Dev. 2012;26:445–460. doi: 10.1101/gad.182477.111. [DOI] [PMC free article] [PubMed] [Google Scholar]
- Grosso AR, Gomes AQ, Barbosa-Morais NL, Caldeira S, Thorne NP, Grech G, von Lindern M, Carmo-Fonseca M. Tissue-specific splicing factor gene expression signatures. Nucleic Acids Res. 2008;36:4823–4832. doi: 10.1093/nar/gkn463. [DOI] [PMC free article] [PubMed] [Google Scholar]
- Grün D, Lyubimova A, Kester L, Wiebrands K, Basak O, Sasaki N, Clevers H, van Oudenaarden A. Single-cell messenger RNA sequencing reveals rare intestinal cell types. Nature. 2015 doi: 10.1038/nature14966. [DOI] [PubMed] [Google Scholar]
- Hegde SP, Zhao J, Ashmun R. a, Shapiro LH. c-Maf induces monocytic differentiation and apoptosis in bipotent myeloid progenitors. Blood. 1999;94:1578–1589. [PubMed] [Google Scholar]
- Heiman M, Schaefer A, Gong S, Peterson JD, Day M, Ramsey KE, Suárez-Fariñas M, Schwarz C, Stephan DA, Surmeier DJ, et al. A translational profiling approach for the molecular characterization of CNS cell types. Cell. 2008;135:738–748. doi: 10.1016/j.cell.2008.10.028. [DOI] [PMC free article] [PubMed] [Google Scholar]
- Heintz N. Gene Expression Nervous System Atlas (GENSAT) Nat Neurosci. 2004;7:483. doi: 10.1038/nn0504-483. [DOI] [PubMed] [Google Scholar]
- Heinzen EL, Arzimanoglou A, Brashear A, Clapcote SJ, Gurrieri F, Goldstein DB, Jóhannesson SH, Mikati M. a., Neville B, Nicole S, et al. Distinct neurological disorders with ATP1A3 mutations. Lancet Neurol. 2014;13:503–514. doi: 10.1016/S1474-4422(14)70011-0. [DOI] [PMC free article] [PubMed] [Google Scholar]
- Hochstim C, Deneen B, Lukaszewicz A, Zhou Q, Anderson DJ. Identification of Positionally Distinct Astrocyte Subtypes whose Identities Are Specified by a Homeodomain Code. Cell. 2008;133:510–522. doi: 10.1016/j.cell.2008.02.046. [DOI] [PMC free article] [PubMed] [Google Scholar]
- Iijima T, Iijima Y, Witte H, Scheiffele P. Neuronal cell type-specific alternative splicing is regulated by the KH domain protein SLM1. J. Cell Biol. 2014;204:331–342. doi: 10.1083/jcb.201310136. [DOI] [PMC free article] [PubMed] [Google Scholar]
- Jaitin DA, Kenigsberg E, Keren-Shaul H, Elefant N, Paul F, Zaretsky I, Mildner A, Cohen N, Jung S, Tanay A, et al. Massively parallel single-cell RNA-seq for marker-free decomposition of tissues into cell types. Science. 2014;343:776–779. doi: 10.1126/science.1247651. [DOI] [PMC free article] [PubMed] [Google Scholar]
- Kakiuchi C, Iwamoto K, Ishiwata M, Bundo M, Kasahara T, Kusumi I, Tsujita T, Okazaki Y, Nanko S, Kunugi H, et al. Impaired feedback regulation of XBP1 as a genetic risk factor for bipolar disorder. Nat. Genet. 2003;35:171–175. doi: 10.1038/ng1235. [DOI] [PubMed] [Google Scholar]
- Kharchenko PV, Silberstein L, Scadden DT. Bayesian approach to single-cell differential expression analysis. Nat. Methods. 2014;11:740–742. doi: 10.1038/nmeth.2967. [DOI] [PMC free article] [PubMed] [Google Scholar]
- Kreitzer AC, Malenka RC. Striatal plasticity and basal ganglia circuit function. Neuron. 2008;60:543–554. doi: 10.1016/j.neuron.2008.11.005. [DOI] [PMC free article] [PubMed] [Google Scholar]
- Kupchik YM, Brown RM, Heinsbroek JA, Lobo MK, Schwartz DJ, Kalivas PW. Coding the direct/indirect pathways by D1 and D2 receptors is not valid for accumbens projections. Nat Neurosci. 2015;18:1230–1232. doi: 10.1038/nn.4068. [DOI] [PMC free article] [PubMed] [Google Scholar]
- Ladd AN. CUG-BP, Elav-like family (CELF)-mediated alternative splicing regulation in the brain during health and disease. Mol. Cell. Neurosci. 2013;56:456–464. doi: 10.1016/j.mcn.2012.12.003. [DOI] [PMC free article] [PubMed] [Google Scholar]
- Li Q, Lee J-A, Black DL. Neuronal regulation of alternative premRNA splicing. Nat. Rev. Neurosci. 2007;8:819–831. doi: 10.1038/nrn2237. [DOI] [PubMed] [Google Scholar]
- Lobo MK, Karsten SL, Gray M, Geschwind DH, Yang XW. FACS-array profiling of striatal projection neuron subtypes in juvenile and adult mouse brains. Nat. Neurosci. 2006;9:443–452. doi: 10.1038/nn1654. [DOI] [PubMed] [Google Scholar]
- Maaten L. Van Der, Hinton G, van der Maaten L,HG. Visualizing data using t-SNE. J. Mach. Learn. Res. 2008;9:2579–2605. [Google Scholar]
- Maia TV, Frank MJ. From reinforcement learning models to psychiatric and neurological disorders. Nat. Neurosci. 2011;14:154–162. doi: 10.1038/nn.2723. [DOI] [PMC free article] [PubMed] [Google Scholar]
- Matthias K, Kirchhoff F, Seifert G, Hüttmann K, Matyash M, Kettenmann H, Steinhäuser C. Segregated expression of AMPA-type glutamate receptors and glutamate transporters defines distinct astrocyte populations in the mouse hippocampus. J. Neurosci. 2003;23:1750–1758. doi: 10.1523/JNEUROSCI.23-05-01750.2003. [DOI] [PMC free article] [PubMed] [Google Scholar]
- Mühleisen TW, Leber M, Schulze TG, Strohmaier J, Degenhardt F, Treutlein J, Mattheisen M, Forstner AJ, Schumacher J, Breuer R, et al. Genome-wide association study reveals two new risk loci for bipolar disorder. Nat. Commun. 2014;5:3339. doi: 10.1038/ncomms4339. [DOI] [PubMed] [Google Scholar]
- Nelson AB, Kreitzer AC. Reassessing models of Basal Ganglia function and dysfunction. Annu. Rev. Neurosci. 2014;37:117–135. doi: 10.1146/annurev-neuro-071013-013916. [DOI] [PMC free article] [PubMed] [Google Scholar]
- Noureddine MA, Qin XJ, Oliveira SA, Skelly TJ, van der Walt J, Hauser MA, Pericak-Vance MA, Vance JM, Li YJ. Association between the neuron-specific RNA-binding protein ELAVL4 and Parkinson disease. Hum. Genet. 2005;117:27–33. doi: 10.1007/s00439-005-1259-2. [DOI] [PubMed] [Google Scholar]
- O’Doherty J, Dayan P, Schultz J, Deichmann R, Friston K, Dolan RJ. Dissociable Roles of Ventral and Dorsal Striatum in Instrumental Conditioning. Sci. 2004;304:452–454. doi: 10.1126/science.1094285. [DOI] [PubMed] [Google Scholar]
- Pang ZP, Yang N, Vierbuchen T, Ostermeier A, Fuentes DR, Yang TQ, Citri A, Sebastiano V, Marro S, Südhof TC, et al. Induction of human neuronal cells by defined transcription factors. Nature. 2011;476:220–223. doi: 10.1038/nature10202. [DOI] [PMC free article] [PubMed] [Google Scholar]
- Pannasch U, Freche D, Dallérac G, Ghézali G, Escartin C, Ezan P, Cohen-Salmon M, Benchenane K, Abudara V, Dufour A, et al. Connexin 30 sets synaptic strength by controlling astroglial synapse invasion. Nat. Neurosci. 2014;17:549–558. doi: 10.1038/nn.3662. [DOI] [PubMed] [Google Scholar]
- Picelli S, Björklund ÅK, Faridani OR, Sagasser S, Winberg G, Sandberg R. Smart-seq2 for sensitive full-length transcriptome profiling in single cells. Nat. Methods. 2013;10:1096–1098. doi: 10.1038/nmeth.2639. [DOI] [PubMed] [Google Scholar]
- Pollen A. a, Nowakowski TJ, Shuga J, Wang X, Leyrat A. a, Lui JH, Li N, Szpankowski L, Fowler B, Chen P, et al. Low-coverage single-cell mRNA sequencing reveals cellular heterogeneity and activated signaling pathways in developing cerebral cortex. Nat. Biotechnol. 2014 doi: 10.1038/nbt.2967. [DOI] [PMC free article] [PubMed] [Google Scholar]
- Redies C, Hertel N, Hubner CA. Cadherins and neuropsychiatric disorders. Brain Res. 2012;1470:130–144. doi: 10.1016/j.brainres.2012.06.020. [DOI] [PubMed] [Google Scholar]
- Robison AJ, Nestler EJ. Transcriptional and epigenetic mechanisms of addiction. Nat Rev Neurosci. 2011;12:623–637. doi: 10.1038/nrn3111. [DOI] [PMC free article] [PubMed] [Google Scholar]
- Rouach N, Koulakoff A, Abudara V, Willecke K, Giaume C. Astroglial metabolic networks sustain hippocampal synaptic transmission. Science. 2008;322:1551–1555. doi: 10.1126/science.1164022. [DOI] [PubMed] [Google Scholar]
- De Rubeis S, He X, Goldberg AP, Poultney CS, Samocha K, Ercument Cicek a., Kou Y, Liu L, Fromer M, Walker S, et al. Synaptic, transcriptional and chromatin genes disrupted in autism. Nature. 2014;3:209–215. doi: 10.1038/nature13772. [DOI] [PMC free article] [PubMed] [Google Scholar]
- Sanders SJ, Murtha MT, Gupta AR, Murdoch JD, Raubeson MJ, Willsey AJ, Ercan-Sencicek AG, DiLullo NM, Parikshak NN, Stein JL, et al. De novo mutations revealed by whole-exome sequencing are strongly associated with autism. Nature. 2012;485:237–241. doi: 10.1038/nature10945. [DOI] [PMC free article] [PubMed] [Google Scholar]
- Satoh J, Kino Y, Asahina N, Takitani M, Miyoshi J, Ishida T, Saito Y. TMEM119 marks a subset of microglia in the human brain. Neuropathology. 2015 doi: 10.1111/neup.12235. n/a – n/a. [DOI] [PubMed] [Google Scholar]
- Shalek AK, Satija R, Adiconis X, Gertner RS, Gaublomme JT, Raychowdhury R, Schwartz S, Yosef N, Malboeuf C, Lu D, et al. Single-cell transcriptomics reveals bimodality in expression and splicing in immune cells. Nature. 2013;498:236–240. doi: 10.1038/nature12172. [DOI] [PMC free article] [PubMed] [Google Scholar]
- Shuen J. a, Chen M, Gloss B, Calakos N. Drd1a-tdTomato BAC transgenic mice for simultaneous visualization of medium spiny neurons in the direct and indirect pathways of the basal ganglia. J. Neurosci. 2008;28:2681–2685. doi: 10.1523/JNEUROSCI.5492-07.2008. [DOI] [PMC free article] [PubMed] [Google Scholar]
- Steinhoff MS, von Mentzer B, Geppetti P, Pothoulakis C, Bunnett NW. Tachykinins and Their Receptors: Contributions to Physiological Control and the Mechanisms of Disease. Physiol. Rev. 2014;94:265–301. doi: 10.1152/physrev.00031.2013. [DOI] [PMC free article] [PubMed] [Google Scholar]
- Südhof TC. Neuroligins and neurexins link synaptic function to cognitive disease. Nature. 2008;455:903–911. doi: 10.1038/nature07456. [DOI] [PMC free article] [PubMed] [Google Scholar]
- Surmeier DJ, Yan Z, Song WJ. Coordinated Expression of Dopamine Receptors in Neostriatal Medium Spiny Neurons. Adv. Pharmacol. 1997;42:1020–1023. doi: 10.1016/s1054-3589(08)60921-7. [DOI] [PubMed] [Google Scholar]
- Tasic B, Menon V, Nguyen T, Kim T, Levi B, Yao Z, Lee C, Shapovalova N, Parry S, Madisen L, et al. Adult cortical cell taxonomy by single cell transcriptomics. Nat. Neurosci. 2016 doi: 10.1038/nn.4216. [DOI] [PMC free article] [PubMed] [Google Scholar]
- Todorov V, Filzmoser P. An Object-Oriented Framework for Robust Multivariate Analysis. J. Stat. Softw. 2009;32:1–47. [Google Scholar]
- Treutlein B, Gokce O, Quake SR, Südhof TC. Cartography of neurexin alternative splicing mapped by single-molecule long-read mRNA sequencing. Proc. Natl. Acad. Sci. U. S. A. 2014a;111:E1291–E1299. doi: 10.1073/pnas.1403244111. [DOI] [PMC free article] [PubMed] [Google Scholar]
- Treutlein B, Brownfield DG, Wu AR, Neff NF, Mantalas GL, Espinoza FH, Desai TJ, Krasnow M. a, Quake SR. Reconstructing lineage hierarchies of the distal lung epithelium using single-cell RNA-seq. Nature. 2014b doi: 10.1038/nature13173. [DOI] [PMC free article] [PubMed] [Google Scholar]
- Usoskin D, Furlan A, Islam S, Abdo H, Lönnerberg P, Lou D, Hjerling-Leffler J, Haeggström J, Kharchenko O, Kharchenko PV, et al. Unbiased classification of sensory neuron types by large-scale single-cell RNA sequencing. Nat. Neurosci. 2014 doi: 10.1038/nn.3881. [DOI] [PubMed] [Google Scholar]
- Vierbuchen T, Ostermeier A, Pang ZP, Kokubu Y, Südhof TC, Wernig M. Direct conversion of fibroblasts to functional neurons by defined factors. Nature. 2010;463:1035–1041. doi: 10.1038/nature08797. [DOI] [PMC free article] [PubMed] [Google Scholar]
- Yang N, Zuchero JB, Ahlenius H, Marro S, Ng YH, Vierbuchen T, Hawkins JS, Geissler R, Barres B. a, Wernig M. Generation of oligodendroglial cells by direct lineage conversion. Nat. Biotechnol. 2013;31:434–439. doi: 10.1038/nbt.2564. [DOI] [PMC free article] [PubMed] [Google Scholar]
- Yeo GW, Yeo GW, Van Nostrand E, Van Nostrand E, Holste D, Holste D, Poggio T, Poggio T, Burge CB, Burge CB. Identification and analysis of alternative splicing events conserved in human and mouse. Proc. Natl. Acad. Sci. U. S. A. 2005;102:2850–2855. doi: 10.1073/pnas.0409742102. [DOI] [PMC free article] [PubMed] [Google Scholar]
- Zeisel A, Manchado ABM, Codeluppi S, Lönnerberg P, Manno G. La, Juréus A, Marques S, Munoz-Manchado AB, Codeluppi S, Lonnerberg P, et al. Cell types in the mouse cortex and hippocampus revealed by single-cell RNA-seq. Science. 2015a;25(80):1138–1142. doi: 10.1126/science.aaa1934. [DOI] [PubMed] [Google Scholar]
- Zeisel A, Munoz-Manchado AB, Codeluppi S, Lonnerberg P, La Manno G, Jureus A, Marques S, Munguba H, He L, Betsholtz C, et al. Cell types in the mouse cortex and hippocampus revealed by single-cell RNA-seq. Science. 2015b;347(80):1138–1142. doi: 10.1126/science.aaa1934. [DOI] [PubMed] [Google Scholar]
- Zhang Y, Chen K, Sloan S. a, Bennett ML, Scholze AR, O’Keeffe S, Phatnani HP, Guarnieri P, Caneda C, Ruderisch N, et al. An RNA-Sequencing Transcriptome and Splicing Database of Glia, Neurons, and Vascular Cells of the Cerebral Cortex. J. Neurosci. 2014;34:11929–11947. doi: 10.1523/JNEUROSCI.1860-14.2014. [DOI] [PMC free article] [PubMed] [Google Scholar]
- Zlojutro M, Manz N, Rangaswamy M, Xuei X, Flury-Wetherill L, Koller D, Bierut LJ, Goate A, Hesselbrock V, Kuperman S, et al. Genome-wide association study of theta band event-related oscillations identifies serotonin receptor gene HTR7 influencing risk of alcohol dependence. Am. J. Med. Genet. Part B Neuropsychiatr. Genet. 2011;156:44–58. doi: 10.1002/ajmg.b.31136. [DOI] [PMC free article] [PubMed] [Google Scholar]
Associated Data
This section collects any data citations, data availability statements, or supplementary materials included in this article.