
Figure 2.
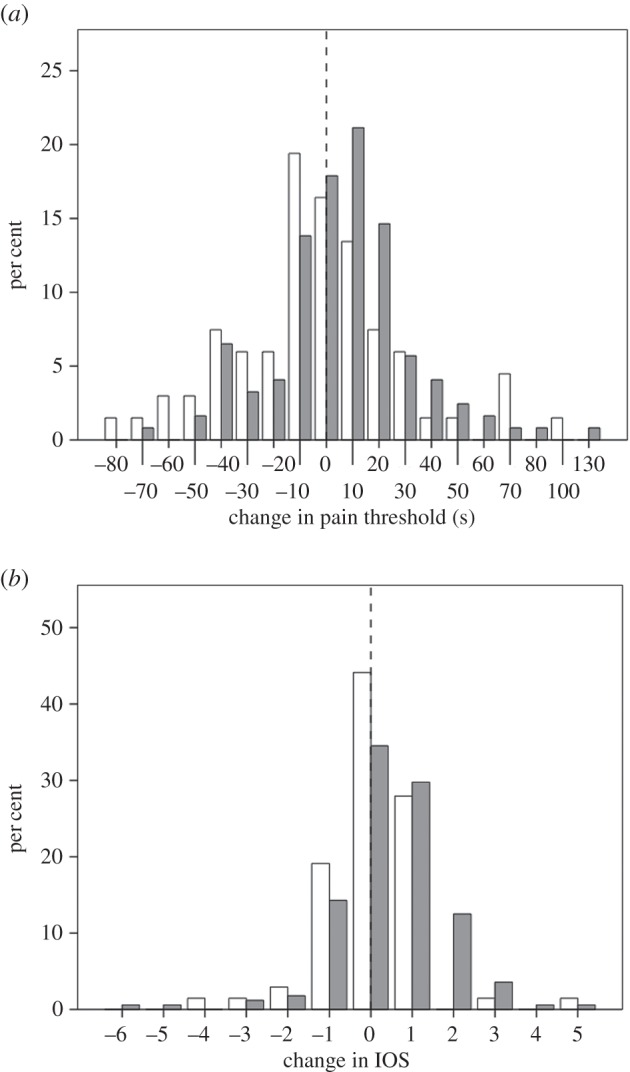
Frequency distribution of (a) change in pain threshold (after-minus-before duration for wall-sit task, in seconds) and (b) change in IOS rating for experimental (grey bars) and control (white bars) participants. The dashed vertical line indicates 0 (no change).