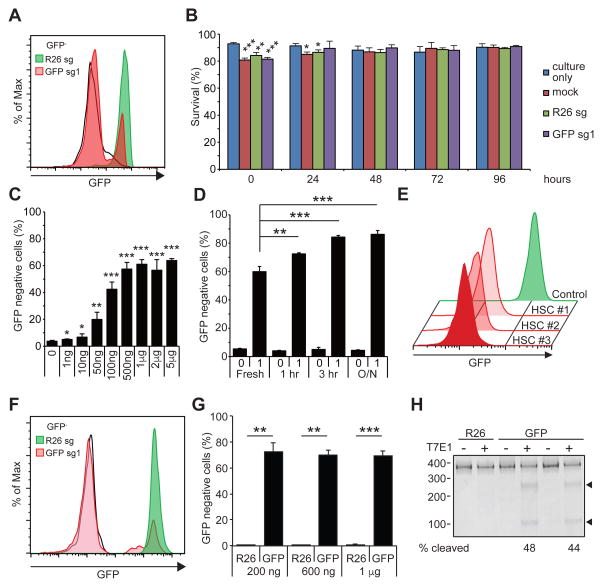
Figure 1. Gene editing in murine HSPCs.
(A) A representative flow cytometry histogram showing efficient ablation of GFP by electroporating GFP-sg1 into Cas9-expressing HSPCs. Black histogram represents GFP− HSPCs, and green and red histograms represents Rosa26 (R26) and GFP disrupted HSPCs, respectively (n=3). (B) Survival of HSPCs was determined by trypan blue staining of cells cultured without electroporation, cells mock electroporated without sgRNA, and cells electroporated with R26 or GFP sgRNA. 1 μg of sgRNA was used to electroporate 105 cells (n=3). (C) Deletion efficiencies of GFP exhibiting sgRNA dose-dependent response. A plateau in gene editing efficiency was reached by 1 μg of sgRNA per 105 cells (n=3). (D) A brief culture of murine HSPCs for 1 to 3 hours increased gene-editing frequency, while overnight (O/N) culture did not further increase gene editing (n=3). (E) After electroporating c-kit+ HSPCs with GFP-sg1, HSCs were sorted clonally into methylcellulose media. Most (40 out of 48) HSC colonies exhibited loss of GFP expression, as shown by the representative flow cytometric histograms for 3 HSC-derived colonies from one donor mouse (n=3 independent experiments). (F) A representative histogram demonstrating efficient ablation of GFP expression by electroporating Cas9/GFP-sg1 RNP into GFP expressing HSPCs (n=3). (G) Quantification of results in (F). Even as little as 200 ng of GFP-sg1 efficiently ablated GFP upon delivery with Cas9 protein (1 μg). (H) T7E1 assays performed with GFP amplicon derived from R26- or GFP-disrupted HSPCs. PCR amplicons were either treated (+) or untreated (−) with T7E1. Arrowheads indicate the bands with expected size assuming small indels, based on the Cas9 cleavage site. 1 μg of sgRNA was used to electroporate 105 Cas9-expressing cells unless otherwise noted. All data represent mean ± standard deviation; *, p<0.05; **, p<0.01; and ***, p<0.001 by Student’s t-test. See also Figure S1.

