
Fig. 2.
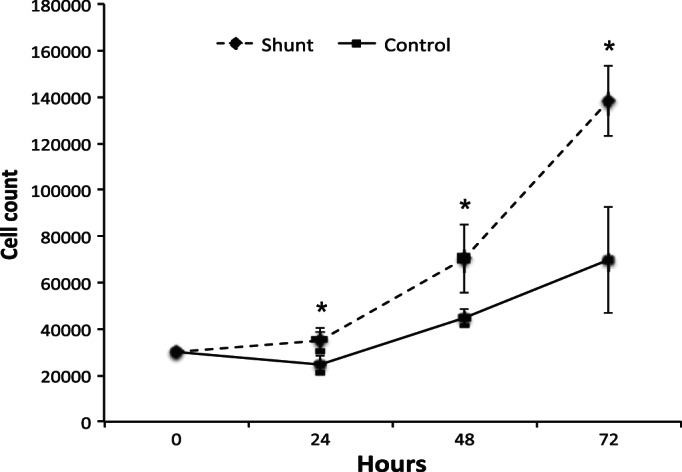
Proliferation of primary PASMCs derived from shunt animals compared with PASMCs from control animals under standard growth conditions. Cell proliferation assay comparing cell counts for primary PASMCs from shunt vs. control animals (n = 3 per group) at sequential 24-h time points. Error bars correspond to 1 SD. *Significance with P value < 0.05 by Student's t-test.