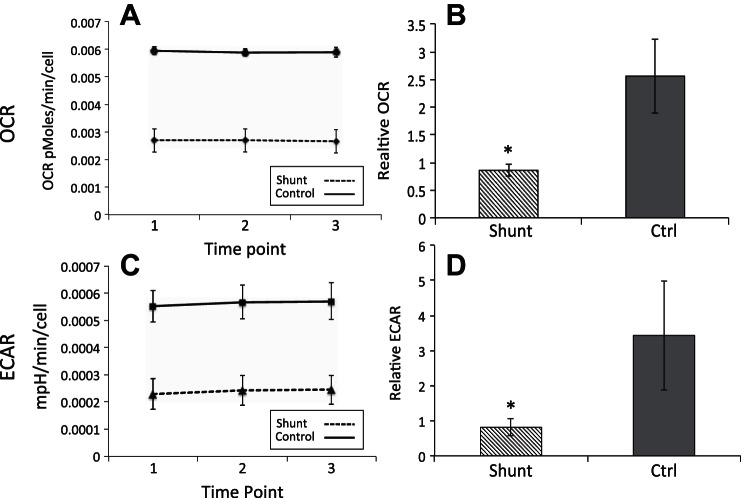
Fig. 3.
Primary PASMC metabolism in shunt vs. control cells. A: oxygen consumption rate (OCR) measurement under basal conditions with standard media comparing one shunt (dashed) and one control (solid) cell line from a single experiment. Error bars correspond to 1 SD. B: normalized oxygen consumption rate measurements comparing shunt and control (n = 3 per group) cell lines under basal conditions in standard media. Error bars correspond to 1 SD. *Significance with P value <0.001 by Welch's t-test. C: extracellular acidification rate (ECAR) measurement under basal conditions with standard media comparing one shunt (dashed) and one control (solid) cell line from a single experiment. Error bars correspond to 1 SD. D: normalized extracellular acidification rate measurements comparing shunt and control (n = 3 per group) cell lines under basal conditions in standard media. Error bars correspond to 1 SD. *Significance with P value <0.001 by Welch's t-test.

