

Abstract
Objective
To explore to what extent three-dimensional measures of the meniscus and femorotibial cartilage explain the variation in medial and lateral femorotibial radiographic joint space width (JSW), in healthy men and women.
Methods
The right knees of 87 Osteoarthritis Initiative healthy reference participants (no symptoms, radiographic signs or risk factors of osteoarthritis; 37 men, 50 women; age 55.0±7.6; BMI 24.4±3.1) were assessed. Quantitative measures of subregional femorotibial cartilage thickness and meniscal position and morphology were computed from segmented magnetic resonance images. Minimal and medial/lateral fixed-location JSW were determined from fixed-flexion radiographs. Correlation and regression analyses were used to explore the contribution of demographic, cartilage and meniscal parameters to JSW in healthy subjects.
Results
The correlation with (medial) minimal JSW was somewhat stronger for cartilage thickness (0.54≤r≤0.67) than for meniscal (−0.31≤r≤0.50) or demographic measures (−0.15≤r≤0.48), in particular in men. In women, in contrast, the strength of the correlations of cartilage thickness and meniscal measures with minimal JSW were in the same range. Fixed-location JSW measures showed stronger correlations with cartilage thickness (r≥0.68 medially; r≥0.59 laterally) than with meniscal measures (r≤|0.32| medially; r≤|0.32| laterally). Stepwise regression models revealed that meniscal measures added significant independent information to the total variance explained in minimal JSW (adjusted multiple r2=58%) but not in medial or lateral fixed-location JSW (r2=60/51%, respectively).
Conclusions
In healthy subjects, minimal JSW was observed to reflect a combination of cartilage and meniscal measures, particularly in women. Fixed-location JSW, in contrast, was found to be dominated by variance in cartilage thickness in both men and women, with somewhat higher correlations between cartilage and JSW in the medial than lateral femorotibial compartment. The significant contribution of the meniscus’ position on minimal JSW reinforces concerns over validity of JSW as an indirect measure of hyaline cartilage.
Keywords: knee, radiographic joint space width, meniscus, cartilage, healthy reference, magnetic resonance imaging (MRI)
Introduction
Medial minimum radiographic femorotibial joint space width (minimal JSW) is currently recommended by the Food and Drug Administration as the relevant outcome measure for evaluating the structural effect of disease-modifying osteoarthritis drugs (DMOADs) on knee osteoarthritis (KOA) progression [1]. Reduction of minimal JSW (or joint space narrowing) has been suggested to not only reflect cartilage thickness loss in KOA, but to result from a combined contribution of structural change in articular cartilage and the menisci [2–7].
To capture the relationship between radiographic JSW measures and the actual three-dimensional (3D) shape of cartilage and menisci, measurement technologies for the 3D, quantitative analysis of subregional cartilage thickness in the medial and lateral femorotibial joint [8] and for the 3D analysis of the meniscal morphology and position [9] have been developed. Further, reference data of cartilage thickness and meniscal morphology and position have been provided based on these techniques in healthy men and women [10,11].
When comparing knees with medial radiographic Osteoarthritis Research Society International [12] joint space narrowing to contralateral knees that did not exhibit joint space narrowing, it was found that 3D measures of the menisci and cartilage each provided independent information to explain side differences in JSW, and that about two thirds of these differences could be explained by a combination of quantitative cartilage and meniscal measures [5]. However, no study has previously investigated to what extent fully quantitative 3D measures of subregional cartilage thickness and the menisci contribute to explain the variance observed in normal radiographic JSW in healthy men and women without KOA. Yet, appreciating the specific contributions of each tissue in healthy reference subjects is essential for a thorough understanding of the relationship of these tissues with JSW in KOA progression, as well as for understanding the effect of DMOADs on radiographic JSW at various disease stages.
Further, fixed-location measures of JSW have recently been proposed as an alternative to measuring minimal JSW [13], with these being available for both the medial and lateral femorotibial compartment. In comparison with (medial) minimal JSW, fixed-location JSW measured in the central (x=22.5%, Fig. 1) medial femorotibial compartment has been shown to be more sensitive to change in KOA than minimal JSW [14–16] and to better predict knee replacement than minimal JSW [17]. Yet, it is unknown to what extent the relationship between 3D subregional cartilage thickness, meniscal measures and radiographic JSW varies between minimal JSW and medial and lateral fixed-location JSWs in healthy joints.
Fig. 1. Radiographic joint space width.

Fixed-flexion radiograph depicting the medial to lateral coordinate system used for fixed-location measurements (medfJSW: medial fixed joint space width at 22.5%, latfJSW: lateral fixed joint space width at 80%), as well as the minimal medial joint space width (mJSW).
The aim of the current study was therefore to explore comprehensively the relative contributions of 3D morphological and positional meniscal measures and cartilage thickness measures to minimal JSW, to medial and to lateral fixed-location JSW in normal, non-osteoarthritic male and female knees.
Material and methods
The Osteoarthritis Initiative healthy reference cohort
The Osteoarthritis Initiative (OAI) is a multicentre, prospective observational cohort study of 4,796 subjects, designed to identify biomarkers and risk factors for KOA incidence and progression [18]. The OAI was approved by the institutional review board for the University of California, San Francisco and its affiliates (approval nr. H5254-20499-09), with all participants providing informed consent prior to participation. The current study used the non-exposed reference cohort of the OAI that encompassed 122 participants. These were required to have: (i) no history of pain, aching or stiffness in either knee; (ii) no radiographic femorotibial KOA in the readings performed at the four clinical sites; (iii) no rheumatoid or inflammatory arthritis; and (iv) no risk factors for KOA, specifically obesity, history of knee injury or knee surgery, family history of total knee replacement, hand OA, or repetitive knee bending at work or during other daily activities [10,18]. Of the 122 healthy reference cohort participants, 23 were later found to have a Kellgren-Lawrence Grade (KLG) >0 in ≥1 knee based on central radiographic readings [19], and were therefore excluded from the current study. Twelve other participants could not be included due to lacking JSW measurements (n=1), insufficient image quality for meniscal segmentation (n=4), or lack of cartilage segmentation on the baseline magnetic resonance (MR) images (n=7) [10]. Hence, a total of 87 participants from the OAI healthy reference cohort were studied.
Quantitative joint space width (JSW) measurements
All OAI participants underwent weight-bearing, posterioanterior fixed-flexion (10°) radiographs at each annual visit [18] (see OAI protocol: http://oai.epi-ucsf.org/). In the majority of those, semi-automated radiographic JSW measurements were performed and made publically available using validated software [14,15] (release 0.6, Fig. 1). In addition to medial compartment minimal JSW, radiographic JSW was also assessed at fixed locations in both the medial and the lateral compartment, based on a range from X=0% to X=100% of the mediolateral width of the distal femur [14]. For the current study, baseline minimal JSW and fixed-location measures in the centre of the medial (X=22.5%) and lateral compartment (X=80%) were selected as outcome measures, as these were previously shown to display a high sensitivity to change in KOA [15,16] (Fig. 1).
Quantitative cartilage thickness measurements
MR images of OAI participants were obtained using 3T MRI scanners (Siemens Magnetom Trio, Erlangen, Germany) with quadrature transmit-receive knee coils (USA Instruments, Aurora, OH) [18,20]. The OAI imaging protocol included sagittal double echo steady state sequences with water excitation (DESSwe) of both knees (0.7 mm slice thickness; 0.37 mm × 0.46 mm in-plane resolution [interpolated to 0.37 mm × .37 mm]) [20]. Additionally, coronal fast low angle shot images with water excitation (FLASHwe) were available for the right knees of all OAI participants (1.5 mm slice thickness; 0.31 mm × 0.31 mm in-plane resolution) [20].
Segmentation of the tibial and weight-bearing femoral cartilage and computation of the subregional mean cartilage thickness was previously performed using custom software (Chondrometrics GmbH, Ainring, Germany) using coronal FLASHwe MR images of the right knees acquired at baseline [10] as well as sagittal DESSwe MR images of the same knees (Fig. 2a). Briefly, the total subchondral bone area and the cartilage joint surface area of the medial and lateral tibia and the central (weight-bearing) part of the medial and lateral femoral condyle were manually traced by experienced readers and underwent quality control readings by one expert reader [10]. The central, weight-bearing part of the femoral condyles was defined as 75% of the distance between the trochlea notch and the posterior end of the condyles in the sagittal DESSwe, and as 60% of this distance in the coronal FLASHwe, where partial volume effect precluded the use of a larger femoral region of interest. The mean cartilage thickness over the entire subchondral bone area was computed from the segmentations after 3D surface reconstruction and included denuded areas as 0mm cartilage thickness. As described previously, the mean cartilage thickness was then computed for 16 (8 medial and 8 lateral) femorotibial subregions (Fig. 2b) [8,21].
Fig. 2. 3D analysis of cartilage thickness.
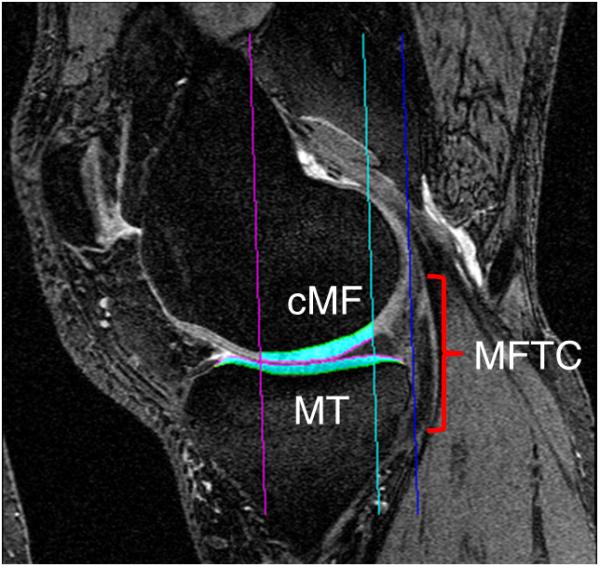


MR imaging based quantitative 3D analysis of the cartilage in the medial and lateral femorotibial compartment (MFTC/LFTC): (2a) sagittal MR image from a double echo steady state sequence with MFTC cartilage segmentation (cMF = central medial femur; MT = medial tibia); (2b) coronal MR image from a fast low-angle shot sequence with MFTC and LFTC cartilage segmentation (cLF = central lateral femur; LT = lateral tibia); (2c) 3D reconstruction of the tibial and weight-bearing femoral cartilage including subregions.
Quantitative meniscal measurements
Coronal multi-planar reconstructions were derived from the near isotropic sagittal DESSwe MR images (reconstructed slice thickness = 1.5mm; in-plane resolution 0.37mm × 0.7mm; interpolated to 0.37mm × 0.37mm), with the menisci of the right knees being segmented (K.E.) from the baseline coronal multi-planar reconstruction images as described previously [9,11]. Briefly, the medial and lateral tibial plateau area (i.e. the area of cartilage surface, including denuded areas of subchondral bone), and the surfaces of the medial and lateral meniscus (tibial, femoral and external area) were segmented [9,11] (Fig. 3a). Morphological meniscal measures included the mean and maximal meniscal thickness and the mean and maximal meniscal width (Fig. 3c). Positional meniscal measures relative to the tibial plateau included the percentage of tibial plateau covered by the meniscus, the percentage of the tibial meniscal surface not covering the tibial plateau, and the mean and maximal extrusion distance [9] (Fig. 3c). The above measures were also obtained for meniscal regions, specifically the anterior horn, the body, and the posterior horn [9] (Fig. 3b).
Fig. 3. 3D analysis of the menisci.


MR imaging based quantitative 3D analysis of the menisci in the medial and lateral compartment: (3a) coronal MR image from a double echo steady state sequence showing the segmentation of the medial (MM) and lateral (LM) meniscus; (3b) 3D model of the medial meniscus from anterior showing the three subregions (ACdAB = joint surface of the tibia, consisting of the area of the cartilage surface, and denuded areas of subchondral bone if applicable); (3c) 3D reconstruction of the medial meniscus depicting: ACdAB; the femoral (FA), tibial (TA), and external surface (EA) of the medial meniscus; meniscal thickness and width; overlap between TA and ACdAB (ACdAB.Cov), extrusion distance, and uncovered area of the TA (TA.Uncov).
Statistical analysis
Bivariate correlation coefficients (r, Pearson, two-sided) between the outcome parameters (minimal JSW, medial fixed-location JSW, lateral fixed-location JSW) and the independent variables (demographic, ipsi-compartmental cartilage thickness, and ipsi-compartmental meniscal measures) were assessed by applying the bootstrap method [22] (1000 replications, BCa method, simple sampling), in order to make the confidence intervals of the correlation coefficients more robust. Due to the exploratory nature of the present study, we did not apply any statistical tests to evaluate whether certain correlation coefficients were significantly different from others, except to explore whether correlations differed between men and women (Fisher's z-test). Partial correlations were calculated to reduce the number of independent parameters for modelling JSW by means of linear regression. Stepwise multiple linear regression analyses were eventually performed to predict minimal JSW / medial fixed-location JSW / lateral fixed-location JSW based on femorotibial compartment cartilage thickness, tibial cartilage thickness, central femoral cartilage thickness, percentage of tibial plateau covered by the meniscus, percentage of the tibial meniscal surface not covering the tibial plateau, mean meniscal extrusion, mean meniscal thickness, and mean meniscal width. As the relationship between JSW measures from healthy subjects and meniscal, as well as cartilage, measures may be mediated by age, body height, weight, or body mass index (BMI) [6,23] and as these relationships may potentially be sex-specific, the stepwise regression models were also based on age, height, BMI, and knee alignment, and were additionally stratified for sex.
Due to the multiplicity of the correlation analyses, P-values <0.01 were considered statistically significant. For regression analyses, P-values of <0.05 were considered significant. All statistical analyses were performed using SPSS 22 (IBM Corporation, Armonk, NY, USA).
Results
Descriptive statistics of demographic variables, JSW measures, quantitative cartilage thickness measures from the sagittal DESSwe, and meniscal measures appear in Table 1. Supplement Table 1 supplies descriptive statistics for subregional quantitative cartilage and meniscal measures. Of the 87 participants included in the study, six did not have lateral fixed-location JSW measures (no difference in demographics between participants with and without lateral fixed-location JSW measurements [unpaired t-test], Table 1). Because the cartilage thickness measures obtained from the FLASHwe MR images were very similar to those obtained from the DESSwe MR images, and because the correlations of JSW measures with cartilage thickness measures from the coronal FLASHwe (data not shown) were very similar to those obtained from the sagittal DESSwe, only the results from the DESSwe-based cartilage thickness measurements are reported (Table 2, Suppl. Table 2).
Table 1.
Descriptive statistics for demographics, joint space width, quantitative cartilage (overall) (from DESSwe) and meniscal (overall) measures in the full cohort and demographics for subjects with lateral joint space width measures (mean ± standard deviation).
| Total cohort (n=87) |
Subjects with latfJSW measures (n = 81) |
|
|---|---|---|
| Demographics | ||
| Sex [n] | ♂:50 / ♀: 37 | ♂:47 / ♀: 34 |
| BMI [kg/m2] | 24.4 ± 3.1 | 24.4 ± 3.2 |
| Height [cm] | 168 ± 87 | 168 ± 88 |
| Weight [kg] | 69.2 ± 12.0 | 69.1 ± 12.2 |
| Age [years] | 55.0 ± 7.6 | 55.1 ± 7.6 |
| Knee alignment [°] | −5.6 ± 1.7 | −5.6 ± 1.7 |
| Joint space width | ||
| mJSW [mm] | 4.77 ± 0.76 | |
| medfJSW [mm] | 5.66 ± 0.80 | |
| latfJSW [mm] | 6.75 ± 1.13 |
| Cartilage overall | Medial compartment (n=87) | Lateral compartment (n=81) |
|---|---|---|
| FTC.ThCtAB [mm] | 3.39 ± 0.51 | 3.88 ± 0.53 |
| T.ThCtAB [mm] | 1.61 ± 0.24 | 2.05 ± 0.32 |
| cF.ThCtAB [mm] | 1.78 ± 0.31 | 1.83 ± 0.27 |
| Meniscus overall | Medial meniscus | Lateral meniscus |
|---|---|---|
| ACdAB.Cov [%] | 49.65 ± 5.79 | 58.57 ± 6.15 |
| TA.Uncov [%] | 10.97 ± 4.50 | 5.27 ± 2.82 |
| Th.Me [mm] | 2.65 ± 0.34 | 2.55 ± 0.26 |
| Th.Max [mm] | 7.34 ± 1.16 | 6.86 ± 1.00 |
| Ex.Me [mm] | 1.47 ± 1.21 | −2.38 ± 1.17 |
| Ex.Max [mm] | 7.67 ± 1.71 | 7.87 ± 1.72 |
| Wid.Me [mm] | 9.48 ± 1.06 | 9.30 ± 1.27 |
| Wid.Max [mm] | 17.70 ± 2.23 | 13.30 ± 2.06 |
Abbreviations: BMI = body mass index; mJSW = minimal medial joint space width; medfJSW = medial fixed-location joint space width (at 22.5% of mediolateral femoral width); latfJSW = lateral fixed-location joint space width (at 80% of mediolateral femoral width); ThCtAB = mean cartilage thickness over the total subchondral bone area with denuded areas counting as 0mm thickness; FTC = femorotibial compartment; T = tibia; cF = central weight-bearing femur; ACdAB.Cov = percentage of tibial plateau covered by the meniscus; TA.Uncov = percentage of the tibial meniscal surface not covering the tibial plateau; Th.Me/Max = mean/maximal meniscal thickness; Ex.Me/Max = mean/maximal meniscal extrusion; Wid.Me/Max = mean/maximal meniscal width.
Table 2.
Correlations of minimal medial joint space width (mJSW), medial (medfJSW) and lateral (latfJSW) fixed-location joint space width with demographic, ipsi-compartmental quantitative cartilage (overall, from DESSwe) and ipsi-compartmental meniscal (overall) parameters in the full cohort and sex-specific. r: bivariate correlation coefficients (Pearson), CI: confidence interval (bootstrap 1000 replications, BCa method, simple sampling), ♂: men, ♀: women
| mJSW (n=87, ♂= 37, ♀=50) | medfJSW (n=87, ♂= 37, ♀=50) | latfJSW (n=81, ♂= 34, ♀=47) | |||||||
|---|---|---|---|---|---|---|---|---|---|
| r | [CI 95%] | p | r | [CI 95%] | p | r | [CI 95%] | p | |
| Demographics | |||||||||
| BMI | 0.22 | [0.02, 0.41] | .043 | 0.09 | [−0.13, 0.34] | .395 | 0.24 | [0.04, 0.42] | .031 |
| Height | 0.48 | [0.31, 0.62] | <.001 | 0.55 | [0.41, 0.67] | <.001 | 0.50 | [0.25, 0.70] | <.001 |
| Weight | 0.45 | [0.28, 0.60] | <.001 | 0.41 | [0.22, 0.59] | <.001 | 0.48 | [0.32, 0.62] | <.001 |
| Age | −0.15 | [−0.30, 0.00] | .160 | −0.19 | [−0.35, −0.02] | .074 | −0.24 | [−0.41, −0.05] | .032 |
| Knee alignment | 0.16 | [−0.06, 0.34] | .152 | 0.11 | [−0.07, 0.29] | .318 | −0.06 | [−0.32, 0.21] | .614 |
| Cartilage overall | |||||||||
| FTC.ThCtAB | 0.65 | [0.47, 0.80] | <.001 | 0.75 | [0.63, 0.85] | <.001 | 0.72 | [0.52, 0.88] | <.001 |
| T.ThCtAB | 0.67 | [0.50, 0.79] | <.001 | 0.71 | [0.57, 0.81] | <.001 | 0.69 | [0.54, 0.82] | <.001 |
| cF.ThCtAB | 0.54 | [0.33, 0.73] | <.001 | 0.68 | [0.52, 0.82] | <.001 | 0.59 | [0.35, 0.78] | <.001 |
| Meniscus overall | |||||||||
| ACdAB.Cov | 0.25 | [0.07, 0.42] | .019 | −0.11 | [−0.30, 0.06] | .321 | −0.10 | [−0.33, 0.11] | .378 |
| TA.Uncov | −0.31 | [−0.48, −0.11] | .004 | −0.16 | [−0.36, 0.06] | .143 | 0.05 | [−0.19, 0.29] | .685 |
| Th.Me | 0.50 | [0.36, 0.63] | <.001 | 0.32 | [0.13, 0.49] | .002 | 0.27 | [0.05, 0.47] | .016 |
| Th.Max | 0.43 | [0.27, 0.61] | <.001 | 0.24 | [0.07, 0.44] | .023 | 0.16 | [0.00, 0.33] | .143 |
| Ex.Me | −0.14 | [−0.38, 0.13] | .192 | −0.14 | [−0.36, 0.12] | .208 | −0.26 | [−0.44, −0.06] | .019 |
| Ex.Max | 0.40 | [0.19, 0.56] | <.001 | 0.24 | [0.05, 0.41] | .027 | 0.11 | [−0.13, 0.35] | .314 |
| Wid.Me | 0.41 | [0.25, 0.57] | <.001 | 0.14 | [−0.04, 0.30] | .210 | 0.32 | [0.12, 0.48] | .004 |
| Wid.Max | 0.42 | [0.27, 0.57] | <.001 | 0.16 | [−0.03, 0.34] | .152 | 0.25 | [0.03, 0.44] | .023 |
| Demographics | |||||||||
| BMI | ♂ −0.27 | [−0.52, 0.04] | .112 | ♂ −0.36 | [−0.63, −0.02] | .031 | ♂ −0.06 | [−0.44, 0.24] | .736 |
| ♀ 0.24 | [−0.05, 0.49] | .095 | ♀ 0.13 | [−0.14, 0.40] | .357 | ♀ 0.00 | [−0.34, 0.32] | .985 | |
| Height | ♂ 0.25 | [−0.08, 0.52] | .138 | ♂ 0.51 | [0.26, 0.68] | .001 | ♂ 0.07 | [−0.31, 0.49] | .715 |
| ♀ 0.26 | [0.03, 0.49] | .261 | ♀ 0.35 | [−0.01, 0.59] | .013 | ♀ 0.43 | [0.16, 0.66] | .003 | |
| Weight | ♂ −0.08 | [−0.35, 0.19] | .650 | ♂ 0.01 | [−0.29, 0.30] | .934 | ♂ 0.00 | [−0.31, 0.23] | .987 |
| ♀ 0.38 | [0.08, 0.58] | .007 | ♀ 0.35 | [0.08, 0.58] | .013 | ♀ 0.29 | [0.01, 0.53] | .052 | |
| Age | ♂ −0.35 | [−0.53, −0.17] | .034 | ♂ −0.35 | [−0.54, −0.13] | .032 | ♂ −0.46 | [−0.63, −0.21] | .006 |
| ♀ −0.08 | [−0.34, 0.23] | .587 | ♀ −0.12 | [−0.36, 0.10] | .393 | ♀ −0.14 | [−0.43, 0.14] | .357 | |
| Knee alignment | ♂ 0.14 | [−0.11, 0.36] | .425 | ♂ 0.16 | [−0.05, 0.38] | .333 | ♂ −0.17 | [−0.48, 0.21] | .346 |
| ♀ 0.23 | [−0.05, 0.48] | .103 | ♀ 0.10 | [−0.23, 0.39] | .491 | ♀ 0.10 | [−0.38, 0.45] | .517 | |
| Cartilage overall | |||||||||
| FTC.ThCtAB | ♂ 0.63 | [0.30, 0.85] | <.001 | ♂ 0.72 | [0.48, 0.87] | <.001 | ♂ 0.66 | [0.39, 0.86] | <.001 |
| ♀ 0.38 | [0.06, 0.63] | .007 | ♀ 0.66 | [0.46, 0.80] | <.001 | ♀ 0.46 | [0.02, 0.79] | .001 | |
| T.ThCtAB | ♂ 0.67 | [0.44, 0.83] | <.001 | ♂ 0.69 | [0.46, 0.84] | <.001 | ♂ 0.63 | [0.45, 0.80] | <.001 |
| ♀ 0.43 | [0.06, 0.69} | .002 | ♀ 0.57 | [0.34, 0.76] | <.001 | ♀ 0.42 | [0.03, 0.74] | .003 | |
| cF.ThCtAB | ♂ 0.48 | [0.06, 0.79] | .002 | ♂ 0.61 | [0.26, 0.82] | <.001 | ♂ 0.46 | [0.10, 0.74] | .006 |
| ♀ 0.27 | [−0.15, 0.52] | .062 | ♀ 0.61 | [0.43, 0.73] | <.001 | ♀ 0.35 | [−0.04, 0.66] | .017 | |
| Meniscus overall | |||||||||
| ACdAB.Cov | ♂ 0.22 | [−0.06, 0.46] | .199 | ♂ −0.14 | [−0.41, 0.17] | .424 | ♂ 0.02 | [−0.39, 0.34] | .922 |
| ♀ 0.34 | [0.09, 0.58] | .016 | ♀ −0.11 | [−0.40, 0.17] | .434 | ♀ −0.20 | [−0.43, 0.07] | .186 | |
| TA.Uncov | ♂ −0.26 | [−0.50, 0.11] | .128 | ♂ −0.16 | [−0.46, 0.30] | .353 | ♂ −0.06 | [−0.40, 0.32] | .732 |
| ♀ −0.15 | [−0.37, 0.07] | .311 | ♀ 0.07 | [−0.21, 0.30] | .650 | ♀ 0.06 | [−0.22, 0.35] | .681 | |
| Th.Me | ♂ 0.35 | [0.11, 0.55] | .035 | ♂ 0.12 | [−0.21, 0.46] | .118 | ♂ 0.01 | [−0.33, 0.39] | .959 |
| ♀ 0.37 | [0.14, 0.58] | .009 | ♀ 0.22 | [−0.05, 0.45] | .129 | ♀ 0.15 | [−0.09, 0.38] | .326 | |
| Th.Max | ♂ 0.22 | [−0.05, 0.47] | .188 | ♂ 0.04 | [−0.22, 0.34] | .826 | ♂ −0.06 | [−0.34, 0.22] | .719 |
| ♀ 0.43 | [0.16, 0.67] | .002 | ♀ 0.22 | [−0.08, 0.51] | .122 | ♀ 0.07 | [−0.26, 0.29] | .633 | |
| Ex.Me | ♂ −0.06 | [−0.37, 0.29] | .717 | ♂ −0.14 | [−0.42, 0.20] | .400 | ♂ −0.24 | [−0.54, 0.07] | .170 |
| ♀ 0.06 | [−0.25, 0.33] | .659 | ♀ 0.12 | [−0.18, 0.35] | .423 | ♀ −0.07 | [−0.41, 0.26] | .658 | |
| Ex.Max | ♂ 0.35 | [0.13, 0.56] | .034 | ♂ 0.17 | [−0.11, 0.42] | .308 | ♂ −0.05 | [−0.33, 0.21] | .782 |
| ♀ 0.32 | [0.02, 0.61] | .024 | ♀ 0.15 | [−0.15, 0.42] | .290 | ♀ −0.07 | [−0.47, 0.35] | .632 | |
| Wid.Me | ♂ 0.12 | [−0.18, 0.41] | .480 | ♂ −0.12 | [−0.37, 0.11] | .492 | ♂ 0.04 | [−0.39, 0.34] | .836 |
| ♀ 0.42 | [0.20, 0.64] | .003 | ♀ 0.05 | [−0.21, 0.28] | .732 | ♀ −0.02 | [−0.28, 0.21] | .922 | |
| Wid.Max | ♂ 0.18 | [−0.18, 0.41] | .491 | ♂ −0.17 | [−0.45, 0.13] | .329 | ♂ −0.03 | [−0.44, 0.28] | .850 |
| ♀ 0.38 | [0.16, 0.58] | .006 | ♀ 0.28 | [−0.21, 0.31] | .077 | ♀ 0.13 | [−0.15, 0.36] | .377 | |
Abbreviations: BMI = body mass index; ThCtAB = mean cartilage thickness over the total subchondral bone area with denuded areas counting as 0 mm thickness; FTC = femorotibial compartment; T = tibia; cF = central weight-bearing femur; ACdAB.Cov = percentage of tibial plateau covered by the meniscus; TA.Uncov = percentage of the tibial meniscal surface not covering the tibial plateau; Th.Me/Max = mean/maximal meniscal thickness; Ex.Me/Max = mean/maximal meniscal extrusion; Wid.Me/Max = mean/maximal meniscal width.
Variable reduction for regression analyses
Subregional cartilage and meniscal measures were not observed to consistently provide higher correlations with radiographic JSW measures than total compartment values of these structures (Suppl. Tables 1 and 2); therefore subregional measures were not considered in the multiple linear regression analyses. Whenever “mean” measures of certain variables were available, these were prioritized for the regression analyses whereas maximum measures were not included in the models (e.g. mean meniscal width, mean meniscal thickness, mean meniscal extrusion). The evaluation of partial correlations confirmed the high collinearity of many variables and therefore supported the above parameter selection (data not shown).
Contribution of cartilage and meniscus to minimal JSW
The highest correlation with minimal JSW was noted for cartilage thickness in the anterior subregion of the medial tibia (r=0.69) (Suppl. Table 2), but similar correlation coefficients (0.54≤r≤0.67) were noted for total medial compartment cartilage thickness measures (Table 2). Among meniscal measures, the highest correlation with minimal JSW was observed for the mean medial meniscal thickness in the posterior horn (r=0.52, Suppl. Table 2), closely followed by the mean medial meniscal thickness for the entire meniscus (r=0.50, Table 2). Approximately three quarters of all meniscal measures attained statistically significant correlations with minimal JSW, including morphological as well as positional measures (Table 2; Suppl. Table 2). Stepwise regression for the total cohort showed that, in addition to medial tibial cartilage thickness, the “percentage of the tibial plateau covered by the meniscus” added significant information to explain variance in minimal JSW (total adjusted multiple r2=58.1%, Table 3).
Table 3.
Explanatory parameters in the multiple linear regression models (stepwise), respective r2 from bivariate correlation (#) and cumulative adjusted r2 from multiple linear stepwise regression (§) (explained variance) for minimal medial joint space width (mJSW), medial (medfJSW) and lateral (latfJSW) fixed-location joint space width in the full cohort and in men and women separately.
| mJSW (n=87, ♂= 37, ♀=50) | medfJSW (n=87, ♂= 37, ♀=50) | latfJSW (n=81, ♂= 34, ♀=47) | |||||||
|---|---|---|---|---|---|---|---|---|---|
| Parameter | r2 (#) | cumulative adjusted r2 (§) | Parameter | r2 (#) | cumulative adjusted r2 (§) | Parameter | r2 (#) | cumulative adjusted r2 (§) | |
| Total cohort | MT.ThCtAB | 0.445 | 0.438 | MFTC.ThCtAB | 0.561 | 0.555 | LFTC.ThCtAB | 0.514 | 0.508 |
| MM.ACdAB.Cov | 0.063 | 0.503 | Height | 0.306 | 0.590 | ||||
| Height | 0.230 | 0.561 | Age | 0.037 | 0.604 | ||||
| Knee alignment | 0.024 | 0.581 | |||||||
| Men | MT.ThCtAB | 0.454 | 0.438 | MFTC.ThCtAB | 0.518 | 0.504 | LFTC.ThCtAB | 0.434 | 0.416 |
| Height | 0.258 | 0.602 | LM.Ex.Me | 0.058 | 0.489 | ||||
| Age | 0.211 | 0.544 | |||||||
| Women | MT.ThCtAB | 0.186 | 0.168 | MFTC.ThCtAB | 0.432 | 0.420 | LFTC.ThCtAB | 0.207 | 0.189 |
| MM.ACdAB.Cov | 0.115 | 0.312 | Height | 0.181 | 0.272 | ||||
| Height | 0.068 | 0.390 | |||||||
| BMI | 0.057 | 0.491 | |||||||
| Knee alignment | 0.054 | 0.573 | |||||||
Abbreviations: ThCtAB = mean cartilage thickness over the total subchondral bone area with denuded areas counting as 0 mm thickness (from DESSwe); MFTC = medial femorotibial compartment; LFTC = lateral femorotibial compartment; MT = medial tibia; ACdAB.Cov = percentage of tibial plateau covered by the meniscus; Ex.Me = mean meniscal extrusion; MM = medial meniscus; LM = lateral meniscus; BMI = body mass index.
Analyses stratified by sex revealed that the correlations of minimal JSW with cartilage thickness measures were higher for men than women and those of minimal JSW with meniscal measures were higher for women than men (Table 1). Differences in the correlations between sexes, however, did not reach statistical significance (Fisher's z-test, data not shown). Yet, stepwise regression yielded discording models: In men, 43.8% (total adjusted multiple r2) of the variance in minimal JSW was explained by medial tibial cartilage thickness. In women, variance in medial tibial cartilage thickness only explained 16.8% of minimal JSW variance, while the percentage of tibial plateau covered by the meniscus and demographic parameters added approximately 40% to the explained variance in minimal JSW (Table 3).
Contributions of cartilage and meniscus measures to medial and lateral fixed-location JSW
The highest correlations with medial fixed-location JSW and lateral fixed-location JSW were noted for ipsi-compartmental cartilage thickness (MFTC: r=0.75 and LFTC: r=0.72). As for minimal JSW, all correlations between cartilage and fixed-location JSW measures were significant (p<0.01), with values of 0.45≤r≤0.70 noted for subregions (Table 2, Suppl. Table 2). As for minimal JSW, the highest correlation of a meniscal measure with medial fixed-location JSW was observed for mean medial meniscal thickness in the posterior horn (r=0.34), closely followed by the mean medial meniscal thickness for the entire meniscus (r=0.32). The highest correlation of meniscal measures with lateral fixed-location JSW was noted for lateral mean meniscal width (r=0.32, Table 2, Suppl. Table 2). In comparison to minimal JSW, noticeable fewer meniscal measures were significantly correlated with the fixed-location JSW measures (Table 2). Stepwise regression confirmed that the variation in fixed-location JSW measures was explained by cartilage and demographic measures alone (medial fixed-location JSW: total adjusted multiple r2=60.4%; lateral fixed-location JSW: total adjusted multiple r2=50.8%), whereas meniscal measures did not provide significant additional information to explain variance in medial or lateral fixed-location JSW measures (Table 3).
Sex-stratified analyses showed that the correlations of medial fixed-location JSW and lateral fixed-location JSW with cartilage and meniscal measures were similar between men and women (confirmed by Fisher's z-test, data not shown). Regression analyses for medial fixed-location JSW resulted in similar models for men and women, mainly relying on cartilage thickness (♂: total adjusted multiple r2=60.2%; ♀: total adjusted multiple r2=42.0%). The results for lateral fixed-location JSW yielded a model that included cartilage thickness and body height in women (total adjusted multiple r2=27.2%), and cartilage thickness, mean lateral meniscal extrusion and age in men (total adjusted multiple r2=54.4%, Table 3).
Discussion
To our knowledge, this is the first study to describe the correlation between quantitative 3D cartilage and meniscal measures with medial and lateral radiographic JSW in a healthy, strictly non-arthritic population. Specifically, we explored potential differences in the above relationships between minimal JSW and medial and lateral fixed-location JSW, and differences in these relationships between men and women. The results of the present analyses suggest that meniscal positional measures contribute significantly to the variability in normal minimal JSW, particularly in women, whereas variability in medial and lateral fixed-location JSW is predominantly explained by variation in ipsi-compartmental cartilage thickness and demographic measures.
One potential limitation of the current study was that the JSW measurements were derived from weight-bearing radiography, whereas the cartilage and meniscal parameters were obtained from MR images in non-weight-bearing conditions, and that previous studies showed that meniscal and cartilage thickness parameters are susceptible to weight-bearing vs. non-weight-bearing conditions [24–26]. However, a recent study that used a loading apparatus to simulate weight-bearing conditions for MRI acquisitions in supine position revealed that the correlation between weight-bearing JSW and non-weight-bearing cartilage thickness measures was only marginally lower than the one between weight-bearing JSW and weight-bearing cartilage thickness measures [24]. A strength of the current study was that cartilage thickness measures were available from two different image orientations (coronal, sagittal) and image contrasts (FLASHwe and DESSwe), and that the results were consistent for both types of measures.
Previous studies [2,4] analysed the menisci two-dimensionally from one coronal and one sagittal slice respectively, to assess the meniscal extrusion and height, and the coverage of the tibial plateau, each to the nearest millimetre. These studies focussed on the association with minimum medial radiographic JSW in osteoarthritic knees [2] and in females with and without KOA [4]. In the current study, we applied a 3D measurement technology to assess the contribution of positional and morphological measures of the medial and lateral meniscus to radiographic JSW in a sample of asymptomatic participants without radiographic KOA, and even more importantly without known risk factors of KOA. Although no direct comparison between 2D and 3D meniscal measurements was made, the 3D approach clearly provides more comprehensive information on the anterior horn, posterior horn and central part of the meniscus. Also, it is potentially more robust than 2D measurements as it is less dependent on the specific positioning and orientation of the joint in the scanner, as well as on the selection of a specific imaging slice for analysis [9]. Additionally, we undertook analyses of cartilage and meniscal measures in specific subregions. Yet, our analyses revealed that it was sufficient to analyse cartilage as well as the menisci on a compartmental level to explain variability in healthy JSW because subregional measures did not provide consistently higher correlation coefficients.
For minimal JSW, a contribution of both cartilage thickness and meniscal position parameters was noted, with the amount of variance explained by cartilage thickness (≈44%) being comparable to previous studies [4,6]; thereof one study focussed on tibial cartilage only and did not take subregional cartilage thickness measures into account [6]. Our data suggest a greater influence of the menisci on minimal JSW variance (additional ≈7%) than reported by the study of Hunter et al. [4], likely due to the current 3D vs. previous 2D approach to measure meniscal parameters. The mean medial meniscal thickness displayed the highest correlation with minimal JSW, but also displayed high partial correlations with cartilage thickness parameters. Therefore, stepwise regression instead integrated percent tibial coverage into the model of minimal JSW, which, independently of cartilage thickness, accounted for the most variability in minimal JSW. “Percent tibial coverage by the meniscus” was also the meniscal parameter which accounted for most of the variability observed in between-knee differences in minimal JSW and medial fixed-location JSW of knees with and without Osteoarthritis Research Society International joint space narrowing in a previous study [5]. Our current findings suggest that the meniscal contribution to minimal JSW is stronger in women than in men. Specifically, when comparing the minimal JSW regression model between both sexes, the variance explained by cartilage thickness alone was approximately 44% in men, whereas it was only 17% in women. Yet, the model for women left less variance unexplained than the one for men as it included meniscal and demographic parameters.
Fixed-location JSW measures have been suggested to overcome some of the limitations with minimal JSW that occur due to the variability in tibial alignment in fixed-flexion radiographs [15], and display a greater sensitivity to change in KOA than minimal JSW [14–16]. The current study clearly demonstrates that the various intra-articular locations of JSW measurements are influenced differently by cartilage thickness and meniscal parameters. Whereas in minimal JSW a contribution of both cartilage and meniscal parameters was found, our analyses revealed that variance in fixed-location JSW measures was dominated by variance in cartilage thickness in both men and women. Cartilage thickness explained, however, a somewhat smaller proportion of variation in JSW in the lateral than in the medial compartment, which is concordant to a previous study that reported lateral femorotibial cartilage thickness being correlated less to lateral JSW, than medial femorotibial cartilage thickness to medial JSW [27]. Comparing different intra-articular locations of JSW measures, minimal JSW and lateral fixed-location JSW tended to display higher correlation coefficients with cartilage thickness in men than in women while for medial fixed-location JSW the relationships were consistent for men and women. A potential explanation may be the greater knee joint laxity in women [28,29]. In normally aligned knees, joint loading is theorised to be transmitted mostly through the central medial compartment [30], where medial fixed-location JSW is measured. In laxer joints, minimal JSW and lateral fixed-location JSW may be more variable, and accordingly less reflective of cartilage thickness than medial fixed-location JSW. These findings may also provide some explanation to why medial fixed-location JSW appear to be more sensitive to longitudinal change in KOA samples than minimal JSW [14–16].
Conclusions
In healthy subjects, minimal JSW was observed to reflect a combination of cartilage and meniscal measures, particularly in women. Fixed-location JSW, in contrast, was found to be dominated by variance in cartilage thickness in both men and women, with somewhat higher correlations in the medial than lateral femorotibial compartment. The significant contribution of the meniscus’ position on minimal JSW reinforces concerns over validity of JSW as an indirect measure of hyaline cartilage.
Supplementary Material
Acknowledgements
We would like to thank the Osteoarthritis Initiative (OAI) participants, OAI investigators and OAI Clinical Center's staff for generating this publicly available image data set. The study and image acquisition was supported by the OAI. The OAI is a public-private partnership comprised of five contracts (N01-AR-2-2258; N01-AR-2-2259; N01-AR-2-2260; N01-AR-2-2261; N01-AR-2-2262) funded by the National Institutes of Health, a branch of the Department of Health and Human Services, and conducted by the OAI Study Investigators. Private funding partners include Pfizer, Inc.; Novartis Pharmaceuticals Corporation; Merck Research Laboratories; and GlaxoSmithKline. Private sector funding for the OAI is managed by the Foundation for the National Institutes of Health. AGC is supported by a European Union Initial Training Network fellowship (FP7-PEOPLE-2013-ITN; KNEEMO, grant agreement number 607510).
Abbreviations
- KOA
Knee osteoarthritis
- JSW
Radiographic joint space width
Footnotes
Publisher's Disclaimer: This is a PDF file of an unedited manuscript that has been accepted for publication. As a service to our customers we are providing this early version of the manuscript. The manuscript will undergo copyediting, typesetting, and review of the resulting proof before it is published in its final citable form. Please note that during the production process errors may be discovered which could affect the content, and all legal disclaimers that apply to the journal pertain.
Role of the Funding Source
The funding sources were not involved in the design and conduct of this particular study, in the analysis and interpretation of the data, and in the preparation, review, or approval of the manuscript.
Conflicts of interest
WW has a part time employment with Chondrometrics GmbH and is a co-owner of Chondrometrics GmbH, a company providing MR image analysis services to academic researchers and to industry.
FE is CEO and co-owner of Chondrometrics GmbH; he has provided consulting services to Merck Serono, Bioclinica/Synarc and Samumed, has prepared educational sessions for Medtronic, and has received research support from Pfizer, Eli Lilly, Merck Serono, Novartis, Stryker, Abbvie, Kolon, Synarc, Ampio, BICL and Orthotrophix.
KE, AGC and MR have no competing interests.
Author contribution
MR, WW, and FE contributed equally to the conception and design of the study, acquisition of data, analysis and interpretation of data and drafting the manuscript.
AGC contributed to the interpretation of data and drafting the manuscript.
KE participated in data acquisition.
MR performed the statistical analyses.
All authors contributed to revising the manuscript critically for important intellectual content, and read and approved the manuscript for publication.
References
- 1.Guidance for industry on clinical development programs for drugs, devices and biological products intended for the treatment of osteoarthritis (OA) 1999 www.fda.gov/.../GuidanceComlianceRegulatoryInformation/GUidances/ucm071577.pdf.
- 2.Hunter DJ, Zhang YQ, Tu X, Lavalley M, Niu JB, Amin S, Guermazi A, Genant H, Gale D, Felson DT. Change in joint space width: hyaline articular cartilage loss or alteration in meniscus? Arthritis Rheum. 2006;54:2488–95. doi: 10.1002/art.22016. [DOI] [PubMed] [Google Scholar]
- 3.Adams JG, McAlindon T, Dimasi M, Carey J, Eustace S. Contribution of meniscal extrusion and cartilage loss to joint space narrowing in osteoarthritis. Clin.Radiol. 1999;54:502–6. doi: 10.1016/s0009-9260(99)90846-2. [DOI] [PubMed] [Google Scholar]
- 4.Hunter DJ, Buck R, Vignon E, Eckstein F, Brandt K, Mazzuca SA, Wyman BT, Otterness I, Hellio Le Graverand MP. Relation of regional articular cartilage morphometry and meniscal position by MRI to joint space width in knee radiographs. Osteoarthritis Cartilage. 2009;17:1170–76. doi: 10.1016/j.joca.2009.04.001. [DOI] [PubMed] [Google Scholar]
- 5.Bloecker K, Wirth W, Hunter DJ, Duryea J, Guermazi A, Kwoh CK, Resch H, Eckstein F. Contribution of regional 3D meniscus and cartilage morphometry by MRI to joint space width in fixed flexion knee radiography--a between-knee comparison in subjects with unilateral joint space narrowing. Eur.J.Radiol. 2013;82:e832–9. doi: 10.1016/j.ejrad.2013.08.041. [DOI] [PubMed] [Google Scholar]
- 6.Beattie KA, Duryea J, Pui M, O'Neill J, Boulos P, Webber CE, Eckstein F, Adachi JD. Minimum joint space width and tibial cartilage morphology in the knees of healthy individuals: a cross-sectional study. BMC.Musculoskelet.Disord. 2008;9:119. doi: 10.1186/1471-2474-9-119. [DOI] [PMC free article] [PubMed] [Google Scholar]
- 7.Gale DR, Chaisson CE, Totterman SM, Schwartz RK, Gale ME, Felson D. Meniscal subluxation: association with osteoarthritis and joint space narrowing. Osteoarthritis Cartilage. 1999;7:526–32. doi: 10.1053/joca.1999.0256. [DOI] [PubMed] [Google Scholar]
- 8.Wirth W, Eckstein F. A technique for regional analysis of femorotibial cartilage thickness based on quantitative magnetic resonance imaging. IEEE Trans.Med.Imaging. 2008;27:737–44. doi: 10.1109/TMI.2007.907323. [DOI] [PubMed] [Google Scholar]
- 9.Wirth W, Frobell RB, Souza RB, Li X, Wyman BT, Le Graverand MP, Link TM, Majumdar S, Eckstein F. A three-dimensional quantitative method to measure meniscus shape, position, and signal intensity using MR images: a pilot study and preliminary results in knee osteoarthritis. Magn Reson. 2010;63:1162–71. doi: 10.1002/mrm.22380. [DOI] [PubMed] [Google Scholar]
- 10.Eckstein F, Yang M, Guermazi A, Roemer FW, Hudelmaier M, Picha K, Baribaud F, Wirth W, Felson DT. Reference values and Z-scores for subregional femorotibial cartilage thickness--results from a large population-based sample (Framingham) and comparison with the non-exposed Osteoarthritis Initiative reference cohort. Osteoarthritis Cartilage. 2010;18:1275–83. doi: 10.1016/j.joca.2010.07.010. [DOI] [PMC free article] [PubMed] [Google Scholar]
- 11.Bloecker K, Englund M, Wirth W, Hudelmaier M, Burgkart R, Frobell RB, Eckstein F. Revision 1 size and position of the healthy meniscus, and its correlation with sex, height, weight, and bone area- a cross-sectional study. BMC Musculoskelet. Disord. 2011;12:248. doi: 10.1186/1471-2474-12-248. [DOI] [PMC free article] [PubMed] [Google Scholar]
- 12.Altman RD, Gold GE. Atlas of individual radiographic features in osteoarthritis, revised. 2007 doi: 10.1016/j.joca.2006.11.009. [DOI] [PubMed] [Google Scholar]
- 13.Hellio Le Graverand MP, Mazzuca S, Duryea J, Brett A. Radiographic grading and measurement of joint space width in osteoarthritis. Rheum.Dis.Clin.North Am. 2009;35:485–502. doi: 10.1016/j.rdc.2009.08.005. [DOI] [PubMed] [Google Scholar]
- 14.Neumann G, Hunter D, Nevitt M, Chibnik LB, Kwoh K, Chen H, Harris T, Satterfield S, Duryea J. Location specific radiographic joint space width for osteoarthritis progression. Osteoarthritis Cartilage. 2009;17:761–5. doi: 10.1016/j.joca.2008.11.001. [DOI] [PMC free article] [PubMed] [Google Scholar]
- 15.Wirth W, Duryea J, Hellio Le Graverand M-PP, John MR, Nevitt M, Buck RJ, Eckstein F. Direct comparison of fixed flexion, radiography and MRI in knee osteoarthritis: responsiveness data from the Osteoarthritis Initiative. Osteoarthritis Cartilage. 2013;21:117–25. doi: 10.1016/j.joca.2012.10.017. [DOI] [PMC free article] [PubMed] [Google Scholar]
- 16.Wirth W, Duryea JW, Nevitt MC, Buck RJ, Hunter D, Eckstein F. Sensitivity To Change Of Radiographic Fixed-Location and Magnetic Resonance Imaging-Based Cartilage Thickness Measures In The Lateral Compartment Of Knees With Radiographic Osteoarthritis – Data From The Osteoarthritis Initiative. Arthritis Rheum. 2013;65:S481. [Google Scholar]
- 17.Eckstein F, Boudreau R, Wang Z, Hannon MJ, Duryea J, Wirth W, Cotofana S, Guermazi A, Roemer F, Nevitt M, John MR, Ladel C, Sharma L, Hunter DJ, Kwoh CK. Comparison of radiographic joint space width and magnetic resonance imaging for prediction of knee replacement: A longitudinal case-control study from the Osteoarthritis Initiative. Eur.Radiol. 2016;26:1942–51. doi: 10.1007/s00330-015-3977-8. [DOI] [PMC free article] [PubMed] [Google Scholar]
- 18.Eckstein F, Wirth W, Nevitt MC. Recent advances in osteoarthritis imaging-the Osteoarthritis Initiative. Nat. Rev. Rheumatol. 2012;8:622–30. doi: 10.1038/nrrheum.2012.113. [DOI] [PMC free article] [PubMed] [Google Scholar]
- 19.Felson D, Niu J, Sack B, Aliabadi P, McCullough C, Nevitt MC. Progression of osteoarthritis as a state of inertia. Ann.Rheum Dis. 2013;72:924–9. doi: 10.1136/annrheumdis-2012-201575. [DOI] [PMC free article] [PubMed] [Google Scholar]
- 20.Peterfy CG, Schneider E, Nevitt M. The osteoarthritis initiative: report on the design rationale for the magnetic resonance imaging protocol for the knee. Osteoarthritis Cartilage. 2008;16:1433–41. doi: 10.1016/j.joca.2008.06.016. [DOI] [PMC free article] [PubMed] [Google Scholar]
- 21.Wirth W, Hellio Le Graverand MP, Wyman BT, Maschek S, Hudelmaier M, Hitzl W, Nevitt M, Eckstein F. Regional analysis of femorotibial cartilage loss in a subsample from the Osteoarthritis Initiative progression subcohort. Osteoarthritis Cartilage. 2009;17:291–7. doi: 10.1016/j.joca.2008.07.008. [DOI] [PMC free article] [PubMed] [Google Scholar]
- 22.Efron B, Tibshirani RJ. An Introduction to the Bootstrap. CRC Press; 1994. [Google Scholar]
- 23.Duren DL, Sherwood RJ, Chumlea WC, Siervogel RM, Towne B. Radiographic joint space of the knee in healthy young adults. Hum. Biol. 2006;78:353–64. doi: 10.1353/hub.2006.0042. [DOI] [PubMed] [Google Scholar]
- 24.Marsh M, Souza RB, Wyman BT, Hellio Le Graverand MP, Subburaj K, Link TM, Majumdar S. Differences between X-ray and MRI-determined knee cartilage thickness in weight-bearing and non-weight-bearing conditions. Osteoarthritis Cartilage. 2013;21:1876–85. doi: 10.1016/j.joca.2013.09.006. [DOI] [PubMed] [Google Scholar]
- 25.Patel R, Eltgroth M, Souza R, Zhang CA, Majumdar S, Link TM, Motamedi D. Loaded versus unloaded magnetic resonance imaging (MRI) of the knee: Effect on meniscus extrusion in healthy volunteers and patients with osteoarthritis. Eur. J. Radiol. Open. 2016;3:100–7. doi: 10.1016/j.ejro.2016.05.002. [DOI] [PMC free article] [PubMed] [Google Scholar]
- 26.Frobell RB, Souza RB, Wyman BT, W. W., Hellio-Le Graverand MP, H. M., Li X, Link T, Eckstein F, Majumdar S, Frobell RB, Souza RB, Wyman BT, Wirth W, Hellio-LeGraverand M-P, Hudelmaier M, Li X, Link T, Eckstein F, Majumdar S. Meniscus shape, position, and signal under simulated weightbearing and non-weigthbearing conditions in vivo. Osteorthritis Cart. OARSI. 2009;17(Supple):S236. [Google Scholar]
- 27.Buckland-Wright JC, Macfarlane DG, Lynch JA, Jasani MK, Bradshaw CR. Joint space width measures cartilage thickness in osteoarthritis of the knee: high resolution plain film and double contrast macroradiographic investigation. Ann.Rheum.Dis. 1995;54:263–8. doi: 10.1136/ard.54.4.263. [DOI] [PMC free article] [PubMed] [Google Scholar]
- 28.Trimble MH, Bishop MD, Buckley BD, Fields LC, Rozea GD. The relationship between clinical measurements of lower extremity posture and tibial translation. Clin. Biomech. 2002;17:286–90. doi: 10.1016/s0268-0033(02)00010-4. [DOI] [PubMed] [Google Scholar]
- 29.Shultz SJ, Sander TC, Kirk SE, Perrin DH. Sex differences in knee joint laxity change across the female menstrual cycle. J. Sports Med. Phys. Fitness. 2005;45:594–603. [PMC free article] [PubMed] [Google Scholar]
- 30.Mundermann A, Dyrby CO, D'Lima DD, Colwell CW, Andriacchi TP. In vivo knee loading characteristics during activities of daily living as measured by an instrumented total knee replacement. J. Orthop. Res. 2008;26:1167–72. doi: 10.1002/jor.20655. [DOI] [PubMed] [Google Scholar]
Associated Data
This section collects any data citations, data availability statements, or supplementary materials included in this article.