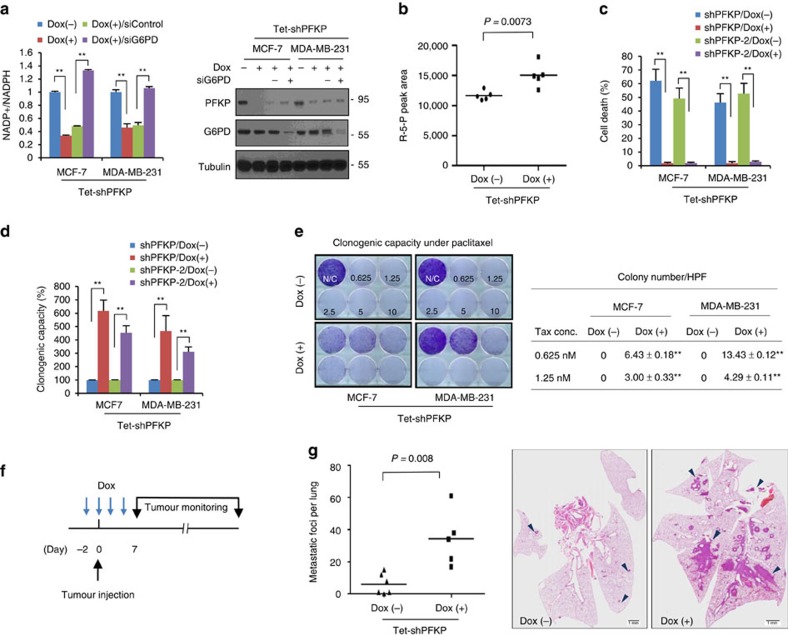
Figure 5. Repression of PFKP induces glucose reflux towards PPP thus providing survival advantage to breast cancer cells.
(a) PFKP controls NADPH level via G6PD-dependent manner. The NADP+/NADPH ratio (left) and protein abundance (right) of indicated cells were measured following inducible knockdown of PFKP (Dox+) in combination with control siRNA or G6PD siRNA. In total, 5 μg of cell lysates were used to detect PFKP and G6PD, and loading controls were validated from reprobing the same blot. (b) Quantitative mass spectrometry analysis of PPP metabolite following inducible knockdown of PFKP. HPLC-ESI-MS/MS peak areas of ribulose-5-phosphate/ribose-5-phosphate of cells expressing PFKP shRNA (Dox+) compared with control (Dox−). (c,d) Cell death quantification (c) and clonogenic capacity (d) after glucose starvation following inducible knockdown of PFKP (Dox+) compared with control (Dox−). (e) Clonogenic survival of breast cancer cells against paclitaxel treatment as indicated by concentration. The PFKP was knocked-down with doxycycline (Dox+) for 48 h before paclitaxel treatment (left). The colony number was determined by stereomicroscopic examination under high power field (right). Data are means±s.d. from n=3 (a) or n=5 (c–e) independent experiments. Statistical significances compared with control are denoted as *P<0.05; **P<0.01 by a two-tailed Student's t-test. (f) An experimental design to determine functional relevance of dynamic regulation of PFKP. Inducible PFKP shRNA expressing cells were either untreated (Dox−) or pretreated with doxycycline (Dox+) in vitro 48 h before inoculation. Recipient mice received either PBS (Dox−) or doxycycline via intraperitoneal delivery at day 0, 2, 4. (g) Lung metastasis by tail vein xenograft of MDA-MB-231-D3H2LN cells. 1 × 10⁵ cells either of control (Dox−, n=6) or of transient knockdown of PFKP (Dox+, n=5) were inoculated intravenously into immunodeficient mice. The number of lung metastatic nodules was counted under microscopic examination (left). Statistical significance was determined by Mann–Whitney test. Whole-field images of representative lungs that showed median metastatic value for each group (right). Arrows indicate metastatic tumour foci in mouse lung. Scale bar, 1 mm.

