FIGURE 2.
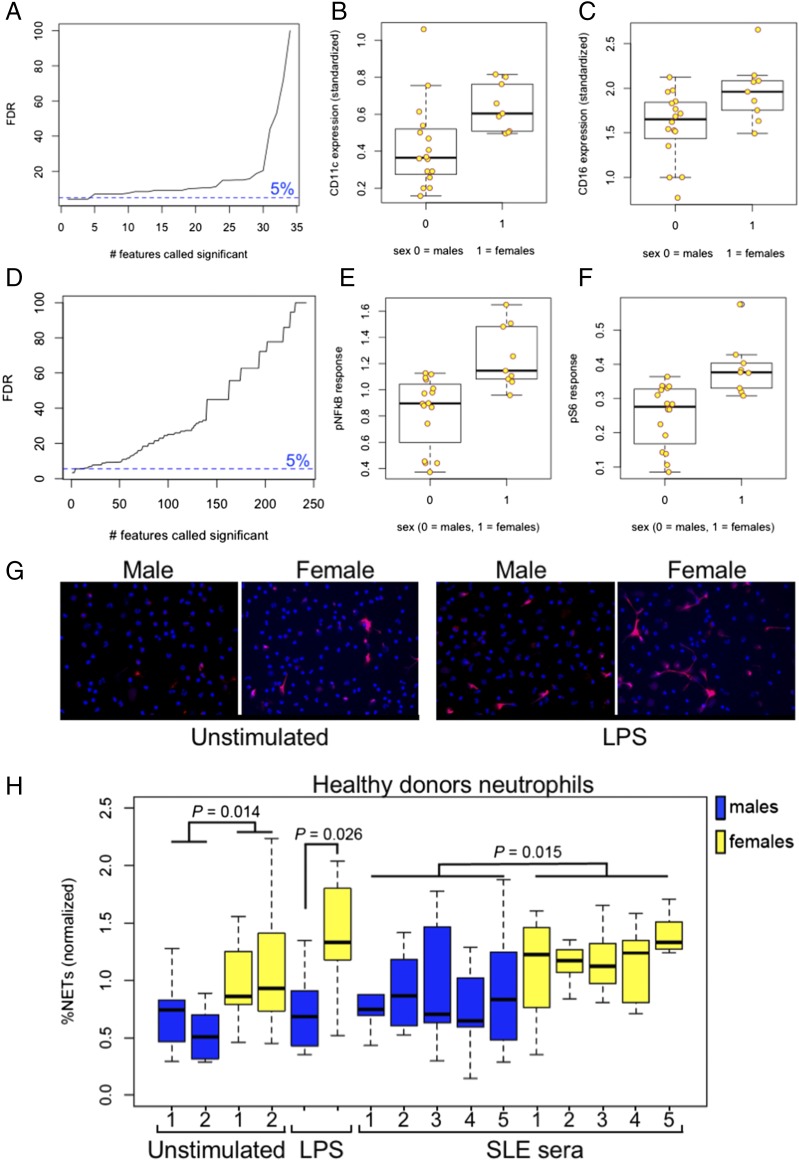
Cell surface markers and functional analysis of males’ and females’ neutrophils. Analysis of cell surface marker expression in males and females was conducted using a CyTOF instrument. (A) Multiple regression analysis with permutations for 34 molecules, with cut-off line at 5% FDR. Box plots showing standardized CD11c (B) and CD16 (C) expression in males and females. (D–F) Neutrophil responses to GM-CSF stimulation. (D) Multiple regression analysis with permutations for 244 features, with cut-off line at 5% FDR. Box plots showing the expression of standardized phosphorylated NF-κB (E) and phosphorylated S6 ribosomal protein (F) in males and females. (G and H) NET formation in vitro. (G) Fluorescent microscopy of NETs in neutrophils from healthy young males and females, in unstimulated conditions and after stimulation with bacterial LPS. (H) Box plots showing normalized percentage of NETs in healthy males and females in unstimulated conditions, after stimulation with LPS, and after stimulation with sera from five SLE patients. Significance of difference between males and females was calculated by combined p values (31) for two unstimulated conditions and five SLE sera–stimulated conditions.

