
FIGURE 2.
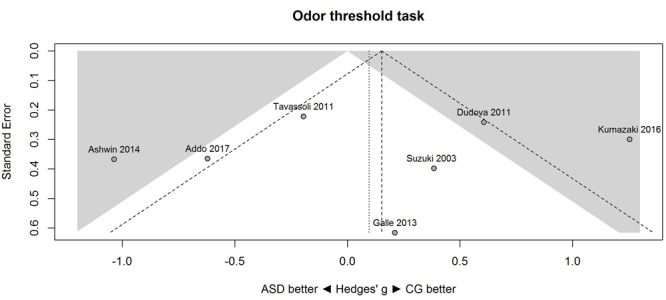
Contour-enhanced funnel plot of performance on the odor threshold task in seven studies. Studies that fall in the gray area are significant (at two-tailed alpha = 0.05). For positive values, CG was better than ASD, and vice versa. ASD, autism spectrum disorder group; CG, control group.