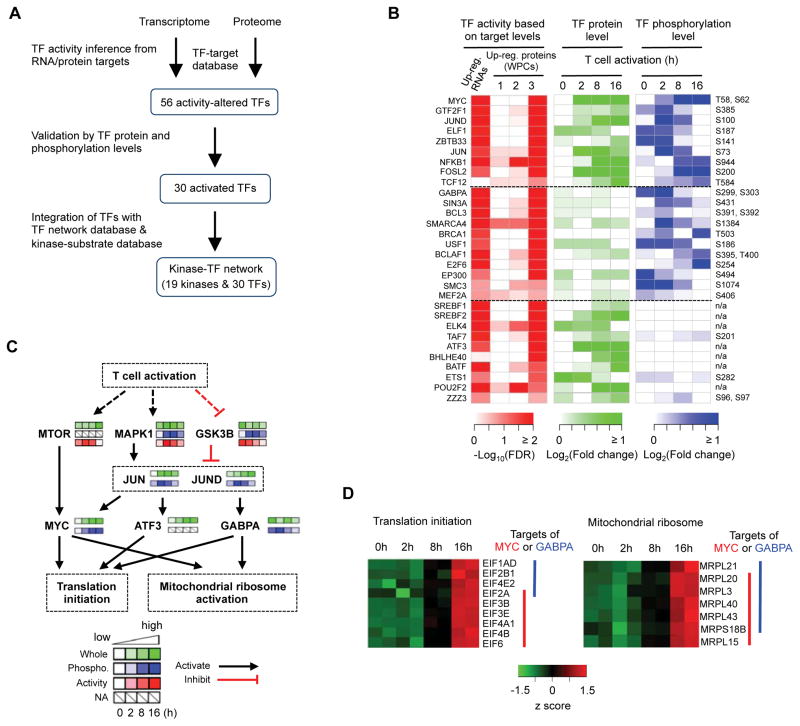
Figure 4. Integrated network analysis reveals key transcription factors and kinases and the connectivity between them in T cell activation.
(A) Overview of the integrative analysis based on transcriptome, whole proteome, phosphoproteome, TF-target database, and kinase-substrate database.
(B) Activated TFs during T cell activation.
(C) Prediction of a putative signaling cascade comprised of key kinases and TFs in the control of protein translation machinery.
(D) Mitochondrial ribosome and translation initiation proteins are activated by MYC and GABPA. The protein levels of the TF downstream targets are indicated.

