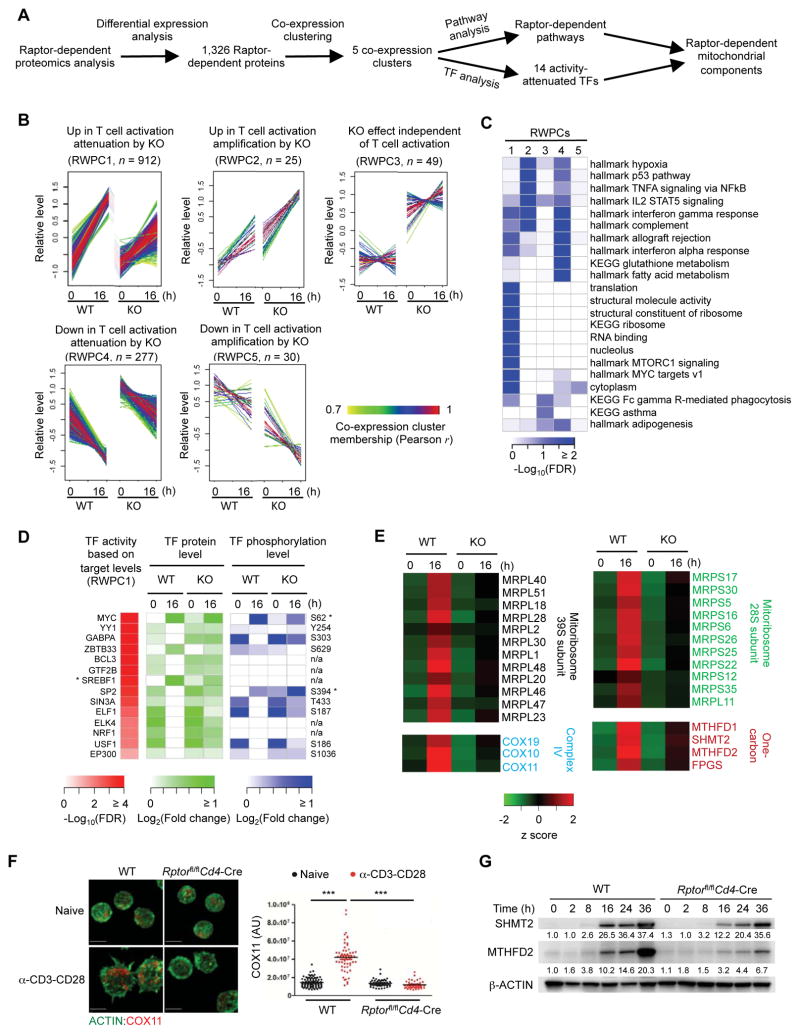
Figure 5. Integrative analysis of Rptor-deficient proteom0e identifies mTORC1-dependent mitochondrial pathways.
(A) Overview of Raptor-dependent proteomics analysis.
(B) Five Raptor-dependent whole proteome co-expression clusters (RWPCs) defined by WGCNA.
(C) Functional annotations of RWPCs by Gene Ontology (GO), KEGG and Hallmark databases.
(D) TFs attenuated by Raptor deficiency. For TFs with an asterisk, a larger scale (e.g. maximum fold change of 10 instead of 2 folds) is used to reflect the large change of protein expression or phosphorylation abundance.
(E) Raptor-dependent mitochondrial pathways. The related protein levels are shown.
(F) Immunofluorescence images of ACTIN (green) and COX11 in naïve and activated WT and Rptor-deficient CD4+ T cells (scale bars, 5 μm). Right, statistical analysis of mean fluorescence intensity (MFI) of COX11 in WT and Rptor-deficient CD4+ T cells.
(G) Immunoblot of SHMT2 and MTHFD2 expression in WT and Rptor-deficient CD4+ T cells stimulated with α-CD3-CD28 for the indicated time points. Numbers below the lanes of SHMT2 and MTHFD2 indicate band intensity relative to that of the loading control-β-ACTIN.
Data are representative of two (F–G) independent experiments. P values are determined by one-way ANOVA with Tukey post-tests (F). ***P < 0.001.

