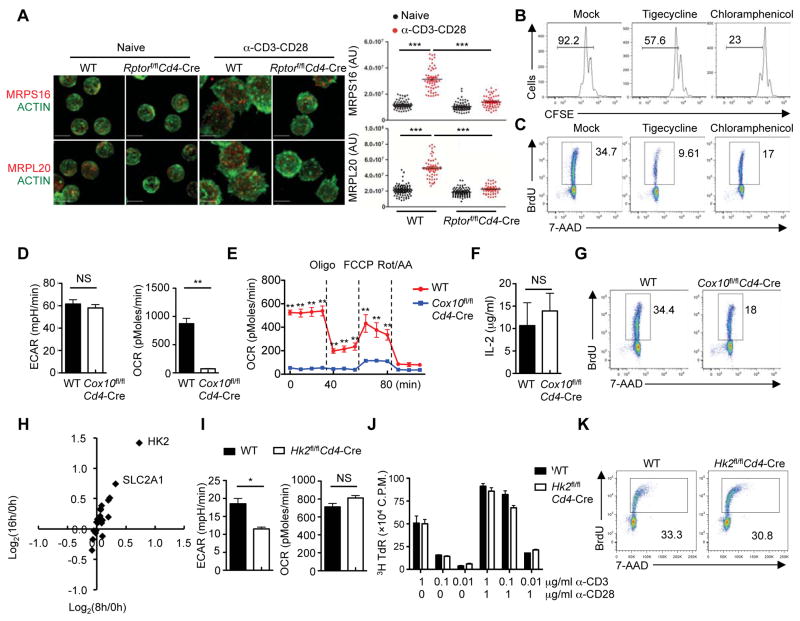
Figure 6. mTORC1-dependent mitoribosome synthesis and complex IV, but not HK2-mediated glycolysis, contribute to T cell quiescence exit.
(A) Immunofluorescence images of ACTIN (green) and MRPS16 (red) or MRPL20 (red) in naïve and activated WT and Rptor-deficient CD4+ T cells (scale bars, 5 μm). Right, statistical analysis of mean fluorescence intensity (MFI) of MRPS16 and MRPL20 in WT and Rptor-deficient CD4+ T cells.
(B) Flow cytometry of CFSE-labeled CD4+ T cells stimulated with α-CD3-CD28 in the presence of tigecycline or chloramphenicol for 60 h.
(C) BrdU incorporation of activated CD4+ T cells in the presence of tigecycline or chloramphenicol (24 h).
(D) Extracellular acidification rate (ECAR) and oxygen consumption rate (OCR) of activated WT and Cox10-deficient CD4+ T cells (24 h).
(E) OCR of activated WT and Cox10-deficient CD4+ T cells (24 h) in response to the indicated mitochondrial inhibitors (Oligo, Oligomycin; FCCP, carbonyl cyanide p-trifluoromethoxyphenylhydrazone; and Rot/AA, Rotenone/Antimycin A).
(F) IL-2 secretion of activated WT and Cox10-deficient CD4+ T cells (24 h).
(G) BrdU incorporation of activated WT and Cox10-deficient CD4+ T cells (24 h).
(H) Expression of glycolytic enzymes and transporters in TCR-activated T cells detected by proteomics profiling. The x-axis shows the induction of protein expression at 8 h, and the y-axis shows the induction of protein expression at 16 h.
(I) ECAR and OCR of activated WT and Hk2-deficient CD4+ T cells (24 h).
(J) [3H]Thymidine incorporation of WT and Hk2-deficient CD4+ T cells stimulated with α-CD3 or α-CD3-CD28 for 64 h, and pulsed with [3H]thymidine for an additional 8 h.
(K) BrdU incorporation of activated WT and Hk2-deficient CD4+ T cells (24 h).
Data are representative of two (A–D, H–K) or three (E–G) independent experiments. Data are mean ± s.e.m. P values are determined by one-way ANOVA with Tukey post-tests (A), two-tailed Student’s t-test (D, I), or two-way ANOVA with Bonferroni post-tests (E). NS, not significant, *P < 0.05, **P < 0.005, and ***P < 0.001. Numbers in gates indicate percentage of cells.
See also Figure S6.

