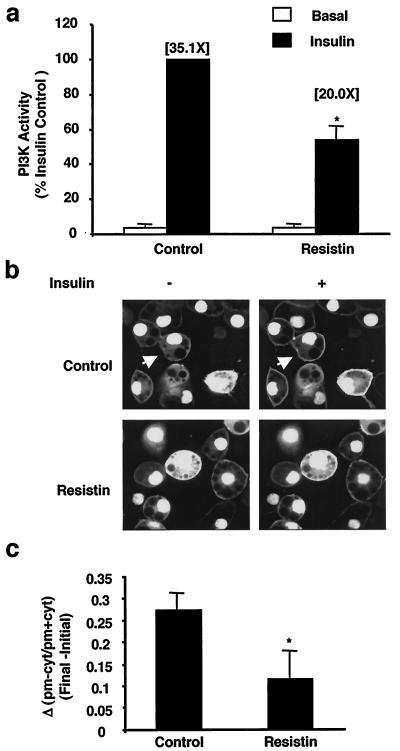
FIG. 2.
Resistin inhibits insulin-stimulated IRS-1-associated PI3K and PIP3 generation in living cells. 3T3-L1 adipocytes were treated with resistin (30 ng/ml) for 2 h prior to insulin stimulation (10 nM) for 2 min. (a) Effects of resistin on IRS-1-associated PI3K activity. The fold increase in PI3K activity relative to the basal levels is noted in parentheses. Data are represented as the percent of insulin effect in control cells and the average of three independent experiments. *, P < 0.05. (b) Effects of resistin on in vivo PIP3 accumulation at the plasma membrane. 3T3-L1 adipocytes were infected with an adenovirus expressing a PIP3 binding protein, GFP-GRP1-PH, 1 day prior to resistin and insulin treatment as in panel a. Fluorescence confocal laser microscopy was used to image the living cells before and after insulin stimulation (5 min). An arrow denotes a representative cell which upon insulin stimulation results in the accumulation of PIP3 at the plasma membrane in response to insulin. A movie of these experiments is available (see Video S1 in the supplemental material). (c) Quantitation of the change in fluorescence intensity of the plasma membrane (pm) relative to the cytosol (cyt) calculated as [(pm − cyt)/(pm + cyt)] following insulin stimulation for 5 min (Final) minus values prior to insulin stimulation (Initial). Data are expressed as the mean values of 10 cells ± SEM. *, P = 0.05.

