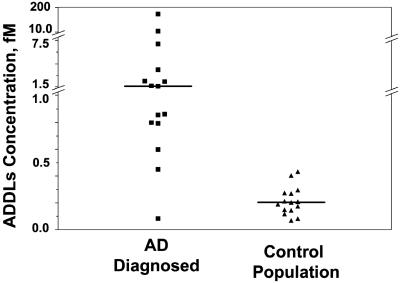
Fig. 2.
Scatter plot from the scanometric detection of barcode DNA released from the bio-barcode assay for 30 subjects. The response for the negative human control subject (brain extract) was similar to that observed for the chip control (dashed line in Fig. 1). The positive control exhibited a response that was off scale and could not be quantified. The data points are averages of three separate experiments normalized for each assay based on the highest response in a series of runs. The mean values for ADDL concentrations (solid lines) are estimated for each group based on the calibration curve in Fig. 1.

