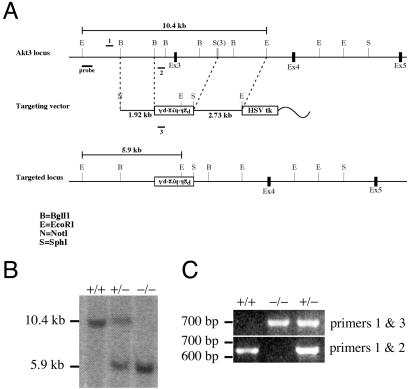
FIG. 1.
Generation of Akt3-deficient mice. (A) Diagram of the Akt3 genomic locus and the targeting vector. The positions of the Southern probe (probe) and PCR primers (1, 2, and 3) are indicated. (B) Genomic DNAs isolated from wild-type (+/+), Akt3 heterozygous (+/−), and Akt3-null (−/−) mice were digested with EcoRI and analyzed by Southern blotting. (C) PCR analysis of genomic DNAs from wild-type (+/+), Akt3 heterozygous (+/−), and Akt3-null (−/−) mice. Primers 1 and 2 generate a 650-bp band from wild-type DNA, and primers 1 and 3 generate a 700-bp band from DNA with a targeted Akt3 allele.

