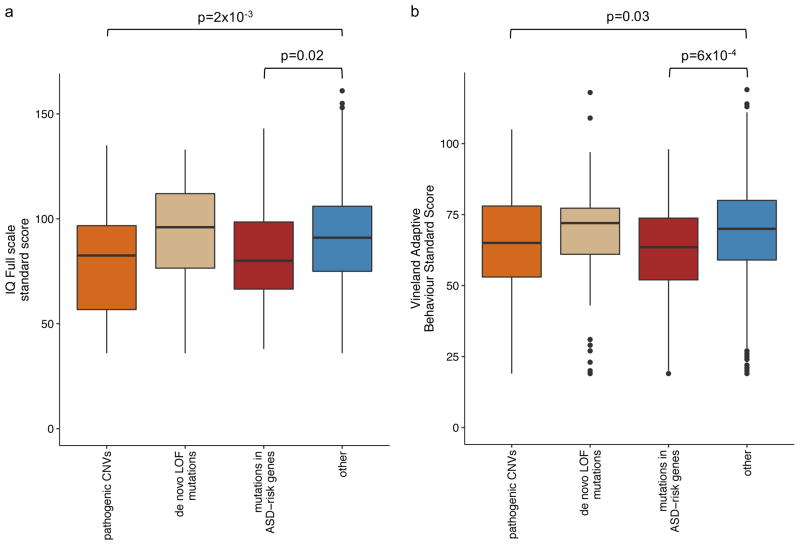
Figure 5. Phenotype comparison for the samples with and without identified mutations.
Standard score of (a) IQ Full scale and (b) Vineland Adaptive Behavior were compared between samples with pathogenic CNVs, de novo LOF mutations, mutations in ASD-risk genes and other samples without any of these mutations.

