
Figure 6.
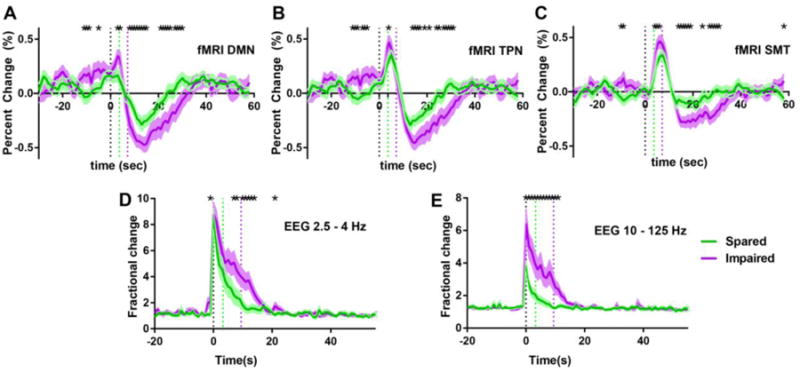
Greater fMRI and EEG amplitude from the outset or preceding seizures with impaired behavior.
(A-C) Timecourse of percent fMRI signal changes in the default mode (A), task positive (B), and sensorimotor-thalamic (C) networks for seizures with spared (green) and impaired (purple) task performance. (D-E) Timecourse of EEG amplitude fractional change (seizure divided by baseline) over time for low (2·5-4 Hz, D) and high (10-125 Hz, E) frequency ranges representing waves and spikes of seizures. (* p < 0 05). Timecourses are aligned to seizure onset (time = 0s) showing mean and SEM of signals. Data for (A-C) are from the same patients and seizures as Figure 3, and data for (D-E) are from the same patients and seizures as Figure 4. Dotted vertical lines indicate seizure onset (black) or offset (green and purple for seizures associated with spared or impaired performance, respectively).