

Abstract
A lack of electrical conductivity and structural organization in currently available biomaterial scaffolds limits their utility for generating physiologically representative models of functional cardiac tissue. Here we report on the development of scalable, graphene-functionalized topographies with anisotropic electrical conductivity for engineering the structural and functional phenotypes of macroscopic cardiac tissue constructs. Guided by anisotropic electroconductive and topographic cues, the tissue constructs displayed structural property enhancement in myofibrils and sarcomeres, and exhibited significant increases in the expression of cell-cell coupling and calcium handling proteins, as well as in action potential duration and peak calcium release.
TOC image
Topographic and graphene-functionalized culture substrates were fabricated to regulate cardiac structure and function through manipulation of micro- and nano-scale mechanical and electroconductive cues.

Tissue engineering the cardiac microenvironment is critical for improving in vitro drug screening, disease modeling, and cell-based regenerative therapies1. Unfortunately, conventional cell culture systems possess several characteristics that are unrepresentative of the native cardiac tissue microenvironment2. For example, tissue scaffolds and culture substrates are typically electrically insulated, whereas heart muscles exhibit substantial conductive properties (0.03 to 0.6 S/m)3 and are integrated with electrically conductive purkinje fibers2. Additionally, many scaffolds lack fibrous architectures at the low to sub-micrometer scale, which are abundant within native cardiac extracellular matrix (ECM), and play a critical role in regulating cardiac structure and function4. Inspired by ultrastructural analysis of native heart tissue, our group previously developed anisotropic topographic substrates designed to mimic cardiac ECM fiber size and orientation4, 5. In addition, previous studies have shown that modulating the conductivity of culture substrates can have a profound impact on in vitro phenotype, providing rationale for the application of combined topographic and conductive cues to improve the biomimicry of cardiac tissue constructs6, 7. However, generating physiologically representative electrical conductivities within anisotropic topographic substrates remains challenging.
To address this need, we report a facile method for producing bioinspired topographically-defined cell culture substrates with anisotropic electroconductive properties by transferring graphene films onto polymeric topographic substrates (Fig. 1). Polyethylene glycol (PEG) was chosen as a base platform material for its biocompatibility and its demonstrated capacity to support the generation of micro- and nano-scale topographies with desired geometry and dimensions using capillary force lithographic techniques4. 800 nm groove and ridge widths (with a depth of 600 nm) were selected based on previous results demonstrating optimal dimensions for promoting structural development in cultured cardiac cells4, 5. Graphene films were synthesized via chemical vapor deposition (CVD) on copper (Cu) foil as previously described8. A thin film of poly(methyl methacrylate) (PMMA) was coated onto the graphene film and the Cu foil was then etched away in dilute HNO3. In order to prevent the graphene/PMMA film from folding up during transfer to the topographic surfaces, the PEG substrates were placed in water, with the patterned side facing up. The graphene/PMMA construct was then placed on the surface of the water with the graphene side facing down. The PEG substrate was raised up through the air-water interface at an angle to facilitate reliable and consistent contact with the graphene layer. Following transfer, the PEG/graphene/PMMA composite was left to dry overnight and the PMMA was then removed using isopropyl alcohol.
Fig. 1. Schematic illustration detailing the fabrication process for generating patterned graphene-PEG devices.
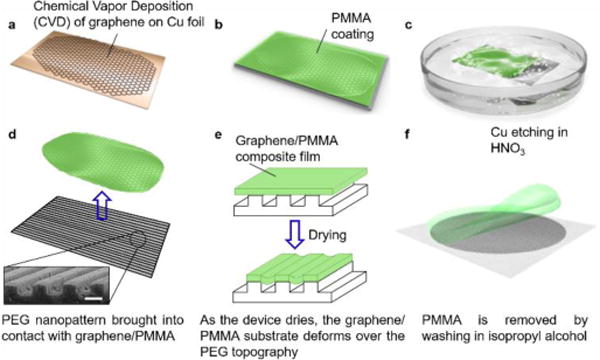
(a) A graphene layer is initially established on copper foil by CVD. (b) PMMA is spin coated on top of graphene layer. (c) The copper foil is then etched away in a bath of HNO3. (d) The graphene/PMMA composite is then placed in water to float at the air-liquid interface. PEG patterns are raised up from underneath so that the graphene slowly comes into contact with the topography. (Inset) Scanning electron microscope image of PEG topography. Scale bar: 1 μm. (e) The graphene/PMMA film on the PEG substrate is dried. The graphene/PMMA layer partially wets the micro- and nano-patterned PEG substrate, producing floating graphene/PMMA in the groove region. (f) The PMMA is removed using isopropyl alcohol, and the resulting graphene-functionalized PEG structures are then rinsed in de-ionized water prior to use.
AFM analysis showed that the deposited graphene films remained flat over the patterned ridges, but hung over the groove regions rather than conforming precisely to the contours of the underlying PEG pattern (Fig. 2a). Further analysis of AFM data highlighted that the graphene layer over the groove regions developed discrete cracks propagating in a transverse orientation to the topography. The observed cracks may have resulted from a number of factors, including the strong surface tension of the water pulling the graphene/PMMA layer as it dried, the interfacial energy between the graphene and the PEG surface, and/or the degree of resistance of the PMMA/graphene layer to deformation. The capacity for the PMMA/graphene layer to bend would be affected by both the elastic modulus of the material and the dimensions of the substrate patterns9. It is possible that the exact mechanism responsible for the cracks forming as observed is highly complex, due to the simultaneous involvement of a polymeric surface, a solid surface, a liquid interface, and topography. Studies on the effect of modulating the dimensions of the patterned substrates, the elastic modulus and thickness of the PMMA/graphene layer, and the types of solvent used for the transfer on the crack formation represent promising avenues for future study.
Fig. 2. Characterization of PEG.G topographic substrates.

(a) Representative AFM image of a graphene-PEG substrate. (b) Representative AFM image of a 1-second oxygen plasma treated graphene-PEG topography. Nanoscale tears were observed in the graphene layer (white arrows). (c) Conductive AFM analysis for PEG.G substrates. (d) Conductive AFM image of 1-second oxygen plasma treated graphene-PEG topographies. (e) I-V curves in parallel (blue) and transverse (red) across PEG.G substrates, demonstrating a significantly lower resistance in line with the topography. (f) Raman spectroscopic analysis of graphene-PEG topographic substrates with increasing oxygen plasma exposure, from 0-second (blue), to 1-second (red), and 2-seconds (green).
We utilized conductive AFM to characterize the surface conductance of our graphene-PEG patterns at the microscopic scale, where the cell-graphene interaction occurs (Fig. 2c). Interestingly, the electrical current maps highlight that the top surface of the patterned ridges were highly conductive, while the groove spaces between the ridges exhibited substantially lower conductivities, creating highly anisotropic overall conduction patterns. The lower conductivity measured within the grooves was possibly due to the observed cracks in the graphene. The ability for defects to have a significant negative impact on graphene’s conductive properties is well established10. Furthermore, previous work has shown that short-range nonsymmetric defects in graphene can give rise to orientation-dependent conductivity11. Given that the majority of cracks appeared to form within the grooves, it seems plausible that conductivity along the ridges was largely unaffected, explaining the high conductivity measurements recorded in that orientation. Conversely, conductivity in the orientation that required traversing the majority of the surface’s defects would be impaired. This assumption is borne out by our presented data and highlight the exciting possibility that specific localization of micro-tears in graphene functionalized substrates can be used to mimic nonsymmetric defects at the atomic level and facilitate development of anisotropic electrical conductivity properties at the microscale.
We also examined anisotropic electrical conductivity of our patterned graphene-PEG devices at the macroscopic scale. Analysis of I-V curves revealed that these substrates exhibited a resistance of 0.947 ± 0.018 KΩ in parallel with the orientation of the patterned ridges (Fig. 2e), indicating preservation of graphene’s highly conductive electrical properties in the direction of the pattern, even at the macroscopic scale. Conversely, when measurements were collected in the transverse orientation, the resistance was found to increase significantly to 7.071 ± 0.124 KΩ (p < 0.0001), indicating anisotropic electrical conductivity over centimeter length-scales within the engineered graphene-PEG topographic substrates. Despite the appearance of cracks in the groove regions, and the potential effect this had on conductive anisotropy, Raman spectroscopic analysis highlighted a negligible Raman peak intensity ratio of defect-related peak (D, ~1350 cm−1 and D’, ~1580 cm−1) and graphitic peak (G, ~1585 cm−1), ID/IG, in as-transferred graphene-PEG patterns. This result suggests that the deposition of graphene onto PEG substrates did not notably alter its chemical properties.
The effect of oxygen plasma on the conductivity of the graphene-PEG ridges was also investigated (Fig. 2b,d,f). AFM conductivity map analysis of plasma treated graphene-PEG topographies 1-day after fabrication showed an increase in electrical current following a 1-second oxygen-plasma treatment. Given the anisotropic electrical conductivity of these devices, the increase in conductance measured on the ridges of oxygen-plasma treated surfaces suggests such treatment further increased anisotropic electrical conductivity in these devices. The observed increase in graphene conductivity following oxygen plasma exposure was likely due to the removal of residual PMMA polymer or small molecule contaminants adsorbed on the surface from the environment during the 24 hours between fabrication and analysis. Raman spectroscopic analysis revealed that graphene samples showed an increase in the Raman peak intensity ratio, ID/IG, with increasing plasma exposure time (Fig. 2f)12, indicating the creation of defects by plasma treatment. Note that the 2-second exposure generated a significant level of graphene defects. The increase in graphene defects measured in oxygen plasma treated graphene topographies, coupled with higher conductivity on the ridges of these substrates, suggests that the majority of the generated defects occurred within the groove regions of the tested devices since defects in the ridge regions would likely have negatively affected conductivity (Fig. 2d).
The developed graphene-PEG topographic substrates were used as a tissue scaffold to investigate the combined effects of anisotropic topographic and electroconductive cues on cardiac cell structure and function. Cardiac cells were cultured for 7 days on PEG and graphene-PEG topographies and then compared for markers of structural and functional phenotype. To provide a more complete analysis of the effect of substrate conductivity on cardiac cell behavior, cardiac cells were grown on three substrates with increasing conductivities: PEG, graphene-PEG (PEG.G), and oxygen plasma treated graphene-PEG (PEG.OG).
The structural characteristics of cardiac cells maintained on PEG.G topographies were determined by immunostaining with antibodies against α–actinin, a sarcomeric protein localized to the Z disc13, and Cx43, a gap-junction protein important for electrical coupling of cardiac cells (Supplementary Fig. 1a–c)14. All three substrates promoted the development of anisotropic cell morphologies in line with the underlying topography. No significant difference in cell alignment was observed between cultures maintained on PEG, PEG.G, and PEG.OG, suggesting that the presence of cracks and/or ridges of free-standing graphene within the substrate grooves were too narrow to facilitate cell adhesion as these structures had no negative impact on cell alignment. Cardiac cells maintained on all substrate conditions were capable of forming well-defined sarcomeric striations, indicative of highly organized actin-myosin contractile units. Cx43 was expressed circumferentially on cardiac cells from all culture conditions investigated, indicating the preliminary development of gap junctions in these cells.
Sarcomere length is indicative of the degree of overlap between the thick and thin filaments within the actin-myosin contractile apparatus of muscle cells, and correlates inversely with a cell’s capacity to generate contractile force15. Confocal imaging analysis revealed that sarcomere length increased in cardiac cells plated on PEG.G or PEG.OG substrates (Supplementary Fig. 1d). Cardiac cells grown on PEG patterns had an average sarcomere length of 1.69 ± 0.13 μm, while cardiac cells grown on PEG.G and PEG.OG patterns had average sarcomere lengths of 1.97 ± 0.08 μm and 1.98 ± 0.06 μm respectively. In vivo, the alignment of multiple myofibrils ensures synchronous contraction of sarcomeres over larger length-scales, and thus more mature muscle correlates with larger z-band widths16. In this study, graphene and oxygen plasma treated graphene layers on PEG topographies resulted in the development of dramatically increased z-band widths in cultured cardiac cells (Supplementary Fig. 1e). For cardiac cells grown on PEG, the average z-band width was 3.90 ± 0.72 μm. By comparison, the z-band widths in cardiac cells grown on PEG.G and PEG.OG scaffolds were 5.83 ± 0.53 μm and 6.73 ± 0.65 μm respectively. Although z-band widths increased on PEG.G patterns compared with PEG controls, the difference was not statistically significant. However, PEG.OG patterns promoted the formation of z-bands that were significantly wider than those generated by cardiac cells on PEG controls.
Next, we examined changes in protein expression in response to different surface treatments by western blot. Noting the electro-conductive nature of graphene, the analysis focused on two proteins that regulate electrophysiological function of the heart: Cx43 and SERCA2, with GAPDH used as an internal control. Protein expression data demonstrated that Cx43 expression was increased substantially in cardiac cells maintained on PEG.G and PEG.OG patterns compared to those grown on PEG controls (Fig. 3a,b). Densitometric analysis of the collected western blot data highlighted that PEG.G and PEG.OG patterns promoted roughly 50% and 80% increases in Cx43 expression respectively, compared with PEG-only controls. Western blot analysis of the calcium handing protein, SERCA2, showed similar results; the cardiac constructs grown on PEG.G and PEG.OG patterns showed dramatic increases in levels of SERCA2 expression compared with constructs grown on PEG controls (Fig. 3c,d). Densitometric analysis revealed that PEG.OG patterns caused a 150% increase in SERCA2 expression, while PEG.G patterns increased by 90%.
Fig. 3. Analysis of calcium handling and gap junction protein expression in cardiac cells.
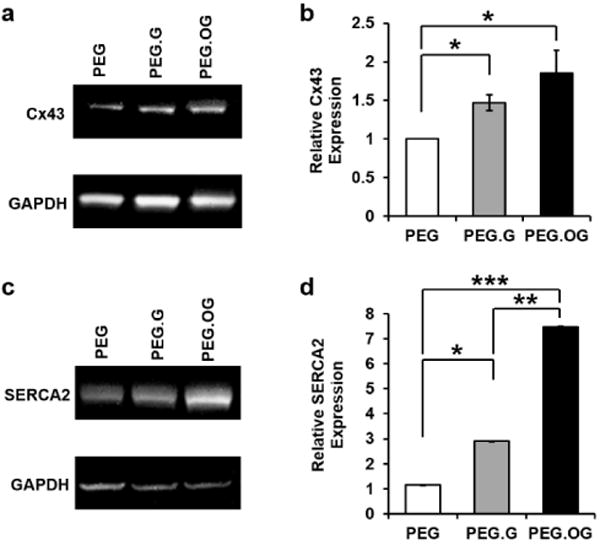
(a) Representative digitalized chemiluminescence results from western blot analyzing Cx43 expression normalized to GAPDH in PEG only (PEG), graphene-PEG (PEG.G), and oxygen plasma treated graphene-PEG (PEG.OG) patterns. (b) Quantitative analysis of blot data represented in (a). *p < 0.05. (c) Representative digitalized chemiluminescence results from western blot analyzing SERCA2 expression normalized to GAPDH. (d) Quantitative analysis of blot data represented in (c). *p < 0.05, **p < 0.01, ***p < 0.03.
To evaluate the effect of graphene on cardiac cell function directly, we performed Ca2+ imaging experiments (Fig. 4a). Ca2+ dynamics were quantified for comparison across groups by computing peak height (ΔF/F0), time to peak intensity, time to 90% decay of Ca2+ signal intensity, frequency of activation, and full widths of the Ca2+ transients at half-maximum intensity for cardiac cells on PEG, PEG.G, and PEG.OG patterns. Data analysis revealed that the intensity of the Ca2+ transients were significantly greater on PEG.OG patterns, compared with both PEG and PEG.G patterns (Fig. 4b). All other measured parameters were not significantly different across the surface treatments investigated.
Fig. 4. Analysis of electrophysiological properties in cardiac cells grown on PEG and graphene-PEG topographies.

(a) Averaged calcium transient waveforms collected from 30 second time-courses across all analyzed samples (n = 15). (b) Comparison of calcium transient amplitudes at peak across all analyzed samples. n = 15, *p < 0.01. (c) Representative temporal analysis of cardiac cell action potential waveforms derived from optical-mapping data of a PEG patterned culture. (d) Representative temporal analysis of cardiac cell action potential waveforms derived from optical-mapping data of a graphene-PEG patterned culture.
Finally, we examined action potential waveforms within engineered cardiac constructs using an optical-mapping technique (Fig. 4c,d). The system was equipped with a high spatio-temporal resolution CMOS detector and a series of spectral filters, and di-4-ANEPPS4 was used as a marker of electrophysiological activity (Supplementary Movies 1,2). Previous work has indicated that more structurally ordered cardiac cell cultures exhibit increases in action potential duration17, and extension of the depolarized plateau phase is a hallmark of maturation in ventricular electrophysiology, associated with increased expression of calcium handling proteins, particularly L-type calcium channels18. In this study, analysis of action potential waveforms showed that action potential duration at 80% repolarization (APD80) was prolonged significantly on PEG.G patterns compared with PEG controls. APD80 increased dramatically from 293 ± 2 ms to 390 ± 11 ms when cardiac cells were maintained on PEG.G patterns due to an increase in the plateau phase of the generated action potentials. Together, the increase in Ca2+ transient amplitude observed in cells cultured on PEG.OG surfaces, and the upregulation of SERCA2 protein expression in cells maintained on both PEG.G and PEG.OG patterns, suggest that graphene may promote recycling of Ca2+ to the lumen of the sarcoplasmic reticulum in cultured cardiac cells. This then enables more substantial calcium release during subsequent depolarization events, and ultimately the prolongation of the action potential plateau and an increase in APD80.
From the collected data, oxygen-plasma treatment of PEG.G patterns was found to have a more profound effect on cellular phenotype than pristine PEG.G patterns across all metrics evaluated. Oxygen plasma has been shown to improve the hydrophilicity of treated surfaces, which in turn improves cell attachment and growth19. Although no specific mechanism underlying conductive substrate-mediated cardiac cell regulation has yet been elucidated, previous electron microscope analyses have demonstrated the existence of tight physical interactions between cardiac cell membranes and conductive carbon substrates20. Such data suggest that carbon substrates possess an intrinsic ability to interact intimately with the membranes of excitable cells, and that this interaction is key to the positive phenotypic effect observed in cardiac cells grown on such surfaces. Consequently, improved hydrophilicity leading to tighter binding of cells to their culture substrate may act to enhance the maturation effect of both graphene and topographic cues on cardiac structure and function.
It is also possible that the anisotropic electrical conductivity of the PEG.G topographic substrates directly aided the structural and functional development of cardiac cells maintained on these surfaces. Previous work has shown that engineered biohybrid actuators with anisotropic electrical conductivities can be manipulated to produce cardiac sheets with significantly different excitation thresholds21. These data suggest that modulation of directional conductivity cues can impact the functional phenotype of cultured cardiac cells. This point requires further research to confirm in the context of the engineered devices presented in this manuscript, and represents an exciting target for future study. The comprehensive surface characterization data collected in this study supports the reliability of the described methods for simple and facile fabrication of topographic and graphene-functionalized culture substrates for advanced cardiac engineering applications.
Supplementary Material
Acknowledgments
This work was supported by an NIH R21 EB020132, and an NIH R01 HL135143 (awarded to D.H.K). The authors acknowledge Dr. Leslie Tung, Dr. Xiaodong Xu, Dr. David Ginger, Geran Kostecki, and Daniel Carson for their technical assistance and scientific discussion.
Footnotes
Electronic Supplementary Information (ESI) available: [details of any supplementary information available should be included here[. See DOI: 10.1039/x0xx00000x
References
- 1.Smith AS, Macadangdang J, Leung W, Laflamme MA, Kim DH. Biotechnol Adv. 2017;35:77–94. doi: 10.1016/j.biotechadv.2016.12.002. [DOI] [PMC free article] [PubMed] [Google Scholar]
- 2.Shin SR, Jung SM, Zalabany M, Kim K, Zorlutuna P, Kim Sb, Nikkhah M, Khabiry M, Azize M, Kong J, Wan K-t, Palacios T, Dokmeci MR, Bae H, Tang X, Khademhosseini A. ACS Nano. 2013;7:2369–2380. doi: 10.1021/nn305559j. [DOI] [PMC free article] [PubMed] [Google Scholar]
- 3.You JO, Rafat M, Ye GJ, Auguste DT. Nano letters. 2011;11:3643–3648. doi: 10.1021/nl201514a. [DOI] [PubMed] [Google Scholar]
- 4.Kim DH, Lipke EA, Kim P, Cheong R, Thompson S, Delannoy M, Suh KY, Tung L, Levchenko A. Proc Natl Acad Sci U S A. 2010;107:565–570. doi: 10.1073/pnas.0906504107. [DOI] [PMC free article] [PubMed] [Google Scholar]
- 5.Carson D, Hnilova M, Yang X, Nemeth CL, Tsui JH, Smith AS, Jiao A, Regnier M, Murry CE, Tamerler C, Kim DH. ACS Applied Materials & Interfaces. 2016;8:21923–21932. doi: 10.1021/acsami.5b11671. [DOI] [PMC free article] [PubMed] [Google Scholar]
- 6.Shevach M, Fleischer S, Shapira A, Dvir T. Nano letters. 2014;14:5792–5796. doi: 10.1021/nl502673m. [DOI] [PubMed] [Google Scholar]
- 7.Shin SR, Zihlmann C, Akbari M, Assawes P, Cheung L, Zhang K, Manoharan V, Zhang YS, Yuksekkaya M, Wan KT, Nikkhah M, Dokmeci MR, Tang XS, Khademhosseini A. Small. 2016;12:3677–3689. doi: 10.1002/smll.201600178. [DOI] [PMC free article] [PubMed] [Google Scholar]
- 8.Li X, Cai W, An J, Kim S, Nah J, Yang D, Piner R, Velamakanni A, Jung I, Tutuc E, Banerjee SK, Colombo L, Ruoff RS. Science. 2009;324:1312–1314. doi: 10.1126/science.1171245. [DOI] [PubMed] [Google Scholar]
- 9.Kim J, Wang Y, Park H, Park MC, Moon SE, Hong SM, Koo CM, Suh KY, Yang S, Cho H. Advanced Materials. 2017:29. doi: 10.1002/adma.201605078. [DOI] [PubMed] [Google Scholar]
- 10.Banhart F, Kotakoski J, Krasheninnikov AV. ACS Nano. 2011;5:26–41. doi: 10.1021/nn102598m. [DOI] [PubMed] [Google Scholar]
- 11.Vasko FT. Applied Physics Letters. 2010;96:212103. [Google Scholar]
- 12.Malard L, Pimenta M, Dresselhaus G, Dresselhaus M. Physics Reports. 2009;473:51–87. [Google Scholar]
- 13.Guan K, Fürst DO, Wobus AM. European Journal of Cell Biology. 1999;78:813–823. doi: 10.1016/S0171-9335(99)80032-6. [DOI] [PubMed] [Google Scholar]
- 14.Huang GY, Wessels A, Smith BR, Linask KK, Ewart JL, Lo CW. Developmental Biology. 1998;198:32–44. doi: 10.1006/dbio.1998.8891. [DOI] [PubMed] [Google Scholar]
- 15.Hibberd M, Jewell B. The Journal of Physiology. 1982;329:527. doi: 10.1113/jphysiol.1982.sp014317. [DOI] [PMC free article] [PubMed] [Google Scholar]
- 16.Rodriguez AG, Rodriguez ML, Han SJ, Sniadecki NJ, Regnier M. Integrative Biology. 2013;5:1366–1373. doi: 10.1039/c3ib40135a. [DOI] [PMC free article] [PubMed] [Google Scholar]
- 17.Feinberg AW, Alford PW, Jin H, Ripplinger CM, Werdich AA, Sheehy SP, Grosberg A, Parker KK. Biomaterials. 2012;33:5732–5741. doi: 10.1016/j.biomaterials.2012.04.043. [DOI] [PMC free article] [PubMed] [Google Scholar]
- 18.Faber GM, Silva J, Livshitz L, Rudy Y. Biophysical journal. 2007;92:1522–1543. doi: 10.1529/biophysj.106.088807. [DOI] [PMC free article] [PubMed] [Google Scholar]
- 19.Pappa AM, Karagkiozaki V, Krol S, Kassavetis S, Konstantinou D, Pitsalidis C, Tzounis L, Pliatsikas N, Logothetidis S. Beilstein Journal of Nanotechnology. 2015;6:254–262. doi: 10.3762/bjnano.6.24. [DOI] [PMC free article] [PubMed] [Google Scholar]
- 20.Martinelli V, Cellot G, Toma FM, Long CS, Caldwell JH, Zentilin L, Giacca M, Turco A, Prato M, Ballerini L. ACS Nano. 2013;7:5746–5756. doi: 10.1021/nn4002193. [DOI] [PubMed] [Google Scholar]
- 21.Shin SR, Shin C, Memic A, Shadmehr S, Miscuglio M, Jung HY, Jung SM, Bae H, Khademhosseini A, Tang XS, Dokmeci MR. Adv Funct Mater. 2015;25:4486–4495. doi: 10.1002/adfm.201501379. [DOI] [PMC free article] [PubMed] [Google Scholar]
Associated Data
This section collects any data citations, data availability statements, or supplementary materials included in this article.