

Abstract
Objective
To test the validity of wearable inertial sensors to provide objective measures of postural stepping responses to the Push and Release clinical test in people with multiple sclerosis
Design
Cross-sectional
Setting
University medical center balance disorders laboratory
Participants
52 PwMS and 21 age-matched healthy controls
Main Outcome Measures
stepping latency, time and number of steps required to reach stability, and initial step length were calculated from three inertial measurement units placed on participants’ lumbar spine and feet.
Results
Correlations between the inertial sensor measures and measures obtained from the laboratory-based systems were moderate to strong and statistically significant for all variables: time to release (r = 0.992), latency (r = 0.655), time to stability (r = 0.847), time of first heel strike (r = 0.665), number of steps (r = 0.825) and first step length (r = 0.592). Compared to healthy controls, PwMS demonstrated a longer time to stability and required a larger number of steps to reach stability.
Conclusions
The instrumented Push and Release test (IPUSH) is a valid measure of postural responses in PwMS and could be used as a clinical outcome measures for patient care decisions or for clinical trials aimed at improving postural control in PwMS.
Keywords: Movement disorders, multiple sclerosis, postural control, Push and Release, inertial sensors
Introduction
Impaired balance is a major contributor to mobility disability and falls in people with multiple sclerosis (PwMS)1, 2. However, quantification of balance impairment in the clinic remains a challenge. Laboratory-based movement assessment tools, such as motion capture systems and force plates, could provide the level of sensitivity necessary to identify subtle changes in balance in PwMS that may be indicative of fall risk1, 3–7; however they are extremely expensive and difficult to use. Clinical outcome measures such as timed tests of gait speed, descriptive balance rating scales, or large-scale studies of fall-counts to describe balance or mobility impairment often lack the sensitivity and precision to detect small changes balance. Indeed, gait and balance are affected in PwMS even in the absence of clinical disability8 as measured by clinical outcomes. Despite these challenges, the ability to provide accurate stratification of patients remains critical for clinical trials of novel therapeutics. The lack of accurate, objective, and portable systems that can be used to provide measures of postural control greatly impedes the development and testing of new treatments to improve mobility in PwMS and in other patients with balance disorders.
Although the availability of relatively inexpensive, wearable wireless inertial sensors has great potential to allow sensitive measurement of balance and gait in clinical environments, this technology is not yet available as a clinical assessment tool despite its potential for use in clinical environments9–11. No studies have yet instrumented postural responses to external perturbations using body-worn, inertial sensors in order to provide objective measures for clinicians. However, evaluation of postural responses during standing is a key component to the neurological examination of people with movement disorders. Abnormal postural response to perturbations separates patients with intact balance control from patients with balance disorders12. The Push and Release Test is a sensitive measure to assess postural responses using manual perturbation13, 14. The test involves having the participant lean backward against palms of the examiner’s hands while the examiner allows backward tilt of the participant’s trunk. When participant’s trunk and hips move to a stable position with an approximate inclination angle of 10 degrees, where the participant’s center of pressure is outside of their base of support, the examiner suddenly removes their hands, requiring the participant to take a backward compensatory step to regain balance15.
Any delay in initiating a backward step or too small a step results in multiple steps and could result in the loss of equilibrium. Previous studies have shown that in Parkinson’s disease patients, the Push and Release test reveals no step initiation delay at the moment of release, but patients take more backward steps to recover balance than age matched healthy adults14. PwMS have delayed somatosensory conduction times associated with delayed postural responses to surface translation16, 17. Therefore, it is likely that during the Push and Release Test, PwMS could have a delayed step initiation of their backward step, which may result in more steps to recover and a longer time to reach stability. Our previous studies have shown PwMS have delayed somatosensory conduction velocity16 and this delayed conduction velocity is related to delayed postural responses16. Also, delayed postural responses in PwMS are related to postural sway during standing and trunk motion during gait17 and to COM motion and step latency during stepping response perturbations18. Thus, delayed stepping initiation in PwMS could be representative of and likely related to their somatosensory conduction delays as a result of demyelination16.
We instrumented the Push and Release test by incorporating wireless inertial sensors to measure postural response dysfunction. Creating an instrumented Push and Release Test (IPUSH) through the use of wireless sensors could increase the ability to quantitatively and accurately assess these critical postural response measures in a clinical environment.
The primary aim of this study was to develop and evaluate the validity of an instrumented version of the Push and Release Test (IPUSH) for use in PwMS. We validated measures obtained via inertial sensor against measures obtained from gold standard laboratory equipment and we included both healthy controls and PwMS in the study. We hypothesized that the IPUSH provides valid measures of postural response that correlate with laboratory-based measures obtained from motion analysis system, force platform, and force gloves in both PwMS and control groups. As a secondary aim, we also evaluated group difference in the inertial sensor measures between PwMS and healthy controls. Because PwMS have altered postural sway1, 19 and altered responses to postural translations16, 17 compared to healthy controls, we hypothesized that IPUSH measures would also be different between groups. The IPUSH is effectively a clinical assessment tool incorporating wireless inertial sensors to determine postural response dysfunction. Eventually, the IPUSH could be added to existing clinical movement assessment tools to provide clinicians with objective, sensitive measures of impaired postural stepping responses in PwMS.
Methods
2.1 Participants
Participants were recruited on through the Multiple Sclerosis Center at the Oregon Health & Science University. The university’s institutional review board approved the research protocol and all participants provided consent. Demographics are listed in Table 1. Power analysis on the postural response latencies measured within PwMS17 suggested inclusion of at least 40 PwMS. Inclusion criteria for PwMS were: a clinical diagnosis of MS, aged 21–70, ability to complete a 25 foot walk without an assistive device or brace, ability to provide informed consent, ability to follow directions in English, no relapses within the previous 60 days, no use of Fampridine, and no other known biomechanical or neurological conditions affecting stepping or balance. Individuals were excluded if they exhibited any orthopedic (e.g. arthritis, joint replacement) or neurological conditions, other than MS, (e.g. vestibular dysfunction, Parkinson’s disease, lupus, fibromyalgia) that affect gait or balance or limit participation.
Table 1.
Participant demographics for persons with multiple sclerosis (PwMS) and healthy controls (HC).
| PwMS n = 52 |
HC n = 21 |
|
|---|---|---|
| Age (yrs) | 49.5 ± 9.8 | 49.9 ± 11.9 |
| Gender | 41F/11M | 14F/7M |
| BMI (kg/m2) | 25.3 ± 4.7 | 25.6 ± 5.6 |
| MS diagnosis (RR/SP/PP) | 33/13/6 | – |
| Years since diagnosis | 12.7 ± 10.6 | – |
| srEDSS | 4.3 ± 0.9 | – |
BMI – body mass index; F – female; M – male; RR – relapsing remitting; SP – secondary progressive; PP – primary progressive; srEDSS – self-reported Expanded Disability Status scale
2.2 Data Collection
The participants were instrumented with three Opal inertial sensors (APDM, Inc., Portland, OR) that included triaxial accelerometers and gyroscopes (128Hz). The Opals were securely attached at the lower lumbar vertebral level and on the top of right and left foot posterior to the metatarsals and anterior to the ankle, along the midline. These wireless sensors have previously been shown to have good discriminative validity when examining postural sway measures in early MS20. To calculate body center of mass and step lengths, reflective markers were placed on bilateral anterior and posterior suprailiac spines, lateral knee, lateral malleolus, first and fifth metatarsophalangeal joint, heel, lateral wrists, and the lumbar spine15. Positions of reflective markers were tracked using an 8-camera motion analysis system (120 Hz) (Motion Analysis, Inc, Santa Rosa, CA). Participants stood on two AMTI force-plates (480 Hz)21 that provided the latency of step onset. The examiner was wearing on/off pressure-sensing gloves to measure examiner release time initiating the fall perturbation (960 Hz). Figure 1 demonstrates the clinical application of the Push and Release Test (left and middle) as well as the experimental set up for the IPUSH (right). Trials were separated by approximately 20 seconds, and participants were allowed longer breaks if they requested. Three push and release trials were performed for each participant15. Smith et al.15 showed that there was not a significant difference in latency from release to step initiation when comparing the first trial, the average of the first 3 trials and the average of all 10 trials during the Push and Release test. However, first trials can cause an excessively large startle response22. Therefore, we used the average of 3 trials to represent a participant’s postural responses without requiring an excessive number of trials.
Figure 1.
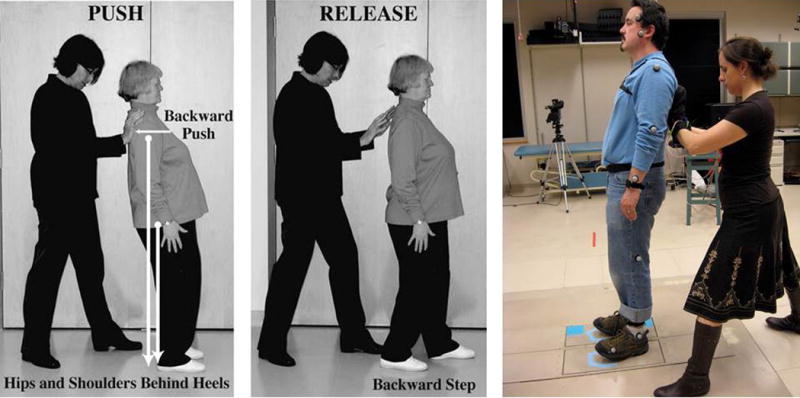
Clinician demonstrating the Push, where patient leans backwards (left) and Release (middle) portions of the PUSH test. Laboratory testing of IPUSH with electronic gloves, force plates and inertial sensors on ankles, trunk and wrists (right).
Inertial Sensor Outcomes
Custom automatic Matlab algorithms were developed to utilize the inertial sensors to identify specific events in the Push and Release Test. We used the acceleration and rotational rate time series from each sensor to detect various events. These time series were low pass filtered with a cutoff frequency of 10 Hz based on examination of the spectrum of these time series. Another custom Matlab code was used to calculate the specific events from motion analysis, force platform, and force sensing glove time series data. The automatic algorithm used a graphical display showing inertial sensor signals and detected temporal events. Figure 2 shows an example of a complete acceleration time series data from the three sensors with the temporal events identified which were used to calculated specific events.
Figure 2.

One trial of push and release for one representative participant with MS. Total acceleration signals – lumbar (black), right foot (bright red) and left foot (blue) sensor. Time of detected events is shown with vertical lines - time of release (yellow line) was detected, first leg movement (green line), participant stopped moving and reached stability (dark red).
The specific events detected using the wireless inertial sensors and reference laboratory measures were:
1) Time of Release (seconds)
Release time measures the time when the examiner removed their hands allowing the participant to start falling. All other objective measures are calculated relative to this Time of Release, which was detected when the lumbar spine acceleration exceeded 5% of gravity (9.81 m/s2), and rotational rate is >5°. The reference Time of Release was detected when the pressure sensor on either the left or right hand of the pressure sensitive gloves read zero15.
2) Latency of Postural Response (seconds)
Latency is the time between Time of Release and the initiation of the first step. First step initiation was detected when the foot acceleration exceeded 7% of gravity, and rotational rate is >7°/s. The reference Latency was the time that either the left or right force platform registered zero.
3) Time of First Heel Strike (seconds)
Time of heel strike is the time between release and instant of first heel strike, and is used to calculate the first step length. First Heel strike was detected using time of the first peak of total acceleration over 18 m/s2 of the foot occurring after Time of Release. The reference First Heel Strike was identified as the time point when average anterior/posterior velocity of the heel and toe markers was below 0.15 m/s. Time of First Heel Strike was measured as the time from release to heel strike of the first moving leg.
4) Time to Reach Stability (seconds)
Time to reach stability is the time between release and instant of trunk becoming stationary, and was detected when acceleration of the lumbar sensor was <7% of gravity, and the rotational rate was <7°. The reference Time to Reach Stability was calculated as the difference between instant of the last foot heel strike from motion analysis and Time of Release from the instrumented gloves.
5) Number of Steps
The number of left and right foot steps to reach stability, calculated using the number of detected heel strikes of the left and right foot from foot sensors. The reference Number of Steps was calculated as the number of heel strikes of the left and right foot from motion analysis.
6) Step Length (meters)
The length of the first step, calculated using double integral of the acceleration of foot acceleration in the anterior/posterior plane. The reference Step Length was calculated as the anterior/posterior distance between the left and right heel markers at first foot contact from motion analysis.
Clinical Outcomes
The PwMS completed the self-reported Expanded Disability Status Scale (srEDSS) as a general classification of global MS-related disability level that correlates strongly23 with the clinician administered version. The PwMS were also rated according to the European Database of Multiple Sclerosis Scale of Disability (EDMUS), a standardized clinical description scale24. Patients also completed three, fast-as-possible, 25-foot walks to establish the T25FW, the most frequently used gait measure in MS clinical trials.25
2.3 Statistical Analysis
Shapiro-Wilk test indicated the data was not normally distributed so Spearman’s rank correlation coefficient was used to report agreement between the wireless inertial sensor measures and the laboratory reference measures as well as between wireless inertial sensor measures and clinical outcomes (srEDSS, EDMUS, 25FTW). Agreement between the measures was quantified using Bland-Altman plots. Group differences in IPUSH measures between the PwMS and healthy controls (HC), were evaluated with non-parametric Mann-Whitney test. A Type I error rate less than or equal to 0.05 was chosen as the indication of statistical significance.
Results
3.1 Relationships between wireless inertial sensor measures and laboratory based measures
Across all participants and within the PwMS or HC groups alone, there were significant correlations between the inertial sensors and laboratory reference measures (Table 2; Figure 3). All correlations were statistically significant (p<0.05). Time of Release was also significantly correlated between systems across all participants (r=0.993, p<0.05) and within PwMS (r=0.992, p<0.05) and HC group (r=994, p<0.05). Bland-Altman plots show strong agreement between both systems for all measures (Figure 4).
Table 2.
Correlations between inertial sensor and laboratory based measures.
| All Subjects | MS group only | HC Group only | |
|---|---|---|---|
| Time to Release (sec) | 0.992* | 0.992* | 0.993* |
| Step Latency (sec) | 0.655* | 0.645* | 0.690* |
| Time to Reach Stability (sec) | 0.847* | 0.810* | 0.874* |
| Time of First Heel Strike (sec) | 0.665* | 0.649* | 0.731* |
| Number of Steps | 0.825* | 0.829* | 0.837* |
| Step Length (m) | 0.592* | 0.585* | 0.771* |
Significant correlation (p < 0.05).
MS – multiple sclerosis
HC – healthy control
Figure 3.
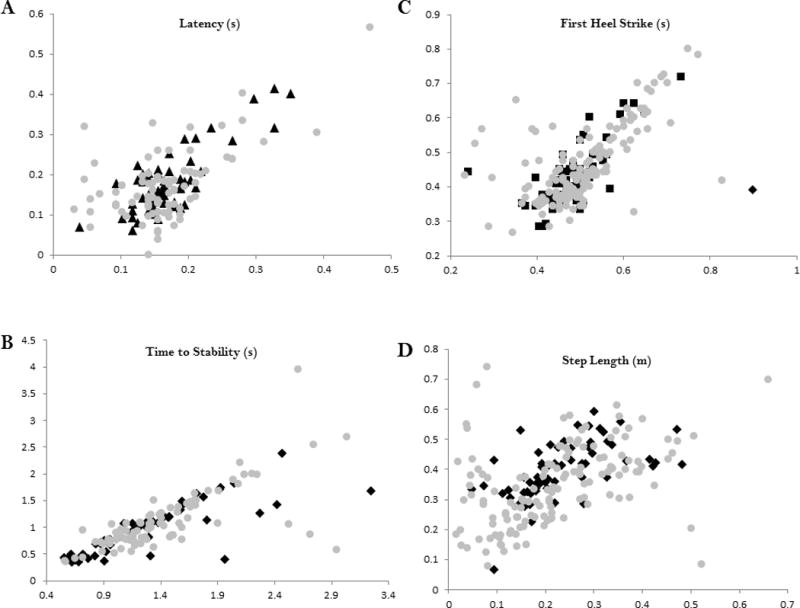
Scatterplots showing the relationship across all participants between wireless inertial sensor measures and laboratory based measures. A - Latency (r = 0.655), B - Time to Stability (r = 0.874), C - Time to First Heel Strike (r = 0.665), D - Step Length (r = 0.592). Number of Steps was not included as a scatterplot since it is not a continuous variable. For all measures, y-axis is the wireless inertial sensor value and x-axis is laboratory based reference value. Gray circles – persons with MS; Black squares – control participants.
Figure 4.
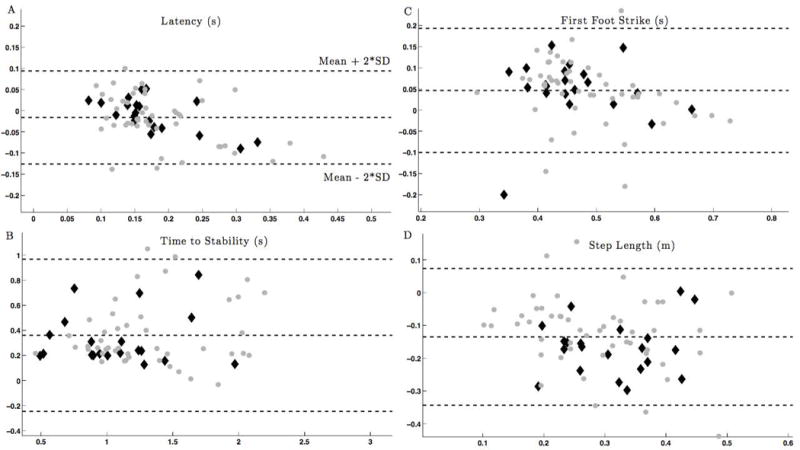
Bland-Altman plot showing the agreement between measured by the inertial system and motion analysis. Gray circles – persons with MS; Black diamonds–control subjects.
A - Latency, B - Time to Stability, C - Time to First Heel Strike, D - Step Length. Gray squares – persons with MS; Black diamonds–healthy control participants. The average value from both systems is shown along the x-axis, with the difference in values between each system on the y-axis
3.2 Group differences in inertial sensor measures
PwMS had significantly longer Time to Reach Stability (p=0.033) and required significantly more steps to reach stability (p=0.024) compared to HC (Table 3). No difference between groups in postural response latency, time to first heel strike or step length was found.
Table 3.
Group differences in IPUSH measures
| PwMS (mean ± SD) |
HC (mean ± SD) |
p-value | |
|---|---|---|---|
| Step Latency (sec) | 0.18 ± 0.07 | 0.17 ± 0.05 | 0.853 |
| Time to Reach Stability (sec) | 1.57 ± 0.53 | 1.27 ± 0.43 | 0.033* |
| Time to First Heel Strike (sec) | 0.51 ± 0.08 | 0.49 ± 0.09 | 0.401 |
| Number of Steps | 2.69 ± 1.02 | 2.12 ± 0.99 | 0.024* |
| Step Length (m) | 0.22 ± 0.10 | 0.23 ± 0.09 | 0.828 |
Significant difference between groups (p < 0.05).
PwMS – persons with multiple sclerosis
HC – healthy controls
3.3 Relationships between wireless inertial sensor measures and clinical tests in PwMS
Within PwMS, there were significant correlations between the clinical scores and Latency, Time to Reach Stability, and First Heel Strike measured with wireless inertial sensors (Table 4).
Table 4.
Correlations between clinical tests and IPUSH measures in PwMS only
| T25FW (sec) | srEDSS | EDMUS | |
|---|---|---|---|
| Step Latency (sec) | 0.362* | 0.331* | 0.364* |
| Time to Reach Stability (sec) | 0.483* | 0.348* | 0.470* |
| Time to First Heel Strike (sec) | 0.444* | 0.316* | 0.342* |
| Number of Steps | 0.279 | 0.169 | 0.241 |
| Step Length (m) | −0.086 | −0.178 | −0.053 |
Significant correlation (p < 0.05).
T25FTW – timed 25 foot walk
srEDSS – self reported expanded disability status scale
EDMUS – European database of multiple sclerosis scale of disability
Discussion
This is the first study to use body-worn inertial sensors to quantify postural stepping responses using a clinical protocol in PwMS. Findings support our hypothesis that measures identified from inertial sensors during the IPUSH are significantly correlated to gold standard laboratory based reference measures. In fact, all IPUSH measures showed moderate to strong correlations26 with laboratory reference measures (Table 2). In addition, we demonstrated that some IPUSH measures were sensitive to MS and were correlated to clinical tests of mobility (Table 4), highlighting the clinical validity of the IPUSH.
PwMS have delayed somatosensory conduction velocity16 as well as central myelin loss in cortical and subcortical areas that contribute to balance dysfunction17. Our previous study of postural responses with feet in place to computerized surface translations demonstrated longer than normal latencies in PwMS that were related to the delays in somatosensory conduction up the spinal cord16. In the current study, it is possible that Latency and Time to First Heel Strike in PwMS were normal because participants could anticipate the perturbation and start to step prior to release. For example, it is possible that PwMS had higher arousal levels and perhaps baseline EMG activity, hastening step onset. Indeed, our previous laboratory study showed that PwMS anticipated postural responses more than normal and the longer the latency the more anticipatory compensation they use16.
Currently, clinical trials in PwMS are conducted with timed tests of gait speed, descriptive balance rating scales, or time-consuming, large-scale studies of fall-counts. The T25FW, the most frequently used gait measure in MS clinical trials, is known to suffer from floor and ceiling effects that limit its sensitivity to intervention25. In the present study, we show that the IPUSH measures Latency, Time to Reach Stability, and Time to First Heel Strike were all significantly correlated with the T25FW indicating both the clinical utility and clinical validity of the IPUSH measures. In addition, these measures were correlated with patient’s self-reported disability (srEDSS and EDMUS) indicating further clinical validity as both of these scales may be used by clinicians to classify disability of PwMS.
Our second hypothesis was partially supported since the IPUSH measures revealed statistically significant differences between MS and control groups for the time and number of steps required to regain postural stability (Table 3). Stepping latency in PwMS was longer, but not significantly different compared to the control group. Previous laboratory studies report increased latencies in response to forward and backward stepping elicited by surface translations in PwMS compared to HC group18. In the present study, stepping was initiated as a compensatory step from a leaning position rather than as a result of surface translation. In this leaning position, the participant’s center of mass was already outside of their base of support. Despite instruction to relax as much as possible, it is possible that PwMS may have exhibited higher levels of muscle excitation prior to release than healthy adults, thus reducing step latency in this group. Smith et al15 previously reported some shorter than possible step initiation latencies during the Push and Release Test likely indicating that participants may have been anticipating the release. In addition, more challenging postural perturbations have been shown to increase amplitude of postural responses27. PwMS may have perceived the Push and Release task as more challenging than HC due to altered anticipatory and compensatory postural responses18, 28, therefore differentially reducing step latency in this group by anticipating the perturbation. Finally, the PwMS recruited for the current study were more mild than some previous support surface perturbation investigations16, thus partially explaining the smaller latency difference between PwMS and HC groups. PwMS did show an increased amount of time to stability and an increased number of steps needed to reach stability. These delays are likely the result of sensorimotor delays in PwMS that would cause delayed muscle activation necessary to perform multiple steps. Thus, the utility of the IPUSH measures to represent postural responses in PwMS is supported.
4.1 Study Limitations
While the MS group is not homogenous in disease severity or symptom severity, including a heterogeneous disability group allowed for a range of postural responses for the IPUSH measures to assess and strengthens the generalizability of the validity of the IPUSH for use in all ambulatory PwMS. One challenge to apply the IPUSH test clinically is to reliably calibrate the perturbation. In the present study, the personnel administering the test (authors DP & GD), had extensive experience in working with the population and the test and a previous study showed that the trunk lean angle of participants across 10 trials of the Push and Release was acceptably reliable. However, it would be of interest to include sensor feedback to the examiner regarding real-time trunk angle.
Conclusions
The present study demonstrates agreement between the wireless inertial sensor and laboratory reference based measures for the IPUSH test of postural stepping responses. This validity is evidence that the IPUSH could be used for clinical assessment of balance in PwMS. The IPUSH can provide objective measures of postural response impairments that previously could only be obtained with complex laboratory based methods. These measures can be used to identify specific postural response impairments early in the disease, to identify changes in postural responses due to disease progression, and to evaluate the effectiveness of treatments aimed at restoring postural control.
Acknowledgments
Financial support
We would like to acknowledge the assistance of Jessica Nguyen and Austen Yeager for their help with data collection. This work was supported by grants from the National Multiple Sclerosis Society (RG 4914A1/2; PI: JH), the NIH National Center for Advancing Translational Science (1KL2TR000119; PI: JH), the United States Department of Veteran’s Affairs Rehabilitation Research and Development Service (Career Development Award-1: #I01BX007080; PI: DP) & VA Merit Award (E1075-R; PI: FH), NIH (R01 AG006457 29 PI: FH), and the Medical Research Foundation of Oregon (Early Investigator Award; PI: DP).
Abbreviations
- PwMS
persons with multiple sclerosis
- HC
healthy control participants
- IPUSH
Instrumented Push and Release Test
- srEDSS
self reported Expanded Disability Status Scale
- EDMUS
European Database of Multiple Sclerosis Scale of Disability
- T25FW
timed 25 foot walk
Footnotes
Conflict of interests
Dr. Horak and OHSU have significant financial interests in APDM, a company that might have a commercial interest in the results of this research and technology. This potential conflict of interest has been reviewed and managed by OHSU and the Integrity Oversight Council. Dr. El-Gohary works at APDM. No other authors declare any conflict of interest.
Suppliers List
Opal inertial sensors (APDM, Inc., Portland, OR)
8-camera motion analysis system (Motion Analysis, Inc, Santa Rosa, CA)
Force platforms (AMTI, Inc, Watertown, MA)
Matlab (Mathworks, Inc, Natick, MA)
References
- 1.Sosnoff JJ, Shin S, Motl RW. Multiple sclerosis and postural control: the role of spasticity. Archives of physical medicine and rehabilitation. 2010;91(1):93. doi: 10.1016/j.apmr.2009.09.013. [DOI] [PubMed] [Google Scholar]
- 2.Karst GM, Venema DM, Roehrs TG, Tyler AE. Center of pressure measures during standing tasks in minimally impaired persons with multiple sclerosis. Journal of neurologic physical therapy : JNPT. 2005;29(4):170. doi: 10.1097/01.npt.0000282314.40230.40. [DOI] [PubMed] [Google Scholar]
- 3.Cattaneo D, Jonsdottir J. Sensory impairments in quiet standing in subjects with multiple sclerosis. Multiple sclerosis (Houndmills, Basingstoke, England) 2009;15(1):59. doi: 10.1177/1352458508096874. [DOI] [PubMed] [Google Scholar]
- 4.Huisinga JM, Filipi M, Stergiou N. Supervised resistance training results in changes in postural control in multiple sclerosis patients. Motor control. 2011;16(1):50–63. doi: 10.1123/mcj.16.1.50. [DOI] [PubMed] [Google Scholar]
- 5.Wurdeman SR, Huisinga JM, Filipi M, Stergiou N. Multiple sclerosis affects the frequency content in the vertical ground reaction forces during walking. Clinical biomechanics. 2011;26(2):207–12. doi: 10.1016/j.clinbiomech.2010.09.021. [DOI] [PMC free article] [PubMed] [Google Scholar]
- 6.Huisinga JM, Filipi ML, Schmid KK, Stergiou N. Is there a relationship between fatigue questioinnaires and gait mechanics in persons with multiple sclerosis? Archives of Physical Medicine and Rehabilitation. 2011;92(10):1594–601. doi: 10.1016/j.apmr.2011.05.017. [DOI] [PubMed] [Google Scholar]
- 7.Huisinga JM, Schmid KK, Filipi ML, Stergiou N. Persons with multiple sclerosis show altered joint kinetics during walking after participating in elliptical exercise. Journal of applied biomechanics. 2012;28(3):249–57. doi: 10.1123/jab.28.3.249. [DOI] [PubMed] [Google Scholar]
- 8.Martin CL, Phillips BA, Kilpatrick TJ, Butzkueven H, Tubridy N, McDonald E, et al. Gait and balance impairment in early multiple sclerosis in the absence of clinical disability. Multiple sclerosis (Houndmills, Basingstoke, England) 2006;12(5):620. doi: 10.1177/1352458506070658. [DOI] [PubMed] [Google Scholar]
- 9.El-Gohary M, Smith B, Carlson-Kuhta P, Horak F. Instrumented push and release test (ipush) for postural responses using wearable inertial sensors. San Diego, CA: Society for Neuroscience; 2013. [Google Scholar]
- 10.Spain RI, St George RJ, Salarian A, Mancini M, Wagner JM, Horak FB, et al. Body-worn motion sensors detect balance and gait deficits in people with multiple sclerosis who have normal walking speed. Gait & posture. 2012 doi: 10.1016/j.gaitpost.2011.11.026. [DOI] [PMC free article] [PubMed] [Google Scholar]
- 11.El-Gohary M, McNames J, Chung K, Aboy M, Salarian A, Horak F. Continuous At-Home Monitoring of Tremor in Patients with Parkinson’s Disease. Analysis of Biomedical Signals and Images. 2010;20:420–4. [Google Scholar]
- 12.Horak FB. Postural orientation and equilibrium: what do we need to know about neural control of balance to prevent falls? Age and Ageing. 2006;35(Suppl 2):ii7. doi: 10.1093/ageing/afl077. [DOI] [PubMed] [Google Scholar]
- 13.Horak FB, Wrisley DM, Frank J. The Balance Evaluation Systems Test (BESTest) to differentiate balance deficits. Physical therapy. 2009;89(5):484–98. doi: 10.2522/ptj.20080071. [DOI] [PMC free article] [PubMed] [Google Scholar]
- 14.Jacobs JV, Horak FB, Van Tran K, Nutt JG. An alternative clinical postural stability test for patients with Parkinson’s disease. Journal of neurology. 2006;253(11):1404–13. doi: 10.1007/s00415-006-0224-x. [DOI] [PubMed] [Google Scholar]
- 15.Smith BA, Carlson-Kuhta P, Horak FB. Consistency in Administration and Response for the Backward Push and Release Test: A Clinical Assessment of Postural Responses. Physiotherapy research international : the journal for researchers and clinicians in physical therapy. 2014 doi: 10.1002/pri.1615. epub. [DOI] [PMC free article] [PubMed] [Google Scholar]
- 16.Cameron MH, Horak FB, Herndon RR, Bourdette D. Imbalance in multiple sclerosis: a result of slowed spinal somatosensory conduction. Somatosensory & motor research. 2008;25(2):113. doi: 10.1080/08990220802131127. [DOI] [PMC free article] [PubMed] [Google Scholar]
- 17.Huisinga JM, St George RJ, Spain R, Overs S, Horak FB. Postural response latencies are related to balance control during standing and walking in patients with multiple sclerosis. Archives of physical medicine and rehabilitation. 2014;95(7):1390–7. doi: 10.1016/j.apmr.2014.01.004. [DOI] [PMC free article] [PubMed] [Google Scholar]
- 18.Peterson D, Huisinga JM, Spain R, Horak FB. Characterization of compensatory stepping in people with multiple sclerosis. Archives of physical medicine and rehabilitation. 2015 doi: 10.1016/j.apmr.2015.10.103. epub. [DOI] [PMC free article] [PubMed] [Google Scholar]
- 19.Huisinga JM, Yentes JM, Filipi ML, Stergiou N. Postural control strategy during standing is altered in patients with multiple sclerosis. Neuroscience letters. 2012 doi: 10.1016/j.neulet.2012.07.020. [DOI] [PubMed] [Google Scholar]
- 20.Solomon AJ, Jacobs JV, Lomond KV, Henry SM. Detection of postural sway abnormalities by wireless inertial sensors in minimally disabled patients with multiple sclerosis: a case-control study. Journal of neuroengineering and rehabilitation. 2015;12:74. doi: 10.1186/s12984-015-0066-9. [DOI] [PMC free article] [PubMed] [Google Scholar]
- 21.Horak FB, Nashner LM. Central programming of postural movements: adaptation to altered support-surface configurations. J Neurophysiol. 1986;55(6):1369–81. doi: 10.1152/jn.1986.55.6.1369. [DOI] [PubMed] [Google Scholar]
- 22.Allum JH, Tang KS, Carpenter MG, Oude Nijhuis LB, Bloem BR. Review of first trial responses in balance control: influence of vestibular loss and Parkinson’s disease. Human movement science. 2011;30(2):279–95. doi: 10.1016/j.humov.2010.11.009. [DOI] [PubMed] [Google Scholar]
- 23.Bowen J, Gibbons L, Gianas A, Kraft GH. Self-administered Expanded Disability Status Scale with functional system scores correlates well with a physician-administered test. Multiple sclerosis. 2001;7(3):201–6. doi: 10.1177/135245850100700311. [DOI] [PubMed] [Google Scholar]
- 24.Amato MP, Grimaud J, Achiti I, Bartolozzi ML, Adeleine P, Hartung HP, et al. European validation of a standardized clinical description of multiple sclerosis. Journal of neurology. 2004;251(12):1472–80. doi: 10.1007/s00415-004-0567-0. [DOI] [PubMed] [Google Scholar]
- 25.Kaufman M, Moyer D, Norton J. The significant change for the Timed 25-foot Walk in the multiple sclerosis functional composite. Mult Scler. 2000;6(4):286–90. doi: 10.1177/135245850000600411. [DOI] [PubMed] [Google Scholar]
- 26.Cohen J. Statistical Power Analysis for the Behavioral Sciences. 2nd. New York City: Routledge Academic; 1988. [Google Scholar]
- 27.Horak FB, Henry SM, Shumway-Cook A. Postural perturbations: new insights for treatment of balance disorders. Phys Ther. 1997;77(5):517–33. doi: 10.1093/ptj/77.5.517. [DOI] [PubMed] [Google Scholar]
- 28.Aruin AS, Kanekar N, Lee YJ. Anticipatory and compensatory postural adjustments in individuals with multiple sclerosis in response to external perturbations. Neuroscience letters. 2015;591:182–6. doi: 10.1016/j.neulet.2015.02.050. [DOI] [PubMed] [Google Scholar]