
Figure 4.
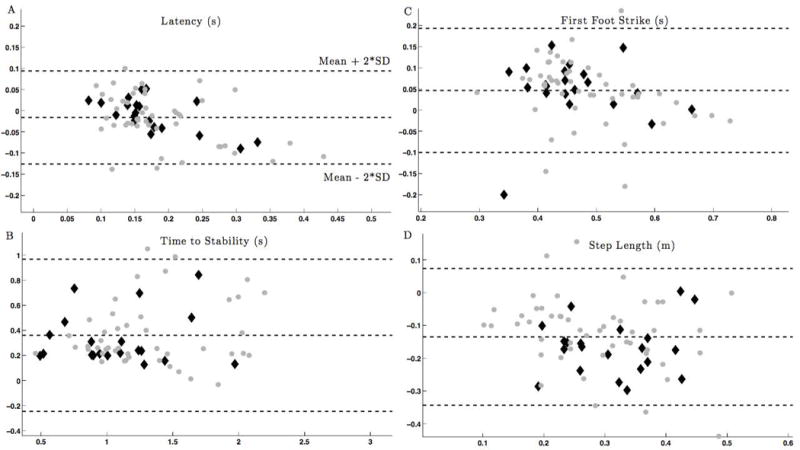
Bland-Altman plot showing the agreement between measured by the inertial system and motion analysis. Gray circles – persons with MS; Black diamonds–control subjects.
A - Latency, B - Time to Stability, C - Time to First Heel Strike, D - Step Length. Gray squares – persons with MS; Black diamonds–healthy control participants. The average value from both systems is shown along the x-axis, with the difference in values between each system on the y-axis