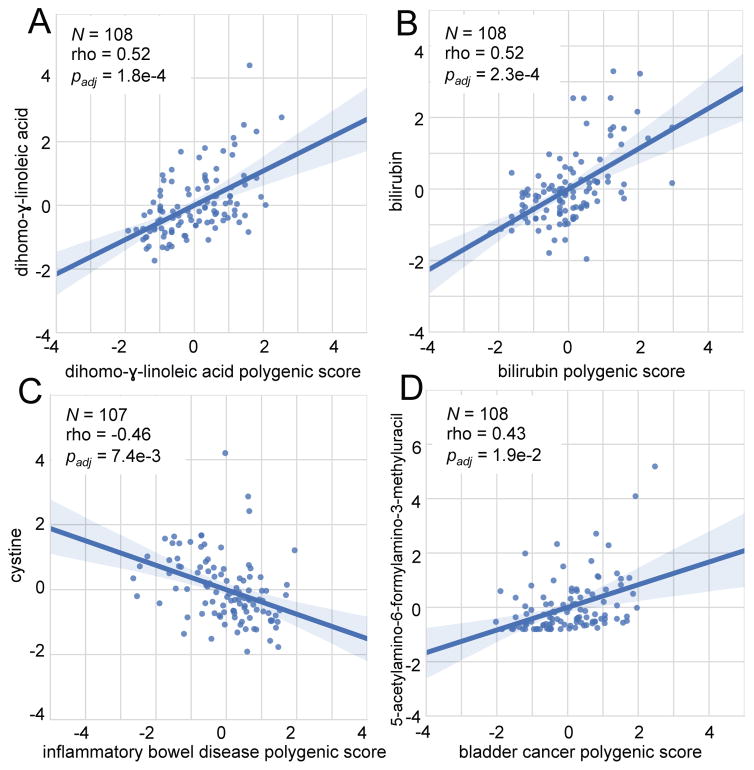
Figure 5. Polygenic scores correlate with blood analytes.
Spearman correlations between polygenic scores (x-axis) and analyte measurements (y-axis) from our correlation network. The number of measurements used for each pairwise comparison, correlation coefficients, and adjusted p-values are indicated on each figure. Values have been age and/or sex adjusted as described in Online Methods. The line shown is a y~x regression line, and the shaded regions are 95% confidence intervals for the slope of the line.

