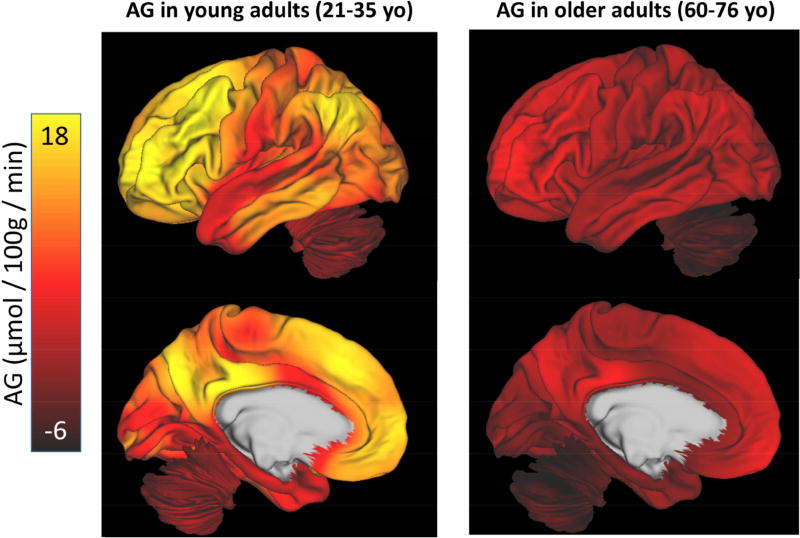
Figure 4. The topography of AG flattens with aging.
Quantitative values for AG were determined by combining literature-based whole brain values for CMRGlc and CMRO2 with local-to-global values within each individual (see Methods). This demonstrates that in a young cohort of adults (21–35 yo) AG varies considerably throughout the brain as has been described previously (Vaishnavi et al. 2010). In an older cohort (60–76 yo) matched for sex / gender, the overall topography of AG is flattened and depressed. Slight regional variation of AG persists in a manner similar to that seen in young adults, accounting for the modestly positive Spearman rank correlations for older adults (Figure 2). As our measurement of AG does not include other carbohydrate use for oxidative phosphorylation—such as lactate—some values of AG extend below zero, in particular in the cerebellum in the older cohort.

