

Abstract
Parkinson's disease biomarkers are needed to increase diagnostic accuracy, to objectively monitor disease progression and to assess therapeutic efficacy as well as target engagement when evaluating novel drug and therapeutic strategies. This article summarizes perianalytical considerations for biomarker studies (based on immunoassays) in Parkinson's disease, with emphasis on quantifying total α‐synuclein protein in biological fluids. Current knowledge and pitfalls are discussed, and selected perianalytical variables are presented systematically, including different temperature of sample collection and types of collection tubes, gradient sampling, the addition of detergent, aliquot volume, the freezing time, and the different thawing methods. We also discuss analytical confounders. We identify gaps in the knowledge and delineate specific areas that require further investigation, such as the need to identify posttranslational modifications of α‐synuclein and antibody‐independent reference methods for quantification, as well as the analysis of potential confounders, such as comorbidities, medication, and phenotypes of Parkinson's disease in larger cohorts. This review could be used as a guideline for future Parkinson's disease biomarker studies and will require regular updating as more information arises in this growing field, including new technical developments as they become available. In addition to reviewing best practices, we also identify the current technical limitations and gaps in the knowledge that should be addressed to enable accurate and quantitative assessment of α‐synuclein levels in the clinical setting. © 2017 The Authors. Movement Disorders published by Wiley Periodicals, Inc. on behalf of International Parkinson and Movement Disorder Society.
Keywords: Biomarker, α‐synuclein, cerebrospinal fluid, standard operating procedures, Parkinson's disease, diagnostics
Parkinson's disease (PD) is characterized by the presence of cytoplasmic α‐synuclein (aSyn) aggregates, progressive neuronal impairment, and eventually neuronal death. Lost neurons generally cannot be replaced. Therefore, agents aimed at inhibiting neurodegenerative processes are likely to be most effective if administered at the earliest stages of the disease process. However, clinical or pathological manifestations of the disease in early disease stages are often difficult to detect, and the definite diagnosis is made postmortem through neuropathology.1 Furthermore, it can be difficult to distinguish PD from atypical parkinsonian disorders including multiple system atrophy, progressive supranuclear palsy, and corticobasal degeneration, and dementia with Lewy bodies. Misdiagnoses occur in a substantial proportion of patients, particularly in general neurology practice, whereas movement disorder specialists achieve up to 90% accuracy.2 In fact, one study led by a fellowship‐trained movement disorder specialist found an inaccurate diagnosis in 7 of 15 subjects diagnosed with PD within 5 years.3
Also, different phenotypes of PD that have emerged from cluster analyses warrant careful evaluation and subtype‐specific biomarker considerations.4, 5 For these reasons, biomarkers that specifically reflect onset and progression of pathology may have a profound impact on diagnosis, detection, assessment of treatment efficacy, and patient stratification in future clinical trials. According to the National Institute of Health Biomarkers Definitions Working Group, a biomarker is a “characteristic that is objectively measured and evaluated as an indicator of normal biological processes, pathogenic processes, or pharmacologic responses to a therapeutic intervention.”6
PD biomarkers include structural and/or functional imaging, functional tests, and, most recently, tissue analysis and assays in biological fluids. An ideal biomarker reflects the underlying pathophysiological process and is optimally proximal to the molecular disease onset and progression. Cerebrospinal fluid (CSF), primarily produced by the choroid plexus within the ventricles of the central nervous system (CNS), is a promising biological fluid to study neurodegenerative disorders and can be easily accessed by routine lumbar punctures (LPs). It is known that 80% of CSF composition (ie, proteins) derives from the filtration of peripheral blood, whereas 20% derives from CNS cells.7
A triplet of CSF biomarkers for Alzheimer's disease (AD), total and phosphorylated tau, which may reflect AD‐type axonal degeneration, and β‐amyloid (Aβ) 1‐42, which reflects senile plaque pathology, have already been established for early (predementia) detection of AD.8 The biomarker field in PD can leverage the experiences and standardization efforts on preanalytical aspects of CSF biomarkers from the AD field,9, 10 including regulatory aspects of biomarker research, encompassing fluid and imaging biomarkers to support clinical trials.11 The AD markers have been included in European Medicines Agency guidance documents12 and were described in a letter of support of the Food and Drug Administration qualification process.13 No identical efforts have yet been initiated for PD biomarkers.
The identification of aSyn as the main component of Lewy bodies in 199714, 15 combined with evidence of a disease‐causing gene dosage effect15, 16 and the detection of aSyn in CSF led to the quantification of CSF aSyn as a candidate biomarker for the early diagnosis of PD.17, 18, 19, 20, 21 The PD field is now involved in a systematic exploration of posttranslational modifications of aSyn22, 23 and other surrogate biomarkers. In parallel, efforts are under way to develop and analytically validate assays of emerging biomarkers (including phosphorylated aSyn) and the creation of certified reference materials and methods (eg, based on mass spectrometry) that could support clinical trials of putative disease‐modified therapies of PD, as well as aid in obtaining regulatory approval for the biomarkers.24
The quantification of total aSyn in the CSF with sandwich‐type enzyme‐linked immunosorbent assays (ELISAs) or other technology platforms has been described by several groups with varying results (as reviewed in reference 17). Based on data from single‐ and multicenter studies,19, 21, 25, 26, 27 a consensus is now emerging that PD pathogenesis is associated with a 10‐20% reduction in total aSyn in CSF. Whether this reduction reflects Lewy body formation needs to be confirmed. Although aSyn expression has been identified in several extracerebral tissues including erythrocytes, there are data suggesting that CSF aSyn predominantly derives from neurons of the CNS.18, 28 However, it is still unclear if the CSF derived from the plexus already contains aSyn from the peripheral blood.29 Blood‐derived aSyn might be important if the blood‐brain barrier is compromised, especially in light of experimental data demonstrating that peripherally injected aSyn readily reaches the brain in mice.29
Reliance on LPs and CSF as the major matrix for biomarker assay development in biological fluids is not optimal. The distribution of PD‐linked aSyn pathology points toward a systemic disease with early involvement of the peripheral nervous system and organs.30 Therefore, there is a high possibility of detecting a peripheral marker in accessible biological fluids throughout less invasive procedures (at least compared with CSF) that is still proximal to the disease process.
An increasing number of studies have been exploring peripheral body fluids and biopsy sites as potential sources for aSyn biomarker analysis. In fact, after aSyn pathology was found in submandibular salivary glands31 (and is now being investigated as a biopsy‐based biomarker for PD in vivo32), a recent study detected aSyn in the saliva as a possible biomarker.33 ASyn has already been shown to be quantifiable in peripheral blood compartments34, 35 where red blood cells with high aSyn load are a large contributor.28, 36 Not much is known about aSyn isoforms and/or fragments in peripheral biospecimens. However, to date, the findings on blood total aSyn as a diagnostic biomarker have been inconsistent, which may be because of different sample processing, variations in standardization of methods and assays, and other confounding factors (eg, erythrocyte lysis).20, 37, 38, 39, 40 As such, the role of aSyn in peripheral fluids in the pathophysiology of PD is still unclear. Some of these blood‐processing issues can be avoided by the analysis of stabilized RNA in blood collected via PAX gene tubes (PreAnalytix) and by focusing on aSyn encoding gene (SNCA) transcripts instead of proteins.26
One of the main obstacles preventing the use of CSF and blood‐based aSyn biomarkers in routine diagnosis or individual patient management is interindividual variability and interstudy variability of aSyn levels, reaching, in some cases, coefficient variations of 20%‐35% for interassay and interlaboratory measurements.25, 27, 41 Several preanalytical, analytical, and assay‐related issues need to be addressed before global implementation of reliable biomarkers for diagnosis, prognosis, and monitoring of novel therapeutics in PD can occur.
The major impetus for this article is to summarize the current state of development of potential aSyn protein biomarker assays for PD, to critically discuss them, and to elucidate the gaps in knowledge that still need to be addressed. We will update this article on a regular basis as is done in other initiatives (Alzheimer's disease neuroimaging initiative and European Union initiatives).42 Our goal is to facilitate biomarker research and share information so that all investigators have access to pertinent information regarding how to best set up, validate, and ultimately interpret various assays/results. This article will refer to some original publications (cited in parentheses and provided in the accompanying reference list), as well as unpublished data. The latter have been generated through a consortium of scientists and companies that make up the Michael J. Fox Foundation's (MJFF) Investigating Synuclein Consortium (ISC). The ISC is composed of 30 academic and industry investigators around the world whose ongoing projects around aSyn assay development, optimization, and validation are supported by the MJFF. These investigators have agreed to share data, critical information, tools, and reagents in real time as they all work toward the same goal of understanding PD‐relevant aSyn species and developing biomarker assays to measure them.
The ISC, is composed of, in part, the MJFF aSyn Assay Standardization Linked Efforts to Accelerate Parkinson's Solutions (LEAPS) team. The goal of this initiative is to initially compare 3 already commercially available aSyn assays, as well as newly developed assays and a newly developed mass spectrometry assay in a round robin comparison study using the same set of 50 CSF, saliva, and whole‐blood samples. The LEAPS team is also charged with assessing a variety of currently available aSyn protein standards and examining the effect of preanalytical variables on assay performance. A similar study on phosphorylated aSyn and oligomeric aSyn is also in progress.
The content of the following section is related to total aSyn measurements unless otherwise indicated (eg, as posttranslationally modified aSyn).
This article builds on previous reviews addressing mainly preanalytical variables43 and recommendations for standardization.44, 45, 46 Our recommendations are summarized in Table 1. We include recommendations on CSF and blood biomarkers, although for the latter matrix, systematic data are currently lacking.
Table 1.
Suggested standard operating procedures (modified from references 17 and 44) for aSyn studies and evidence level
| CSF aSyn studies | Rationale and evidence | Blood aSyn studies | Rationale and evidence |
|---|---|---|---|
| Preanalytical considerations | |||
| Perform lumbar puncture in the morning with fasting patient | Avoid change of composition by nutrients (evidence level a). | Same as in CSF | Avoid change of composition by nutrients. (evidence level a) |
| Document medication and comorbidities for further correlation | Enable to investigate influence of pharmacotherapy and concomitant diseases. Correlation between the aSyn levels in treated PD subjects with at least the levodopa equivalent daily dosage (eg, according to Tomlinson76 and also suggest correlation with substance classes (such as dopamine agonists, MAO‐B inhibitors) (evidence level a). | Same as in CSF | Same as CSF |
| Sampling variables | |||
| Use atraumatic needles | Decrease of side effects (especially post‐lumbar puncture headache and artificial blood contamination).77 Up to 22‐gauge needles allow the regular collection of CSF, whereas smaller‐diameter needles (24 gauge) would require syringe sucking to enable the collection of 10‐12 mL in a realistic time frame, which can also cause artifacts (through cell lysis, material of the syringe) (evidence level c). | Venous puncture. If manually sucking tubes are used, care should be taken to avoid a significantly forced blood draw (to decrease hemolysis). Vacuum systems might be preferred as the vacuum is defined | Avoid hemolysis through incorrect handling of blood tubes (evidence level a) |
| Collect with polypropylene or siliconized tubes | Decrease aSyn adsorption (Fig. 2; evidence level b). | Collect with polypropylene or siliconized tubes | Same as CSF |
| Discard first 5 drops of CSF | Remove artificially blood contamination through needle insertion (evidence level a). | Fill blood tubes to the maximum (evidence level b) | No data |
| Collect the first 2 mL separately for cell count, routine analysis. A standardized collection volume should be used, preferably 10‐15 mL of lumbar CSF | Because of the rostrocaudal gradient, the volume taken should remain constant. If more CSF is taken, for example, for NPH patients, the first 10‐15 mL should be processed in accordance (evidence level b). | No data | No data |
| Sample processing | |||
| Samples should be processed quickly to avoid delay until freezing (evidence level b) | |||
| Samples need to be screened for blood contamination (by counting red blood cells as soon as possible) and/or quantification of hemoglobin (can be done in already frozen samples) | Hemoglobin contamination can influence biomarker measurements. Samples with blood contamination (>50/µL) or hemoglobin level > 200 ng/mL should be excluded (evidence level c). | Fast processing to avoid hemolysis. Quantification of hemoglobin possible | Same as CSF |
| Centrifuge samples before freezing | Cells (physiologically occurring or artificially through blood contamination) should be removed by centrifugation (evidence level c). | Centrifuge samples before freezing to obtain serum and plasma | Study the tube vendors recommendation on the centrifugation (evidence level c) |
| Volume of aliquots | To prevent gradient effect, take off supernatant and mix gently in a new (siliconized/polypropylene tube) and aliquot in ONE aliquot size (eg, 0.25 ml), avoid “dead volume” (Fig. 5; evidence level a). | Careful handling of supernatant is important to avoid contamination with blood | No data |
| Process within 60 minutes (optimally 30 minutes) after lumbar puncture | To avoid changes of CSF, ex vivo samples should be processed quickly (Fig. 6; evidence level a). | Same as CSF | |
| Storage and shipment of samples | |||
| Store all samples after processing in −80 °C | |||
| Avoid needless freezing and thawing cycles. Thaw samples on ice before applied | Freezing and thawing have been shown to decrease signal intensity and increase oligomerization (evidence level c). Allow 1 extra freeze/thaw cycle. | Same as CSF | |
| Shipment of samples | Processed and frozen samples should be shipped on dry ice (evidence level c). | Same as CSF | |
| Preanalytical sample handling | |||
| Thaw samples completely on ice | Incomplete thawed samples could impact results. Figure 6 (evidence level a) | Same as CSF | |
| Addition of blockers for heterophilic antibodies can be considered, esp. for blood | No extra benefit (evidence level a). | Same as CSF | |
| Analytical variables | |||
| Exclude samples with unknown or high levels of hemoglobin | Hemoglobin can be retrospectively quantified in frozen samples. Samples with blood contamination (>50/µL) or hemoglobin level > 200 ng/mL should be excluded (evidence level c). | Same as CSF | |
aRecommendation without robust multilaboratory investigation.
bOne investigation performed by one group, published or communicated, not independently validated.
cOne investigation (of our own group), not independently validated.
dRecommendation supported by 2 independent investigations.
eRecommendation supported by > 2 independent investigations.
Standardization and Confounding Factors
Biomarker standardization efforts include preanalytical considerations with potential confounding factors, such as nutrition and medication, sample collection and sample processing, storage and the quantification platforms, antibodies, and reference material as well as interpretation. The outcome of the standardization studies is dependent, in part, on the assay design (eg, selected antibody combinations, buffers) and can explain some of the discrepant results between studies.
To assess a first selection of possible perianalytical variables on aSyn measurements, we collected CSF samples from subjects with normal‐pressure hydrocephalus (NPH) and processed the samples as indicated in the legends of Figures 1, 2, 3, 4, 5, 6. The selected perianalytical variables included different collection temperatures and different collection tube materials, gradient collection, the addition of detergent, aliquot volume, time to freeze, and different thawing methods.
Figure 1.
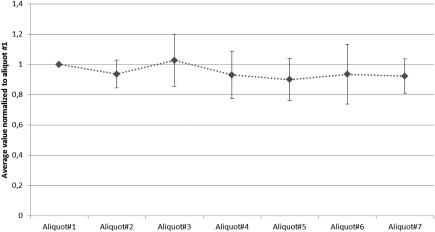
Assessment of collection gradient in cerebrospinal fluid. Up to 7 portions with 5 ml each of CSF gained by lumbar puncture from 11 subjects (1‐11) with Normal Pressure Hydrocephalus were collected and processed as published34 and analyzed with the BioLegend ELISA for total aSyn to assess possible rostro‐caudal gradient (assay: total aSyn from BioLegend)
Figure 2.

Cerebrospinal fluid aSyn levels in samples (P1‐P9) collected at different temperatures [room temperature (RT), wet ice] and in different collection tube material (polypropylene, siliconized polypropylene and styrene) (assay: total aSyn from BioLegend), data shown are mean ± standard deviation.
Figure 3.
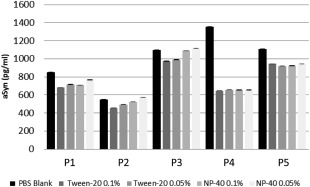
Cerebrospinal fluid aSyn levels in samples (P1‐P5) collected at different temperatures [room temperature (RT), wet ice] and in different collection tube material (polypropylene, siliconized polypropylene and styrene) (assay: total aSyn from BioLegend), data shown are mean ± standard deviation.
Figure 4.

Effect of aliquot volume on aSyn measurements in CSF: CSF samples from 6 different donors (subject P1‐P6) were aliquoted in 250, 500 and 1000 μl (assay: total aSyn from BioLegend). Shown at right is a bar graph depicting the mean aSyn levels by volume by participant. The error bars shown represent one standard deviation.
Figure 5.
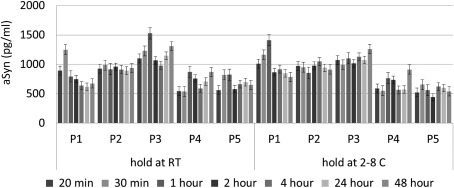
Time to freeze: CSF samples from 5 different donors (P1‐P5) were held at room temperature (RT, left part) or on 2‐8 °C (right part) for 20, 30 minutes, 1, 2, 4, 24 or 48 hours (two replicates each) (one set of samples from a donor with artificial blood contamination was removed) (assay: total aSyn from BioLegend); data shown are mean ± standard deviation.
Figure 6.

Different thawing methods were evaluated in 4 independent CSF samples (P1‐P4): data shown are the average +1 Standard deviation for triplicate measurements (3 independent aliquots for each condition). O/N: over night, RT: room temperature (total aSyn ELISA BioLegend); data shown are mean ± standard deviation.
Perianalytical Considerations for CSF aSyn
Perianalytical factors include all the steps before, around, and after analysis, whereas preanalytical factors are possible confounders that may introduce variability before the actual analysis of a biomarker. Perianalytical factors include in vivo biological factors affecting the subject at the time of sample collection (such as fasting or diurnal and seasonal variations). Little is known about how biological factors (ie, on genetic or neuropathological grounds) may influence aSyn levels in biological fluids. The PD sample cohorts analyzed to date have been too small to draw significant conclusions.47
Other perianalytical confounding factors can occur during sample handling and processing. Such in vitro factors can greatly impact biochemical analysis; it has been reported that approximately 40‐60% of observed laboratory errors are because of such preanalytical procedures.17 This is of particular concern for PD biomarker analyses, because aSyn is highly abundant in the peripheral blood and blood contamination occurs in 14‐20% of LP procedures.13, 18, 19
The following section summarizes the currently known perianalytical variables affecting aSyn assay performance. We recognize and leave open the possibility of including additional variables as data become available in the online version of this article, which appears on the MJFF website (see below).
Medication
How pharmacotherapy and dopaminergic medication in PD influence CSF aSyn levels is not yet clear. One study described the expression of dopamine receptors in the choroid plexus, where CSF is produced,48 which could influence the homeostasis of CSF components, including aSyn.
Within the Parkinson Progression Marker Initiative (PPMI; for more information: www.ppmi-info.org) of MJFF longitudinal sample analysis, we analyzed whether use of PD medications and the levodopa equivalent daily dosages during a 12‐month follow‐up period was associated with changes in CSF biomarkers. We found that patients using dopamine agonists (but not dopamine replacements) had lower levels of aSyn than unmedicated patients. There was no obvious relationship with changes in other CSF biomarkers.49 Further analysis of this apparent association using data from subsequent visits in the PPMI study is required to understand the relevance of these preliminary findings.
Diurnal Variation, Fasting
A clearance of metabolites from the brain interstitial space into the CSF occurs during sleep.50 As such, a circadian rhythm of CSF biomarker concentrations is possible. Diurnal variation of biomarkers can be a critical factor in the concentration of specific biochemical compounds that are influenced by potential circadian rhythms. In case of a circadian rhythm, the time of day when the LP/blood draw is performed can be of importance.51 Several AD studies have already characterized the diurnal variation of CSF biomarkers.52 For CSF aSyn, there does not appear to be any diurnal fluctuation, although a potential gradient and/or effect of high sampling volume appears to affect aSyn levels.
Whether food/drink intake influences CSF biomarkers and especially CSF aSyn levels is not known. Very little is known about the influence of diurnal variation/ fasting on aSyn levels in other biological fluids (eg, saliva and blood matrices).
Sampling Variables for PD Biomarkers
Type of Needle for Lumbar Puncture
Although headache has been reported to occur less in elderly subjects,53 postpuncture headache impacts acceptance in patients and should be an important consideration for biomarker studies.
Because aSyn is highly abundant in peripheral blood, accidental blood contamination should be avoided. To evaluate the effects of LP practice on accidental blood contamination, hemoglobin levels were assessed in baseline LP samples of 671 subjects (early PD and healthy controls) enrolled in the PPMI study. Hemoglobin levels were compared in the CSF from those subjects who underwent LP using atraumatic needles (n = 535) versus sharp needles (n = 128; for 8 subjects the information was missing): CSF from LPs with atraumatic needles compared with those with traumatic needles showed significantly less hemoglobin contamination (P = 0.014).
Volume (Including Gradient Effect)
After the production of CSF by filtration, CSF leaves the ventricles beneath the cerebellum and permeates the CNS, introducing blood‐derived proteins to the CSF in this fashion. Therefore, the composition of CSF taken from the ventricles is different from the CSF tapped by LP around the lumbar spine. The lumbar CSF contains more blood‐derived proteins (eg, albumin) than the ventricular CSF. On the other hand, most brain‐derived proteins have a decreasing rostrocaudal concentration gradient in the lumbar CSF.7 Therefore, the volume of CSF taken during an LP can influence the protein concentration. To date, 3 studies have addressed a potential gradient effect on CSF aSyn.
Hong and colleagues analyzed 45 control subjects at 3 different lumbar CSF fractions (<10, 10‐15, and 15‐20 mL). This work demonstrated a trend toward decreased CSF aSyn in late fractions in all cases, after elimination of samples with elevated hemoglobin levels (indicative of blood contamination, which was most prevalent in the early fraction).18
In a second study, CSF aSyn showed a slight reduction from rostral to caudal (thereby suggesting its neuronal origin) in a small set of gradient samples from patients with NPH.28 As expected, (blood‐derived) total protein and albumin increased from rostral to caudallumbar levels. Interestingly, CSF aSyn behaved similarly to neuron‐specific enolase (a neuron‐enriched protein that, similarly to aSyn, is also expressed at high levels in erythrocytes), whereas the leptomeninges‐derived β‐trace protein remained stable, as expected.
A third investigation using the BioLegend ELISA assay, with 11 NPH subjects and 7 fractions did not show a gradient effect. To determine the potential effect of a concentration gradient during the collection of high volumes of CSF (up to 35 mL), up to 7 separate samples were prepared per participant over the course of the tap. CSF aSyn levels were determined in each sample aliquot. Figure 1 shows the average value normalized to aliquot 1 of aSyn levels for the 11 participants. The tight accordance of values in the participants indicates that CSF levels of aSyn do not significantly vary widely over the course of sample collection and most importantly do not increase, which supports that CSF aSyn is derived from the central nervous system.
Although in these 3 independent studies there was no significant gradient effect for CSF aSyn, we recommend the collection of a standarized volume of CSF in all future studies because other protein biomarkers might be influenced by the concentration gradient. We therefore recommend collecting 10‐15 mL, which provides enough sample volume to compare results between various patient and control groups and also between laboratories. Furthermore, CSF should be gently mixed prior to centrifugation followed by aliquotation. This will not only help improve the validity of current biomarkers, but will also facilitate the discovery of novel CSF biomarkers for which potential gradient effects are unknown. No correlation between the collected volume of CSF and the risk of post‐LP headache has been shown.54 For some studies it could therefore be feasible to collect even larger volumes of samples (eg, for PPMI, 18‐mL samples were collected).
Sample Processing for PD Biomarkers
Pipette Tips, Detergent Added to Sample and Types of Tubes for Aliquoting
It is well known that protein biomarker levels (especially those with high propensity to aggregate or precipitate, such as aSyn and Aβ 1‐42) are influenced by the type and material of collection/aliquoting tube used because of nonspecific binding to the tube surface.55, 56, 57 Similar findings have been also observed for aSyn oligomers in the CSF (data not shown).
We compared aSyn levels in the CSF from 9 donors using siliconized polypropylene, polypropylene, and polystyrene tubes (Fig. 2). The siliconized polypropylene tubes show, in some samples, higher levels of aSyn, but overall in this small sample set the differences were not significant. Nevertheless, the use of tubes composed of glass or polystyrene materials with known high protein‐binding capacity58 (not tested here) for the collection and storage of samples should be avoided.
It has to be noted that the same type of collection tubes from different vendors may also affect apparent concentrations of some biomarkers. A comparison among collection tubes from Bio Plas, Inc. (San Rafael, CA; 4200SLS, 0.5 mL, screw cap), Eppendorf AG (Hamburg, Germany; Z666491, 0.5 mL, snap cap), Fisher Scientific, Inc. (Waltham, MA; 02‐681‐311, 0.6 mL, snap cap), and Sarstedt AG (Nürnbrecht, Germany; 72.704.600, 0.5 mL, snap cap) revealed variability of less than 20% (data not shown). On the other hand, unpublished preliminary data show for oligomeric and phosphorylated forms of aSyn (pS129), significant variability between different sources of polypropylene tubes (El‐Agnaf et al., unpublished data).
There are no studies that directly compare effects of siliconized pipette tips. However, adsorption of analytes can occur within seconds and may differ between CSF and blood. Because the material of tubes and tips may also vary between vendors, we recommend selecting one source for all collection steps and experiments. Storage tubes should also lock safely (even in the freezer at −80°C) to avoid evaporation. In addition, treatment of the tube surface (or the sample itself) with Tween‐20 reduced Aβ4259 and aSyn adsorption (El‐Agnaf et al, unpublished data). We independently investigated the effect of non‐ionic detergents added before analysis on aSyn measurement from 5 subjects. Thus, CSF aliquots from each of 5 subjects were treated with Tween ‐20 to 0.1% or 0.05%, NP‐40 to 0.1% or 0.05%, or blank polybutylene succinate (PBS; Fig. 3). There was a trend toward a decreased detectable level of aSyn with Tween 20 having more pronounced effects than NP‐40, but the magnitude of the effect of detergent varies among individual samples.
Data on collection material and treatment seem sparse and difficult to interpret or translate into specific recommendations to make a proper recommendation at this time. Nevertheless, we advocate collection and aliquoting of biological fluids for aSyn measurements using polypropylene or siliconized tubes. No further recommendations for the addition of chemicals to the collection and/or storage of samples can be given at this point without further investigations.
Centrifugation Condition
Biological fluids should be centrifuged after collection and before freezing: Even CSF normally contains up to 5 white cells/µL and should therefore be centrifuged quickly (eg, within 1 hour) before cell lysis occurs. Additional contamination of cells and extracellular blood fluid by accidental blood contamination through LP can be decreased by centrifugation. Centrifugation speed, time, and temperature are critical variables and should be standardized within a study. For example, abundant aSyn protein is found in platelets, which can be activated by centrifugation at low temperatures.60 Moreover, variable removal of platelets from plasma could contribute to variability in aSyn plasma measures. Centrifugation will improve homogeneity of the samples before analysis.
As centrifugation generates density gradients, we recommend the transfer of the supernatant to a new tube that is gently mixed by inverting the tube 3 times prior to aliquoting the biospecimen.
No recommendations concerning centrifugation time, speed, or temperature can be given at this time, as a systematic investigation of their influence on aSyn levels has not been performed.
Volume of Aliquots
The possible adsorption of protein to surface walls of storage tubes and evaporation of sample fluid during storage led to the investigation of effects of different aliquot volumes on aSyn levels.
CSF was obtained from 6 study participants (Fig. 4). To determine the potential effect of storage aliquot volume, multiple aliquots were prepared at volumes of 250, 500, and 1000 µL. CSF aSyn levels were determined in 5 independent aliquots at each volume from each of the 6 subjects. The results indicated that aliquot volume does not affect reproducibility of aSyn measurement.
Routine Analysis Accompanying Biofluid Collection for Research Purposes
LPs in symptomatic subjects should also include analysis of acute/inflammatory processes of the CNS by analysis of the white and red blood cell counts. Total protein or albumin should also be measured (eg, by nephelometry).
The person carrying out the LP should document any artificial blood contamination or macroscopically obvious changes from the normal color of CSF.
Red blood cell counts provide the best measure for evaluating blood contamination (if performed within 30 minutes after lumbar puncture and before lysis of erythrocytes occurs). Quantification of hemoglobin might be an alternative to the red blood cell count.
It is optimal for a serum sample to be taken around the time of CSF collection, and analysis of the serum/CSF ratios of albumin, immunoglobin G, immunoglobin M, and immunoglobin A is recommended to provide information on the CSF dynamic, the blood/CSF barrier, which can alter the CSF proteome, as well as intrathecal inflammation.
If consent is available, we also recommend freezing some blood (treated with a nuclease inhibitor such as ethylenediaminetetraacetic acid) for eventual DNA analysis.
In addition to autoantibodies and hemoglobin, elevated levels of other CSF proteins should be considered as potential modifiers. For example, increased CSF tau levels have been shown to correlate with high CSF total aSyn in several independent studies.30, 61, 62 CSF tau protein was shown to potentially influence the clinical associations of CSF total aSyn, for example, by masking CSF aSyn reduction in PD. It was suggested that CSF aSyn levels be corrected for CSF tau protein,61 but we think more research into the mechanism underlying the correlation is needed before such a recommendation should be made.
Time Delay Between Fluid Collection, Aliquoting, and Storage
Time delay of processing and storing has been reported to alter the proteome, especially of serum and plasma proteins,63, 64 but it can also alter the CSF proteome.65 CSF aSyn levels were reduced after 4 days of storage at 4°C in one study.44
In a second study, the effect of sample handling delays was evaluated (Fig. 5). CSF was collected from 6 individuals. Samples were kept on ice (2°C–8°C) or at ambient conditions for 20 minutes to 48 hours prior to freezing. Although individual differences occurred, there was no consistent trend for changes of aSyn levels by storage time and/or temperature.
Storage and Shipment of Samples for PD Biomarkers
Shipment and Freeze/Thaw Cycles
Freezing biological fluids affects protein stability.66 Freeze‐thaw cycles should be avoided for all biological fluids. A proteomic study found significant alteration of protein profiles after several freeze/thaw cycles.65 Instability was also reported following dry‐ice storage/shipment and different ways of thawing, because of acidification and pH shift,67 which need to be taken into account. For total aSyn, concentrations have been shown to decrease up to 50% after 6 freeze/thaw cycles.44 As a consequence, we recommend reporting the number of freeze/thaw cycles as a confounding factor or using it as a covariate in the data analysis.
Preanalytical Sample Handling for PD Biomarkers
Sample Handling Before Analysis
Thawing methods may impact analyses and should be undertaken carefully and reproducibly. It is important that a frozen sample is completely thawed before utilization.
The effect of thawing methods was evaluated in 4 independent CSF samples using a commercially available ELISA. Data shown in Figure 6 are the average + 1 standard deviation for triplicate measurements (3 independent aliquots for each condition). The magnitude of the effect of thawing methods varied among individual samples. For Aβ peptides the trend was that signal increases with higher temperatures.68 For aSyn, no definite conclusion could be drawn.
Analytical Variables to Consider for PD Biomarkers
Adding of Blockers for Heterophilic Antibodies
The addition of blockers for heterophilic antibodies (HAs) to sample diluents in antibody‐based assays for blood biomarkers is recommended. HAs are antibodies in the sample capable of binding to animal immunoglobulins, and they interfere with the reaction of animal‐derived antibodies that comprise all immunoassays. HAs generally produce false‐positive signals through cross‐binding of capture and reporter antibodies used in enzyme‐linked immunoassays (ELISAs). Recently, it has been reported that the presence of HAs is a major confounder in aSyn ELISAs. HA interference was more prominent in plasma than the CSF.69 On elimination of HA interference in the plasma, aSyn levels were significantly lower in the PD group than in the control group. Therefore, decreasing or even eliminating interference from HAs should always be considered, especially from blood samples.
aSyn levels in biological fluids depend on the assay used, as different antibodies bind to different epitopes, and different calibration standards used affect the levels observed within an assay. The same is also true for assays measuring the oligomeric and phosphorylated forms of aSyn. Although the majority of studies have focused on aSyn phosphorylated at S129, because of the readily available antibodies, the presence and contribution of other posttranslationally modified forms of the protein cannot be ruled out and should not be overlooked.
Because of the abundance of aSyn in peripheral blood and red blood cells, samples with known accidental blood contamination should be analyzed carefully. In one study, the significance level did not change significantly when comparing the statistics with and without the samples with known hemoglobin levels above 200 ng/mL in CSF.25 Nevertheless, the current recommendation is that samples with known accidental blood contamination (by erythrocyte count > 50/µl) should be excluded and/or that hemoglobin should be quantified and samples with levels higher than 200 ng/mL should be excluded. Further studies are needed to determine the proper exclusion criteria. Cutoff points may be different for different assay platforms; more sensitive assays may require lower cutoffs than others.
CSF flow is known to decrease with age and results in elevation of total protein in the CSF.7 In addition, leakage of the blood‐CSF barrier becomes more obvious in older subjects. Therefore, the analysis of the ratio of aSyn to total protein could be of interest and should be examined further in future studies.70
With the emergence of assays for aSyn subspecies, it is recommended to always quantify total aSyn in the sample and also calculate ratios of the subspecies to the total aSyn concentration. If a particular aSyn subspecies is CNS specific, its concentration will not be influenced by, for example, blood contamination (provided the contamination is not diluting the CSF sample).
Calibrator Selection in α‐Synuclein Immunoassays
An immunoassay can be used as an absolute quantitation if a reference material is available and immunoassay calibrator values are traceable to this material.71 The current aSyn immunoassays are relative assays because no reference material is available. Each manufacturer uses an internal standard for quantitation of the calibrators. Consequently, aSyn concentrations in biological samples will be different when results from several assays are compared using the same samples. However, the aSyn assays may be able to quantify the same protein isoform, resulting in a good correlation between values generated in the assays with different antibody pairs or with an orthogonal methodology (eg, mass spectrometry).72
The selection of the biomaterial for calibration (eg, native protein, recombinant protein, synthetic peptide, synthetic/semisynthetic proteins), the matrix in which calibrators are formulated, and the concentration range of the calibrators are all driven by the analytical performance characteristics of immunoassays, including parallelism, precision, and the working range of the assay. For example, the use of synthetic peptides covering the antibody epitopes of the critical raw materials is justified if the analytical performance can be confirmed or if it improves test kit stability compared with the native protein. The integration of an artificial matrix (eg, PBS containing stabilizers) can further improve the long‐term stability and lot consistency of the kit. The number and level of calibrators, and the curve fit parameters have a direct impact on the precision of the assay.73, 74 Figure 7a,b shows the comparison of 4 calibrators in an immunoassay. Comparison of calibrators from different manufacturers, and with an analytical methodology, will help to better understand the outcome of published studies.
Figure 7.

Comparison of calibrators: (A) Four independent sources of recombinant aSyn protein (rPeptide, Inc., Bogart USA; Anaspec, Inc., Fremont, USA; Proteos, Inc., Kalamazoo, USA and UAEU kindly provided by Omar El‐Agnaf) were used to generate standard curves in the BioLegend ELISA. The plots show the raw luminescent counts plotted against the concentration of aSyn protein (ranging from 1500‐6.1 pg/mL). (B) ASyn levels were measured in six CSF samples (QC1‐QC6). The value for each sample was obtained by interpolation against standard curves that were generated using recombinant aSyn protein obtained from four independent sources.
To compare concentrations across different assays, different calibrators need to be compared and optimally quantified by an antibody‐free reference method (eg, by mass spectrometry). This work is still ongoing.
General Remarks
Because of the multiple potential variations in sample handling and storage, as well as variables in tissue collection and storage standards at different institutions, investigators performing analyses with cohorts that have been collected at different centers must be cautious in analyzing the results of biomarker studies. We recommend a detailed comparison of the respective standard operating procedures (SOPs). Ideally, one harmonized SOP should be used across centers in multicenter studies. For studies with larger recruitment numbers, we recommend that multicenter studies use the same SOP. In addition, a central repository for sample storage (after freezing at −80°C and a central analysis of marker candidates) is recommended to minimize variation.
To compare results from different groups or to reproduce data and further improve the protocol, it is important that critical information and parameters relating to each part of the protocol be documented and reported.
Given the presence of multiple pathologies in neurodegenerative diseases and downstream pathophysiology, it is unavoidable that investigators will study total aSyn levels or aSyn isoforms with other markers, such as Aβ42, tau, synaptic proteins, or neuroinflammatory markers. Optimization of collection and storage procedures for CSF aSyn might not be the optimal protocol for the other analytes of interest. Investigators will have to analyze in advance, the perianalytical variables affecting their independent analytes before conducting studies and, where possible, implementing previously defined cutoff values for a specific analyte.
Most of the variables discussed here have not been independently investigated in larger sample sets for levels of total aSyn. Therefore, a complete and concrete set of recommendations cannot be made yet. However, awareness of the factors that could affect observed concentration of biomarkers is important for future research on PD biomarkers (Table 2).
Table 2.
Summary of known confounder and unknown facts and list of recommendations that need to be done
| Known preanalytical confounding factors | Recommendations |
| Blood contamination confounds aSyn measurements |
• Determine the hemoglobin cutoff levels for aSyn measurement in larger cohorts. • Develop better assays for hemoglobin and/or more accurate markers for artificial blood contamination needs to be determined.78 • Establish a uniform standard operating procedure (SOP) for sample collection. |
| Poorly defined variables or undefined variables | Recommendations |
|
Centrifugation: time, speed and temperature Storage: freeze/thaw methods and cycles |
• Conduct a systematic analysis of the optimal centrifugation time, speed, and temperature. • Determine which freeze/thaw methods and procedures maintain aSyn levels and stability. • Assess the impact of repeated freeze‐thaw cycles on aSyn levels and stability on fresh samples and samples that have been kept for longer periods. • Establish a uniform standard operating procedure (SOP) for sample handling and storage. |
| Calibrators: Purity, concentration and stability. |
• Purity of the calibrators should be verified using SDS‐PAGE and mass spectrometry. • Use more precise methods to determine and/or verify the concentration of the calibrators (eg, amino acid analysis [AAA] or mass spectrometry). |
|
What is being measured? Capturing the diversity of the aSyn CSF proteome |
• Conduct unbiased mass spectrometry studies to assess and quantify the diverse aSyn species in the biological fluids. • Determine which species are pathophysiologically relevant or can serve as biomarkers. |
| Patient variables: medication, comorbidities, genetics and PD phenotype | • Document comorbidities, comedications, genetics, PD phenotype in larger cohorts and correlate with measurements. |
Although we have focused on total aSyn immunoassays in this article, we plan to continue to work and closely coordinate with other research groups that are pioneering novel mass spectrometry75 and aSyn aggregation‐based74, 75 methods to enable the development of accurate assays that allow the quantification of multiple forms of aSyn in biological fluids.
We anticipate adding regular updates with insights emerging from further investigations and more precise recommendations (including perianalytical variables on the newer assays as mentioned above) and newer technologies online at www.michaeljfox.org/scientificpublications.
Authors' roles
B.M. collected samples, wrote the first draft of the manuscript, and performed revisions. P.T. performed the analyses, and critically revised the article. R.B., O.E.A., D.R.G., H.A.L., K.M.M., L.M.S., D.J.S., R.U., H.V., H.Z., J.Z., C.C.G., C.C., S.J.H., M.F., P.T., all critically reviewed the article. The group and coauthors met twice for review and consent.
Financial disclosures of all authors
B.M. has received independent research grants from TEVA‐Pharma, Desitin, Boehringer Ingelheim, GE Healthcare and honoraria for consultancy from Bayer Schering Pharma AG, Roche, AbbVie, TEVA‐Pharma, Biogen and for presentations from GlaxoSmithKline, Orion Pharma, TEVA‐Pharma and travel costs from TEVA‐Pharma. B.M. is a member of the executive steering committee of the Parkinson Progression Marker Initiative and the Systemic Synuclein Sampling Study of the Michael J. Fox Foundation for Parkinson's Research and has received grants from the BMBF, EU, Parkinson Fonds Deutschland, Deutsche Parkinson Vereinigung, Michael J. Fox Foundation for Parkinson's Research, and Stifterverband für die deutsche Wissenschaft and has scientific collaborations with Roche, Bristol Myers Squibb, Ely Lilly, Covance and Biogen. H.Z. is a cofounder of Brain Biomarker Solutions in Gothenburg AB, a GU Ventures‐based platform company at the University of Gothenburg and has served on advisory boards at Roche Diagnostics, Eli Lilly, and Pharmasum Therapeutics. H.A.L. has a project supported by UCB, but it is on a‐syn pathology spreading. K.M.M. is a senior adviser to the MJFF and a member of the executive steering committee of the Parkinson Progression Marker Initiative. D.J.S. is a director and consultant of Prothena Biosciences. L.M.S. receives support from the NIH/NIA (U19 AG024904), Michael J. Fox Foundation for Parkinson's Disease Research, Eli Lilly, and Roche, provides consultation to Eli Lilly, Roche, Novartis, and AbbVie. H.V. is cofounder of ADx NeuroSciences and a founder of Biomarkable bvba. C.C. serves on the scientific advisory board for data safety and monitoring for NINDS and NIA, received a speaker honorarium for presenting a short course at Rho, Inc., is a consultant for ZZ Biotech, LLC, received research support from the Michael J. Fox Foundation, and is supported by NIH/NINDS (U01 NS077352; PI, 10/01/11‐09/30/18; and U01 NS077108, PI, 10/01/11‐09/30/16; U01 HL091843, PI, 08/01/09‐02/28/15; U01 NS038529, PI, 12/01/09‐12/31/13; U01 NS079163, 08/05/2012‐07/31/2015; U01 NS082329, 07/15/2013‐06/30/2018; U01 NS084495, 09/15/2013‐07/31/2018). P.T. is employee of BioLegend. S.H. and M.F. are employees of the Michael J. Fox Foundation for Parkinson's Research. D.G. is supported by NIH grant AGO5131, and by the Michael J. Fox Foundation. He has provided consultation for vTv Pharmaceuticals, Eli Lilly, Inc, and Proclara, Inc. R.B. is employed by Roche Diagnostics and owner of Roche stocks. O.E.A. — Neurological Disorders Research Center, Qatar Biomedical Research Institute (QBRI), Hamad Bin Khalifa University (HBKU), Qatar Foundation. B.U., J.Z., and C.C.G. have nothing to disclose.
The copyright line for this article was changed on 13 September 2017 after original online publication.
Relevant conflicts of interest/financial disclosures: Nothing to report.
Full financial disclosures and author roles can be found in the online version of this article.
Responsible investigators of the Asyn Assay Standardization LEAPS include the following authors: B.M., O.E.A., V.C., P.T., R.U., H.Z., J.Z., D.S.; for the Michael J. Fox Foundation for Parkinson's Research, New York, New York: S.H., M.F. Recommendations put forth in this article result from discussion at the MJFF ISC Assessment Meeting/Workshop in December 2015 and February 2017.
References
- 1. Dickson DW, Braak H, Duda JE, et al. Neuropathological assessment of Parkinson's disease: refining the diagnostic criteria. Lancet Neurol 2009;8(12):1150‐1157. [DOI] [PubMed] [Google Scholar]
- 2. Hughes AJ, Daniel SE, Kilford L, Lees AJ. Accuracy of clinical diagnosis of idiopathic Parkinson's disease: a clinico‐pathological study of 100 cases. J Neurol Neurosurg Psychiatry 1992;55(3):181‐184. [DOI] [PMC free article] [PubMed] [Google Scholar]
- 3. Adler CH, Beach TG, Hentz JG, et al. Low clinical diagnostic accuracy of early vs advanced Parkinson disease: clinicopathologic study. Neurology 2014;83(5):406‐412. [DOI] [PMC free article] [PubMed] [Google Scholar]
- 4. Fereshtehnejad SM, Romenets SR, Anang JB, Latreille V, Gagnon JF, Postuma RB. New clinical subtypes of Parkinson disease and their longitudinal progression: a prospective cohort comparison with other phenotypes. JAMA Neurol 2015;72(8):863‐873. [DOI] [PubMed] [Google Scholar]
- 5. Lawton M, Baig F, Rolinski M, et al. Parkinson's Disease Subtypes in the Oxford Parkinson Disease Centre (OPDC) Discovery Cohort. J Parkinsons Dis 2015;5(2):269‐279. [DOI] [PMC free article] [PubMed] [Google Scholar]
- 6. Biomarkers Definitions Working G . Biomarkers and surrogate endpoints: preferred definitions and conceptual framework. Clin Pharmacol Ther 2001;69(3):89‐95. [DOI] [PubMed] [Google Scholar]
- 7. Reiber H. Proteins in cerebrospinal fluid and blood: barriers, CSF flow rate and source‐related dynamics. Restor Neurol Neurosci 2003;21(3‐4):79‐96. [PubMed] [Google Scholar]
- 8. Olsson B, Lautner R, Andreasson U, et al. CSF and blood biomarkers for the diagnosis of Alzheimer's disease: a systematic review and meta‐analysis. Lancet Neurol 2016;15(7):673‐684. [DOI] [PubMed] [Google Scholar]
- 9. Molinuevo JL, Blennow K, Dubois B, et al. The clinical use of cerebrospinal fluid biomarker testing for Alzheimer's disease diagnosis: a consensus paper from the Alzheimer's Biomarkers Standardization Initiative. Alzheimers Dement 2014;10(6):808‐817. [DOI] [PubMed] [Google Scholar]
- 10. Vanderstichele H, Bibl M, Engelborghs S, et al. Standardization of preanalytical aspects of cerebrospinal fluid biomarker testing for Alzheimer's disease diagnosis: a consensus paper from the Alzheimer's Biomarkers Standardization Initiative. Alzheimers Dement 2012;8(1):65‐73. [DOI] [PubMed] [Google Scholar]
- 11. Cavedo E, Lista S, Khachaturian Z, et al. The road ahead to cure Alzheimer's disease: development of biological markers and neuroimaging methods for prevention trials across all stages and target populations. J Prev Alzheimers Dis 2014;1(3):181‐202. [DOI] [PMC free article] [PubMed] [Google Scholar]
- 12.Available at: http://www.ema.europa.eu/docs/en_GB/document_library/Regulatory_and_procedural_guideline/2011/02/WC500102018.pdf. Accessed September 14, 2016.
- 13.Available at: http://www.fda.gov/Drugs/DevelopmentApprovalProcess/ucm434382.htm. Accessed September 14, 2016.
- 14. Spillantini MG, Schmidt ML, Lee VM, Trojanowski JQ, Jakes R, Goedert M. Alpha‐synuclein in Lewy bodies. Nature 1997;388(6645):839‐840. [DOI] [PubMed] [Google Scholar]
- 15. Singleton AB, Farrer M, Johnson J, et al. alpha‐Synuclein locus triplication causes Parkinson's disease. Science 2003;302(5646):841. [DOI] [PubMed] [Google Scholar]
- 16. Chartier‐Harlin M‐C, Kachergus J, Roumier C, et al. Alpha‐synuclein locus duplication as a cause of familial Parkinson's disease. Lancet 2004;364(9440):1167‐1169. [DOI] [PubMed] [Google Scholar]
- 17. Simonsen AH, Kuiperij B, El‐Agnaf OM, et al. The utility of alpha‐synuclein as biofluid marker in neurodegenerative diseases: a systematic review of the literature. Biomark Med 2016;10(1):19‐34. [DOI] [PubMed] [Google Scholar]
- 18. Hong Z, Shi M, Chung KA, et al. DJ‐1 and alpha‐synuclein in human cerebrospinal fluid as biomarkers of Parkinson's disease. Brain 2010;133(Pt 3):713‐726. [DOI] [PMC free article] [PubMed] [Google Scholar]
- 19. Mollenhauer B, Locascio JJ, Schulz‐Schaeffer W, Sixel‐Doring F, Trenkwalder C, Schlossmacher MG. alpha‐Synuclein and tau concentrations in cerebrospinal fluid of patients presenting with parkinsonism: a cohort study. Lancet Neurol 2011;10(3):230‐240. [DOI] [PubMed] [Google Scholar]
- 20. El‐Agnaf OM, Salem SA, Paleologou KE, et al. Alpha‐synuclein implicated in Parkinson's disease is present in extracellular biological fluids, including human plasma. FASEB J 2003;17(13):1945‐1947. [DOI] [PubMed] [Google Scholar]
- 21. Tokuda T, Salem SA, Allsop D, et al. Decreased alpha‐synuclein in cerebrospinal fluid of aged individuals and subjects with Parkinson's disease. Biochem Biophys Res Commun 2006;349(1):162‐166. [DOI] [PubMed] [Google Scholar]
- 22. Schmid AW, Fauvet B, Moniatte M, Lashuel HA. Alpha‐synuclein post‐translational modifications as potential biomarkers for Parkinson's disease and other synucleinopathies. Mol Cell Proteomics 2013;12(12):2543‐2558. [DOI] [PMC free article] [PubMed] [Google Scholar]
- 23. El‐Agnaf OM, Salem SA, Paleologou KE, et al. Detection of oligomeric forms of alpha‐synuclein protein in human plasma as a potential biomarker for Parkinson's disease. FASEB J 2006;20(3):419‐425. [DOI] [PubMed] [Google Scholar]
- 24. Lleo, A , Cavedo E, Parnetti L, et al. Cerebrospinal fluid biomarkers in trials for Alzheimer and Parkinson diseases. Nat Rev Neurol 2015;11(1):41‐55. [DOI] [PubMed] [Google Scholar]
- 25. Kang JH, Irwin DJ, Chen‐Plotkin AS, et al. Association of cerebrospinal fluid beta‐amyloid 1‐42, T‐tau, P‐tau181, and alpha‐synuclein levels with clinical features of drug‐naive patients with early Parkinson disease. JAMA Neurol 2013;70(10):1277‐1287. [DOI] [PMC free article] [PubMed] [Google Scholar]
- 26. Magdalinou NK, Paterson RW, Schott JM, et al. A panel of nine cerebrospinal fluid biomarkers may identify patients with atypical parkinsonian syndromes. J Neurol Neurosurg Psychiatry 2015;86(11):1240‐1247. [DOI] [PMC free article] [PubMed] [Google Scholar]
- 27. Hall S, Ohrfelt A, Constantinescu R, et al. Accuracy of a panel of 5 cerebrospinal fluid biomarkers in the differential diagnosis of patients with dementia and/or parkinsonian disorders. Arch Neurol 2012;6(11):1445‐1552. [DOI] [PubMed] [Google Scholar]
- 28. Mollenhauer B, Trautmann E, Otte B, et al. alpha‐Synuclein in human cerebrospinal fluid is principally derived from neurons of the central nervous system. J Neural Transm 2012;119(7):739‐746. [DOI] [PMC free article] [PubMed] [Google Scholar]
- 29. Sui YT, Bullock KM, Erickson MA, Zhang J, Banks WA. Alpha synuclein is transported into and out of the brain by the blood‐brain barrier. Peptides 2014;62:197‐202. [DOI] [PMC free article] [PubMed] [Google Scholar]
- 30. Braak H, Del Tredici K, Rub U, de Vos RA, Jansen Steur EN, Braak E. Staging of brain pathology related to sporadic Parkinson's disease. Neurobiol Aging 2003;24(2):197‐211. [DOI] [PubMed] [Google Scholar]
- 31. Del Tredici K, Hawkes CH, Ghebremedhin E, Braak H. Lewy pathology in the submandibular gland of individuals with incidental Lewy body disease and sporadic Parkinson's disease. Acta Neuropathol 2010;119(6):703‐713. [DOI] [PubMed] [Google Scholar]
- 32. Adler CH, Dugger BN, Hinni ML, et al. Submandibular gland needle biopsy for the diagnosis of Parkinson disease. Neurology 2014;82(10):858‐864. [DOI] [PMC free article] [PubMed] [Google Scholar]
- 33. Devic I, Hwang H, Edgar JS, et al. Salivary & alpha;‐synuclein and DJ‐1: potential biomarkers for Parkinson's disease. Brain 2011;134(Pt 7):e178. [DOI] [PMC free article] [PubMed] [Google Scholar]
- 34. Shi M, Sui YT, Peskind ER, et al. Salivary tau species are potential biomarkers of Alzheimer's disease. J Alzheimers Dis 2011;27(2):299‐305. [DOI] [PMC free article] [PubMed] [Google Scholar]
- 35. Devic I, Hwang H, Edgar JS, et al. Salivary alpha‐synuclein and DJ‐1: potential biomarkers for Parkinson's disease. Brain 2011;134(Pt 7):e178. [DOI] [PMC free article] [PubMed] [Google Scholar]
- 36. Barbour R, Kling K, Anderson JP, et al. Red blood cells are the major source of alpha‐synuclein in blood. Neurodegener Dis 2008;5(2):55‐59. [DOI] [PubMed] [Google Scholar]
- 37. Duran R, Barrero FJ, Morales B, Luna JD, Ramirez M, Vives F. Plasma alpha‐synuclein in patients with Parkinson's disease with and without treatment. Mov Disord 2010;25(4):489‐493. [DOI] [PubMed] [Google Scholar]
- 38. Fjorback AW, Varming K, Jensen PH. Determination of alpha‐synuclein concentration in human plasma using ELISA. Scand J Clin Lab Invest 2007;67(4):431‐435. [DOI] [PubMed] [Google Scholar]
- 39. Lee PH, Lee G, Park HJ, Bang OY, Joo IS, Huh K. The plasma alpha‐synuclein levels in patients with Parkinson's disease and multiple system atrophy. J Neural Transm 2006;113(10):1435‐1439. [DOI] [PubMed] [Google Scholar]
- 40. Li QX, Mok SS, Laughton KM, et al. Plasma alpha‐synuclein is decreased in subjects with Parkinson's disease. Exp Neurol 2007;204(2):583‐588. [DOI] [PubMed] [Google Scholar]
- 41. Kang JH, Mollenhauer B, Coffey CS, et al. CSF biomarkers associated with disease heterogeneity in early Parkinson's disease: the Parkinson's Progression Markers Initiative study. Acta Neuropathol 2016;131(6):935‐949. [DOI] [PMC free article] [PubMed] [Google Scholar]
- 42. Trojanowski JQ, Vandeerstichele H, Korecka M, et al. Update on the biomarker core of the Alzheimer's Disease Neuroimaging Initiative subjects. Alzheimers Dement 2010;6(3):230‐238. [DOI] [PMC free article] [PubMed] [Google Scholar]
- 43. Parnetti L, Cicognola C, Eusebi P, Chiasserini D. Value of cerebrospinal fluid alpha‐synuclein species as biomarker in Parkinson's diagnosis and prognosis. Biomark Med 2016;10(1):35‐49. [DOI] [PubMed] [Google Scholar]
- 44. del Campo M, Mollenhauer B, Bertolotto A, et al. Recommendations to standardize preanalytical confounding factors in Alzheimer's and Parkinson's disease cerebrospinal fluid biomarkers: an update. Biomark Med 2012;6(4):419‐430. [DOI] [PubMed] [Google Scholar]
- 45. Sako W, Murakami N, Izumi Y, Kaji R. Reduced alpha‐synuclein in cerebrospinal fluid in synucleinopathies: evidence from a meta‐analysis. Mov Disord 2014;29(13):1599‐1605. [DOI] [PubMed] [Google Scholar]
- 46. Eusebi P, Giannandrea D, Biscetti L, et al. Diagnostic utility of CSF alpha‐synuclein species in Parkinson's disease: protocol for a systematic review and meta‐analysis. BMJ Open 2016;6(6):e011113. [DOI] [PMC free article] [PubMed] [Google Scholar]
- 47. Mollenhauer B, Parnetti L, Rektorova I, et al. Biological confounders for the values of cerebrospinal fluid proteins in Parkinson's disease and related disorders. J Neurochem 2016;139(Suppl 1):290‐317. [DOI] [PubMed] [Google Scholar]
- 48. Mignini F, Bronzetti E, Felici L, et al. Dopamine receptor immunohistochemistry in the rat choroid plexus. J Auton Pharmacol 2000;20(5‐6):325‐332. [DOI] [PubMed] [Google Scholar]
- 49. Mollenhauer B, Caspell‐Garcia CJ, Coffey CS, et al. Longitudinal cerebrospinal fluid biomarkers in early Parkinson's disease and healthy controls. Neurology 2017, submitted.
- 50. Xie L, Kang H, Xu Q, et al. Sleep drives metabolite clearance from the adult brain. Science 2013;342(6156):373‐377. [DOI] [PMC free article] [PubMed] [Google Scholar]
- 51. Murillo‐Rodriguez E, Desarnaud F, Prospero‐Garcia O. Diurnal variation of arachidonoylethanolamine, palmitoylethanolamide and oleoylethanolamide in the brain of the rat. Life Sci 2006;79(1):30‐37. [DOI] [PubMed] [Google Scholar]
- 52. Bateman RJ, Wen G, Morris JC, Holtzman DM. Fluctuations of CSF amyloid‐beta levels: implications for a diagnostic and therapeutic biomarker. Neurology 2007;68(9):666‐669. [DOI] [PubMed] [Google Scholar]
- 53. Zetterberg H, Tullhog K, Hansson O, Minthon L, Londos E, Blennow K. Low incidence of post‐lumbar puncture headache in 1,089 consecutive memory clinic patients. Eur Neurol 2010;63(6):326‐330. [DOI] [PubMed] [Google Scholar]
- 54. Kuntz KM, Kokmen E, Stevens JC, Miller P, Offord KP, Ho MM. Post‐lumbar puncture headaches: experience in 501 consecutive procedures. Neurology 1992;42(10):1884‐1887. [DOI] [PubMed] [Google Scholar]
- 55. Vanderstichele HM, Janelidze S, Demeyer L, et al. Optimized Standard Operating Procedures for the Analysis of Cerebrospinal Fluid Abeta42 and the Ratios of Abeta Isoforms Using Low Protein Binding Tubes. J Alzheimers Dis 2016;53(3):1121‐1132. [DOI] [PMC free article] [PubMed] [Google Scholar]
- 56. Perret‐Liaudet A, Pelpel M, Tholance Y, et al. Risk of Alzheimer's disease biological misdiagnosis linked to cerebrospinal collection tubes. J Alzheimers Dis 2012;31(1):13‐20. [DOI] [PubMed] [Google Scholar]
- 57. Lehmann S, Schraen S, Quadrio I, et al. Impact of harmonization of collection tubes on Alzheimer's disease diagnosis. Alzheimers Dement 2014;10(5 Suppl):S390‐S4 e2. [DOI] [PubMed] [Google Scholar]
- 58. Lewczuk P, Beck G, Esselmann H, et al. Effect of sample collection tubes on cerebrospinal fluid concentrations of tau proteins and amyloid beta peptides. Clin Chem 2006;52(2):332‐334. [DOI] [PubMed] [Google Scholar]
- 59. Pica‐Mendez AM, Tanen M, Dallob A, Tanaka W, Laterza OF. Nonspecific binding of Abeta42 to polypropylene tubes and the effect of Tween‐20. Clin Chim Acta 2010;411(21‐22):1833. [DOI] [PubMed] [Google Scholar]
- 60. Sahai S, Arora RC, Meltzer HY. Platelet monoamine oxidase. I: Effect of temperature, anticoagulant, and centrifugation technique. Biol Psychiatry 1981;16(11):1077‐1083. [PubMed] [Google Scholar]
- 61. Compta Y, Valente T, Saura J, et al. Correlates of cerebrospinal fluid levels of oligomeric‐ and total‐alpha‐synuclein in premotor, motor and dementia stages of Parkinson's disease. J Neurol 2015;262(2):294‐306. [DOI] [PubMed] [Google Scholar]
- 62. Llorens F, Schmitz M, Varges D, et al. Cerebrospinal alpha‐synuclein in alpha‐synuclein aggregation disorders: tau/alpha‐synuclein ratio as potential biomarker for dementia with Lewy bodies. J Neurol 2016;263(11):2271‐2277. [DOI] [PubMed] [Google Scholar]
- 63. Jimenez CR, Koel‐Simmelink M, Pham TV, van der Voort L, Teunissen CE. Endogeneous peptide profiling of cerebrospinal fluid by MALDI‐TOF mass spectrometry: optimization of magnetic bead‐based peptide capture and analysis of preanalytical variables. Proteomics Clin Appl 2007;1(11):1385‐1392. [DOI] [PubMed] [Google Scholar]
- 64. West‐Nielsen M, Hogdall EV, Marchiori E, Hogdall CK, Schou C, Heegaard NH. Sample handling for mass spectrometric proteomic investigations of human sera. Anal Chem 2005;77(16):5114‐5123. [DOI] [PubMed] [Google Scholar]
- 65. Rosenling T, Slim CL, Christin C, et al. The effect of preanalytical factors on stability of the proteome and selected metabolites in cerebrospinal fluid (CSF). J Proteome Res 2009;8(12):5511‐5522. [DOI] [PubMed] [Google Scholar]
- 66. Bhatnagar BS, Bogner RH, Pikal MJ. Protein stability during freezing: separation of stresses and mechanisms of protein stabilization. Pharm Devel Technol 2007;12(5):505‐523. [DOI] [PubMed] [Google Scholar]
- 67. Murphy BM, Swarts S, Mueller BM, van der Geer P, Manning MC, Fitchmun MI. Protein instability following transport or storage on dry ice. Nat Meth 2013;10(4):278‐279. [DOI] [PubMed] [Google Scholar]
- 68. Le Bastard N, De Deyn PP, Engelborghs S. Importance and impact of preanalytical variables on Alzheimer disease biomarker concentrations in cerebrospinal fluid. Clin Chem 2015;61(5):734‐743. [DOI] [PubMed] [Google Scholar]
- 69. Ishii R, Tokuda T, Tatebe H, et al. Decrease in plasma levels of alpha‐synuclein is evident in patients with Parkinson's disease after elimination of heterophilic antibody interference. PLoS One 2015;10(4):e0123162. [DOI] [PMC free article] [PubMed] [Google Scholar]
- 70. Mollenhauer B, Cullen V, Kahn I, et al. Direct quantification of CSF alpha‐synuclein by ELISA and first cross‐sectional study in patients with neurodegeneration. Exp Neurol 2008;213(2):315‐325. [DOI] [PubMed] [Google Scholar]
- 71. Valentin MA, Ma S, Zhao A, Legay F, Avrameas A. Validation of immunoassay for protein biomarkers: bioanalytical study plan implementation to support pre‐clinical and clinical studies. J Pharm Biomed Anal 2011;55(5):869‐877. [DOI] [PubMed] [Google Scholar]
- 72. Bjerke M, Andreasson U, Kuhlmann J, et al. Assessing the commutability of reference material formats for the harmonization of amyloid‐beta measurements. Clin Chem Lab Med 2016;54(7):1177‐1191. [DOI] [PubMed] [Google Scholar]
- 73. Vanderstichele H, De Meyer G, Shapiro F, et al. Alzheimer's Disease Biomarkers: From Concept to Clinical Utility. Nova Science Publishers, Inc; 2008. [Google Scholar]
- 74. Gottschalk PG, Dunn JR. The five‐parameter logistic: a characterization and comparison with the four‐parameter logistic. Anal Biochem 2005;343(1):54‐65. [DOI] [PubMed] [Google Scholar]
- 75. Schmid AW, Fauvet B, Moniatte M, Lashuel HA. Alpha‐synuclein post‐translational modifications as potential biomarkers for Parkinson disease and other synucleinopathies. Mol Cell Proteomics 2013;12(12):3543‐3558. [DOI] [PMC free article] [PubMed] [Google Scholar]
- 76. Tomlinson CL, Stowe R, Patel S, Rick C, Gray R, Clarke CE. Systematic review of levodopa dose equivalency reporting in Parkinson's disease. Mov Disord 2010;25(15):2649‐2653. [DOI] [PubMed] [Google Scholar]
- 77. Wright BL, Lai JT, Sinclair AJ. Cerebrospinal fluid and lumbar puncture: a practical review. J Neurol 2012;259(8):1530‐1545. [DOI] [PubMed] [Google Scholar]
- 78. You JS, Gelfanova V, Knierman MD, Witzmann FA, Wang M, Hale JE. The impact of blood contamination on the proteome of cerebrospinal fluid. Proteomics 2005;5(1):290‐296. [DOI] [PubMed] [Google Scholar]