

Graphical Abstract
This paper introduces a new method, 3D Near Field Electrospinning (3DNFES), for printing polymeric fibers in highly organized, controlled and reproducible manner. The research strategy described in the this work offers several significant advantages including: 1) producing precise patterns of fibers on relatively large scale area with minimum material consumption, 2) ability to print in all three directions of X, Y and Z, 3) offering an inexpensive method with easy control over shape and orientation of fibers compared to other available methods, and 4) readily combines with other pre-patterned nanostructures or microstructures such as gels (e.g. collagen gel) to create multi-material composites.
Keywords: 3D Near-Field Electrospinning, Composite Microfiber-Cell Loaded Gel, 3D printing
This paper describes the development of a novel low-cost and efficient method, 3D near-field electrospinning, to fabricate high-resolution, and repeatable three-dimensional polymeric fiber patterns on nonconductive materials with potential use in tissue engineering. This technology is based on readily available hobbyist grade 3D printers. The result is exquisite control of the deposition of single fibers in an automated manner. Additionally, we demonstrate the fabrication of various fiber patterns, which are subsequently translated to unique cellular patterns. Finally, we printed poly(methyl methacrylate) fibers within 3D collagen gels loaded with cells to introduce anisotropic properties of polymeric fibers within the cell-loaded gels.
Tissue engineering and regenerative medicine are emerging fields with potential to revolutionize modern medicine. Together, the fields of tissue engineering and regenerative medicine, seek to apply stem cells, biomaterials and growth factors either alone or in combination to generate or regenerate damaged and diseased tissues and organs.[1–3] One of the key elements in the fields of tissue engineering and regenerative medicine is assembling a well-designed scaffold.[4] However, a scaffold providing an environment that fully resembles the natural extracellular matrix (ECM) remains as a challenge.[5] Researchers have proposed several different biomaterial strategies, such as, cell-laden hydrogels,[6] bio-printed biodegradable polymers,[7] and polymeric nano- and microfibers[8, 9] to create three-dimensional scaffolds with potential for mimicking human tissues or organs. Among these methods, polymeric nano- and microfibers have shown immense potential due to their distinctive properties.[10] Specifically, polymeric fibers have the ability to create porous three-dimensional platforms resembling the fibrous structure of natural extracellular matrix (ECM). These porous fiber structures have demonstrated an ability to directly regulate many cellular processes, such as, proliferation and differentiation.[11–13] There are several methods of making polymeric fibers such as melt electrospinning,[14, 15] phase separation,[16] self-assembly,[17] and conventional electrospinning.[18, 19] Among all these methods, conventional electrospinning provides a versatile, inexpensive and straightforward electrohydrodynamic process to deposit organic and inorganic nano and micron scale fiber scaffolds with great throughput.[20–22] To date electrospinning has experienced at least three major stages of development to overcome the disadvantages of earlier stages. These three stages are: conventional electrospinning, field induced electrospinning, and near-field electrospinning. Conventional electrospinning has been widely employed to deposit random fibers as a 3D network with an extensive use in tissue engineering.[20] However, conventional electrospinning techniques suffer from an unorganized network formation of nanofibers generated by the chaotic whipping of liquid jets,[23] which leads to difficulties in precisely regulating the orientation of deposited fibers.[24] Field induced electrospinning has been developed to control deposited fiber alignments through modifying magnetic and electrical fields.[25] However, this method is not capable of creating precise and organized patterns of fibers. There have been several other attempts focused on applying physical forces to improve the fiber formation and alignments, such as rotational mechanical mandrels.[26] However, these methods are still not capable of controlling the precise direction of each single fiber. More recently, near-field electrospinning has been introduced as a powerful method to form highly controllable patterns of electrospun fibers on flat surfaces.[27–29] In near-field electrospinning the distance between needle and collector is very short (500 µm – 3 mm). This relative short distance prevents the bending instability and splitting in electrospun fibers.[30] Therefore, near-field electrospinning provides the ability to write fibers directly in a highly precise manner. For example, Chang et al. have deposited various complex nanofiber patterns on large and flat areas such as grids or circular arrays via near-field electrospinning.[31] One of the problems associated with near-field electrospinning systems is that the majority of these systems use complex and expensive multi-axis microscope stages to control the alignment of the fibers in mainly X-Y directions.[32] Additionally, although near-field electrospinning shows several advantages over conventional and field induced electrospinning, there are still other limitations such as low assembly efficiency, sophisticated set up, limited to forming 2D planar fiber structures and limited patterns. These challenges motivated us to develop an inexpensive platform capable of forming three dimensional, highly precise and reproducible fiber structures through uniting 3D printing technology and near-field electrospinning. 3D printing or additive manufacturing technologies have been subjects of intense study in the field of biomedical engineering to assemble artificial organ structures out of living material, typically referred to as bioprinting.[7] Bioprinting has the potential to revolutionize the power of medical interventions.[33] Current technology can create products despite complexity in shape with a resolution of close to 100 µm.[34] 3D printing also offers several other advantages such as fast processing, minimal loss of raw material as waste, and comparably cost-efficient equipment.[35] Using these concepts in nano- and microscale fabrication provides the potential to combine near-field electrospinning’s benefits with 3D printing.
In the present work, we report an original automated 3D near-field electrospinning (3DNFES) printer for fabrication of controlled polymer fibers (Figure 1a). Multilayers of highly aligned and patterned polymeric fibers poly(methyl methacrylate) (PMMA) were spun on non-conductive surfaces using 3DNFES. We further demonstrated that we could grow cells on printed fiber patterns and as a proof of concept; we highlight the feasibility of deposition of patterned PMMA fibers within cell-loaded collagen gels. In the following section, we explain the processing details of 3DNFES and report our observations of the resulting patterned fibers with or without the presence of the cells.
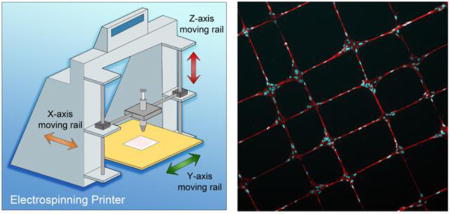
Figure 1.

Schematic illustration of 3D near-field electrospinning (3DNFES), optical illustration of printed fibers and scanning electron micrographs (SEM) of multilayers of printed PMMA fibers. a) 3DNFES apparatus created from integrating a 3D printer and conventional electrospinning. b and c) 3D printed electrospun fibers seeded with cells. d and e) Low and high magnifications SEM images of two layers of cell-seeded PMMA crisscrossed fibers, cells were pseudo colored in red for improved visualization. f) Photograph of printed PMMA fibers on a nonconductive glass slide in an organized crisscrossed pattern. g) Size distribution of PMMA microfibers (20% wt/vol polymer concentration) fabricated at a flow rate of 50 µL h−1. Size distribution histogram was fitted with a Gaussian distribution (n = 40). h) Low magnification of SEM images of PMMA printed fibers. i–k) Pseudo colored high magnification SEM images of 2, 3 and 4 layers of printed PMMA fibers on non-conductive glass substrates.
The schematic of the custom electrospinning system is illustrated in Figure 1a with the detailed printing process provided in the supplementary information. The 3DNFES system was built through modifying a commercial 3D printer (Markerfarm, Utah, USA), specifically, the printer was modified by replacing the extruder nozzle and heated bed with a custom syringe holder and metal plate. In order to produce the polymer fibers using 3DNFES, 20%(wt/vol) PMMA in Nitromethane was electrospun on non-conductive glass surfaces with the following parameters: flow rate 50 µm h−1, voltage 1.6 kV, spinneret-to-collector 2 mm, and printer speed of 60 mm s−1 (data for 20%(wt/vol) poly(ε-caprolactone) (PCL) in acetone and acetic acid (vol1/vol2, 80/20) presented in supplementary data, Figure S4 – S6. In 3DNFES the spinneret-to-collector distance is relatively short, which provides the ability to print precise and reproducible polymer fibers on non-conductive materials such as glass slides, polymer coated glass slides and hydrogel blocks. This capability provides immense potential through eliminating the need of conductive substrate, which is a major drawback for the use of conventional electrospinning and relevant techniques in tissue engineering applications.
To evaluate the 3DNFES process we began by printing some test patterns. Figure 1f displays a crisscrossed pattern of PMMA fibers (1cm × 1cm) on the surface of a glass slide and demonstrates the controllability and continuity of fibers spun by 3DNFES. It is worth mentioning that treatment of glass surfaces with air-plasma noticeably helps the fiber printing uniformity. Fibers made by 3DNFES are relatively uniform in size with a distribution of 1.86 ± 0.41 µm (Figure 1g). Additionally, the 3D printer platform enables the ability to move in X, Y and Z directions in a layer-by-layer style. In the 3DNFES system, the syringe moves in the Y – Z directions, and the collector moves in the X direction. To evaluate the ability of the 3DNFES system to generate patterns, we began with a simple grid, Figure 1h. Next, we investigated the reproducibility in deposition of these simple grid patterns by expanding to multiple fiber layers (Figure 1i – 1k). Scanning electron microscope (SEM) images on Figure 1i – 1k display 2, 3 and 4 layers of PMMA fibers, respectively, constructed on top of each other on a non-conductive glass slide; pseudo color-coded was added for better illustration. Depositing fibers as multilayered patterns is particularly attractive in areas such as, microelectromechanical systems (MEMS), biosensors and flexible electronics.[36]
Another advantage of 3DNFES is that the diameter of fibers can be adjusted by adjusting operating parameters involved, which is similar to conventional electrospinning.[37] However, in 3DNFES, in addition to electrospinning parameters, 3D printing parameters such as stage displacement speed and filling capacity of the patterns can play a role in changing fiber shape and fiber density, respectively. We systematically investigated the effects of NFES parameters (polymer concentrations, flow rate, voltage, spinneret-to-collector distance and 3D printing stage displacement speed) on the size and shape of PMMA microfibers. First, we varied the concentration of PMMA in nitromethane from 16 to 24 % (W/V) and observed as the PMMA concentration increased the polymer fiber diameter is increased as well from 1.86 ± 0.41 to 4.73 ± 1.40 µm corresponding to concentrations from 20 to 26 % (W/V, PMMA/nitromethane) while other parameters were kept fix at spinneret-to-collector distance of 2 mm, voltage of 1.6 kV, flowrate of 50 µL h−1 and stage displacement speed of 60 mm s−1, Figure 2a. 20 % PMMA (W/V PMMA/nitromethane) was selected as an optimum concentration throughout the study, since lower concentrations reduced the ability to form continuous fibers due to the low viscosity of the polymer solution, whereas, higher concentrations resulted in significant increases in fiber diameter. Additionally, the 20% PMMA (W/V PMMA/nitromethane) was capable of deposition of fibers on non-conductive gels and glass slide substrates. Next, we studied the influence of flowrate on fiber diameter. Figure 2b illustrates the variation in size of microfiber diameter for the three different flow rates of 50, 100 and 150 µL h−1 at a concentration of 20% PMMA (W/V PMMA/nitromethane). As the flow rate increased from 50 to 150 µL h−1, microfibers grew in diameter from 1.86 ± 0.41 to 3.96 ± 1.31 µm. This increase in fiber diameter is significant even for slight changes of flowrate (50 to 100 µL h−1). For flowrates less than 50 µL h−1 the fibers transition to a series of beads. After investigating the effect of flowrate on fiber size, we evaluated the spinneret-to-collector distance as another key element evolved on changes in fiber diameter. The commercial software, Repetier, was used to control spinneret-to-collector distance. As shown in Figure 2c when the spinneret-to-collector distance is increased, fiber diameters are decreased. Fiber diameters significantly decreased from 3.81 ± 0.89 to 1.54 ± 0.42 µm when spinneret-to-collector distance increased from 1.6 to 2.4 mm. This decrease in fiber diameter is due to increased stretching of the fibers while they travel from spinneret to the collector. The thicker fibers found in the lower spinneret-to-collector distance were non-continuous as a result of identical volumes of the polymer solution. 2 mm was selected as our optimum parameter moving forward based on the production of continuous fibers on our non-conductive substrates. As for the effect of voltage involvement on fiber diameter, we observed by increasing the voltage, fiber diameter also increased (Figure 2d). This observation is contrary with the conventional electrospinning (far-distance electrospinning).[37] In conventional electrospinning, increasing the voltage results in growth on bending instability and further stretches the fibers, which eventually leads to the formation of thinner fibers. However, in 3DNFES we do not experience the bending instability as a result of short spinneret-to-collector distance, which increasing voltage results in formation of thicker fibers potentially through increasing the rate of material being extruded. This increase in fiber diameter caused the formation of non-continuous and non-uniform fiber patterns. Finally, we investigated the role of stage displacement speed on fiber morphology. In 3DNFES, it is fairly easily to control the stage displacement speed of the 3D printing using the Repetier software. Figure 2e displays the effect of changes on the stage displacement speed (from 10 to 60 mm s−1) on fiber morphologies. At lower speeds, fiber jets are affected by the repulsive force of the charges on the spinneret. These repulsive forces cause oscillatory motions, which lead to wavy and even woven patterned fibers.[38] The ability to write wavy fibers has potential in several micro devices such as stretchable energy harvesters,[39, 40] stretchable strain sensors,[41] photonics, electronics, and micromechanics.[42] Further increasing the stage displacement speed allows the drag force to straighten the fiber and once the stage displacement speed reaches 60 mm s−1 (and higher) fibers were observed to be straight. After evaluating all the parameters, we selected the following optimal parameters: concentration of 20% (W/V PMMA/Nitromethane), flow rate of 50 µL h−1, voltage of 1.6 kV, spinneret-to-collector distance 2 mm, and stage displacement speed of 60 mm s−1.
Figure 2.

Effects of 3DNFES parameters (polymer concentrations, flow rate, voltage, spinneret-to-collector distance and 3D printing stage displacement speed) on PMMA fiber size and shape, a) This graph displays the effect of polymer concentrations on fiber size, concentrations vary from 16 to 24% and higher concentration, depicting a general trend of increasing diameter with increases in concentration. b) Bar graph shows the effect of polymer flow rate on fiber size, increasing flowrate from 50 to 150 µLh−1 is associated with increased diameters. c) Displays the plot of PMMA fiber diameter vs. spinneret-to-collector distance, similar to conventional electrospinning, increased distances were associated with decreased fiber diameters. d) Depicts the relationship between voltage and fiber diameter, demonstrating, in contrast to traditional electrospinning, that increasing voltage was associated with increased fiber diameters. In all the graphs statistically significant differences are indicated by the brackets connecting each groups with “*” (n = 20, p < 0.05). e) Optical images of the effect stage displacement speed on PMMA fiber shapes demonstrates that increasing stage displacement speed from 10 to 60 mm s−1 resulted in a transition from woven to sinusoidal and finally, straight fibers. f) High and low magnification SEM images of the smooth and uniform printed PMMA fibers fabricated into hairpin curves.
Another unique advantage of 3DNFES is the ability to form curved fibers when the spinner changes direction. In conventional near-field electrospinning, when the collector stops at the corner especially once the direction of the pattern changes, it results in wavy and woven fibers at the corners.[43] This happens due to the nature of the motorized stage in which controlling the speed in X and Y directions especially at the edges of patterns are quite difficult. Previously, it was shown that when the collector stopped at the corner (0.2 s), extensive amounts of fibers were created at the corners.[43] Since 3DNFES utilizes a 3D printer platform we can easily control the stage displacement speed (including speed around the corner and edges) and overcome the pitfalls with near-field electrospinning to achieve more precise, controlled and smoother edge as it is shown in Figure 2f. Finally, we also showed that by adjusting printer filling capacity in the software (from 1% to 9%) we can create sparse and dense fibers in a single run (Figure S1c).
Cellular Ingrowth on Printed PMMA Fibers
PMMA printed microfibers are good candidates for cellular ingrowth due to their smooth surface roughness (54.6 ± 9.6 nm for a single fiber) and Young’s modulus of 2.48 ± 0.34 GPa (for PMMA fibers on glass), Figure S2. Human mesenchymal stem cells (hMSCs) were cultured on PMMA microfiber patterns to study the feasibility of cellular ingrowth on the printed microfibers. We first deposited a uniform thin film layer of 4% poly(2-hydroxyethyl methacrylate) (pHEMA) on 24 by 60 mm2 flat glass slide substrates using spin coating. The purpose of coating surfaces with this thin layer of pHEMA was to prevent the cell attachment on glass slides and allow the cells only attach and spread on PMMA printed fibers. Using 3DNFES, we printed different patterns (e.g. straight fibers, crisscrossed and wavy lines) of PMMA fibers on the surface of the nonconductive pHEMA coated glass coverslip.
After culturing hMSCs for 2 days, it was observed that the cells attached and spread entirely on PMMA fibers (Figure 3a – 3e). Figure 3a presents the optical micrographs of the hMSCs cultured on aligned PMMA fibers. Straight polymer fibers represent the most basic structure of the ECM and hold a great potential in tissue-engineering disciplines from studying cell behavior, drug delivery and even in regeneration applications (such as nerve guidance). In addition to the aligned fibers, we created more complex cell patterns, such as crisscrossed and wavy parallel lines, that can potentially mimic the complexity of ECM environments (Figure 3b – 3e). Furthermore, cell viability was evaluated after seeding and growing hMSCs in collagen gels combined with crisscrossed PMMA fibers (and in the printed fibers) for 24 hours, the live/dead cell imaging kit shows no significant reduction in cell viability and majority of the cells were still alive (Figure S3).
Figure 3.

Human mesenchymal stem cells (hMSCs) cultured on PMMA fibers printed on pHEMA coated glass slides for 2 days, a) Fluorescence micrographs of straight fibers with hMSCs cultured on them, b) Low magnification fluorescence image of crisscrossed fiber pattern with hMSCs cultured on them with high magnification of DIC image of single cell displayed as an inset on fluorescence image, c – e) High magnification of single and multiple cells on straight, crisscrossed and wavy fibers. f and g) Display scatter plots of cell nuclei orientation versus cell area and their corresponding frequencies. Variations of nuclei orientation and changes on cell area demonstrate sensitivity of cells to topographical properties (i.e. 95% of cells cultured on aligned PMMA fibers lay between ±5°).
We further studied the growth of the mouse preosteoblast cell line, MC3T3-E1 subclone 4, on PCL polymer fibers with potential application in tissue engineering (Figure S4). Future efforts will look to combine these different patterns to generate progressively more complex patterns. Furthermore, future efforts will evaluate the spacing between fibers, which were chosen to be no less than 100 µm in the current study to prevent cell growth across adjacent fibers. Cell growth across adjacent fibers spaced less than 100 µm is demonstrated in Figure S4g and S4h.
Next, we applied the open source software package, CellProfiler,[44, 45] to quantify morphological parameters of hMSCs grown on PMMA printed fibers vs. hMSCs grown on PMMA films. This study helps to understand the effect of single fibers on each individual cell and potentially provide useful information for designing improved platforms for examining cellular behavior (e.g. migration and proliferation on single fibers) and studying drug delivery. Figure 3f and 3g display the scatter plot of fiber nuclei orientation vs. hMSCs area and their frequencies. Orientation of cell nuclei exhibits the sensitivity of cells to topographic properties, in this case surface of patterned PMMA fibers and PMMA film. By looking at the histogram of cell nuclei we conclude that cells are in great alignment with printed PMMA fiber orientation. More than 95% of the cells fall between ±5° from the fiber axis (more than 99% of cells between ±15° from the fiber axis). However, for hMSCs grown on PMMA films the cells adhere and spread in random orientations. The ability to exquisitely direct the elongation of cells has potential to numerous applications, such as, directed guidance of nerve regeneration.[2]
Cell area is another physical property investigated due to the values of cell spread area across a range of applications, especially on drug delivery.[46] After 2 days of cell growth, the area of cells attached to fibers is significantly less than those on films as demonstrated by frequency bar graphs in Figure 3f and 3g. This decrease in cell surface area on fibers are effects many cellular properties, such as decreasing the ability to take up nanoparticles.[46] Furthermore, the quantitative and qualitative data (e.g. Cell perimeter, cell orientation) for the cellular growth of MC3T3 cells grown on PCL printed fibers can be found on supplementary data (Figure S4 and S5), which follows the trends discussed for hMSCs on PMMA fibers.
Fiber:Cell-loaded Gel Composites
Cells play a key role in the tissue engineering approaches and it is essential to seed them uniformly into 3D scaffolds to rebuild tissue parts.[47] Collagen gel is a great candidate to be used as a 3D scaffold in tissue engineering due to its unique properties.[48] Collagen gel shows excellent compatibility between cell and tissue, therefore it is quickly remodeled by the host tissue leading to restoration of normal function at the site. Although collagen gels with encapsulated cells have been applied for tissue fabrication, it suffers from several disadvantages. Collagen gel encapsulated cells suffer from poor mechanical properties and difficulties retaining the original shape due to traction forces applied by and matrix metalloproteinases (MMPs) secreted by the encapsulated cells.[5] A possible solution to overcome this disadvantage is adding nano- or microfibers to reinforce the collagen gels. However previous efforts in adding a nonwoven structure to 3D scaffolds prevented the uniform seeding of cells.[49] In contrast, 3DNFES can generate patterns of fibers on the surface of collagen and combined it with another cell seeded collagen gel in a layer-by-layer manner. This combination of collagen and fibers theoretically can improve and also regulate the anisotropy of the gel mechanics and may delay the collagen block deformation. Figure 4a displays the schematic illustration of hMSCs being incorporated into collagen gel combined with crisscrossed PMMA fibers. Data for the cell line, MC3T3-E1 subclone 4, incorporated into collagen gel combined with PCL fibers can also be found in supplementary data (Figure S6). We next investigated the effect of these printed fibers on the cells encapsulated inside the collagen gel. Figure 4b displays top view of fiber:hMSCs-loaded collagen gel composites. This image is a projection of Z stack images with a total depth of 65 µm. Figure 4c and 4d show three-dimensional views of Figure 4b and indicate uniform distribution of hMSCs inside the gel. Figure 4d is hue colored-map of 3D image of Figure 4c, and helps visualize the morphology of hMSCs at different depths inside the collagen gel. To ease discussion of how the fibers may affect morphology of cells based on position inside the collagen gel, we have labeled four of the cells in all three images (Figure 4b – 4d). Cell number 1 is closely associated with a PMMA fiber, and as it is shown in Figure 4c it is located in the depth of approximately 60 µm (PMMA fibers indicated with green arrows). In contrast, cell number 3 located on the top of the block with a depth of approximately 10 µm far from the fibers (Figure 4c). We also observed when cells sense the fibers (such as cells number 1), they tend to remodel and stretch along the direction of the fibers inside the gel.
Figure 4.

Schematic illustrations, fluorescence images and orientation characterization of fiber:hMSCs-loaded collagen gel composites, a) cells grow inside the gel with the presence of PMMA fibers b) top view of fiber:hMSCs-loaded collagen gel composites (a projection of 120 Z stacks images). c and d) Three-dimensional fluoresce and depth-coded views of image b which display hMSCs located in different depth of the gel. Four of the cells are labeled to assist discussion in the manuscript. e – h) Fluorescence image and alignment-coded images of hMSC cytoskeletal actin orientation either inside the gel distal to a fiber or inside the gel adjacent to a PMMA fiber (Red arrow shows fiber direction). i) Histograms of the hMSCs cytoskeletal actin orientation distribution with and without the presence of PMMA fibers. j) hMSC width when either distal to a fiber or adjacent to a fiber. In this graph statistically significant differences are indicated by a bracket connecting two groups with “*” (n = 20, p < 0.05)
Using OrientationJ, we next quantified whether cells respond to the presence of fibers inside the collagen networks or not. The quantification was based on cytoskeletal actin orientation and the results can be seen in Figure 4e – 4h. Figure 4e and 4g display the grayscale image of an hMSCs that is either spread inside gel or along a PMMA fiber (red arrow on Figure 4g shows fiber direction). And Figure 4f and 4h display a hue-saturation-brightness (HSB) color-coded map that demonstrates the angles of the oriented structures of cytoskeletal actin of the cells. As previously shown[50] cells inside 3D environments tend to spread in all directions (Figure 4e). In contrast in response to the presence of fibers inside the gels, cells spread and stretch in the fiber (Figure 4g). Based on the intensity distribution of Phalloidin in Figures 4f and 4h histograms of the orientation distribution of cytoskeletal actin with and without the presence of fibers were constructed. The green line in Figure 4i displays the orientation of cytoskeletal actin of the hMSCs adjacent to PMMA fibers. This group demonstrates two peaks at ± 90° confirming fibers printed inside the gel dictate the orientation of the cells and have direct effect on cell shape. Cells preferentially spread along the fibers when in close contact within the gel volume, which can be explained due to contact guidance and possibly the local differences in material stiffness. In contrast, cells in the absence of PMMA fibers have nearly uniform cytoskeletal actin orientation distribution in all directions, which is demonstrated by a decreased amplitude relative to the fiber reinforced gel. These changes in cell orientation inside 3D hydrogels have potential in regenerative medicine applications, such as, nerve guidance and muscle regeneration in addition to other tissue where cell orientation within a 3D volume needs to be constrained. The elongation of cells in contact with fibers was further indicated by a decrease short axis length, or cell width. To examine the difference in cell width within the gel, Z stacks of fluorescence images were used. Figure 4j shows that cell width is significantly less when adjacent to an embedded than the when they are freely growing inside the gel. This type of composite enables researchers to create more sophisticated platforms for studying cell behavior and regenerative medicine such as designing blood vessels inside the gel. Future efforts will focus on adding additional extruders to deposit the collagen gels and nanofibers simultaneously.
In summary, we demonstrated a novel technology that uses a combination of two versatile and inexpensive techniques, electrospinning and 3D printing, to produce a highly automated method for fabrication of polymeric fibers. Fiber diameters were found to be in the range of 1.857 ± 0.407 µm with uniform alignment of the fibers in the target direction. As expected, patterned PPMA fibers completely supported the hMSCs cellular growth. Finally, we demonstrated the feasibility of PMMA fiber composites with 3D cell-loaded collagen gels to both increase the anisotropic properties of gels and also preferentially align cells with the cell-loaded gels. Additionally, 3DNFES offers a high throughput fabrication method of electrospun mats with the following advantages: 1) ability to spin polymer fibers on nonconductive surfaces such as glass, polymer coated glass and collagen layer, 2) providing a precise and controlled patterns of fibers on relatively large scale with minimum material consumption, 3) enabling the combination of all three directions of X, Y and Z for printing fibers, 4) inexpensive and easy method compared to other available methods, and finally 5) easy to combine with other pre-patterned nanostructures or microstructured biomaterials such as hydrogels. These findings suggest that 3DNFES can be applied as an alternative and innovative way to create various 3D nano and micro-scale objects including bio-scaffolds for application in regenerative medicine, MEMS, biosensor and flexible electronics.
Materials and Methods
Equipment Setup
The Makerfarm 3D printer (Prusa 8" i3v Kit (V-Slot Extrusion)), typically used for conventional electrospinning, was tailored to function as a near-field electrospinning device. In brief detail, the near-field electrospinning printer set-up consisted of a Makerfarm platform, syringe pump (New Era Syringe Pump, Farmingdale, NY), syringe stage (vertically over the collector), a 25-gauge needle, a high-voltage supply source, and a grounded flat collector (20 cm × 20 cm) replaced by the 3D printer heating stage, Figure S1.
Fabrication of Aligned PMMA and PCL Fibers
Polymer solutions of 16 – 24 % Poly(methyl methacrylate) (PMMA) (Sigma-Aldrich) in nitromethane (and PCL (MW 80,000) in acetone and acetic acid (V1/V2, 80/20), supplementary data) were mixed with heat for ~8 h on a stirring hot plate. The polymer solution was injected through a 25-gauge needle at a flow rate of 50 – 150 µL h−1. For deposition of 16 – 24 % PMMA fibers, 1.6 kV was applied and the spinneret-to-collector distance was set at 2 mm. While the PMMA fibers collected on the target, the stage and nozzle moved in X- and Y- directions at a stage displacement speed of 60 mm s−1. Repetier software was used to set the pattern and collector movement of the microfibers. To improve the fiber formation on the non-conductive surfaces we treat each surface with air-plasma for less than 10 sec.
Cell Culture and Fluorescence Microscopy
Human mesenchymal stem cells (hMSCs), passage 6–11 (and Mouse preosteoblast cells (American Type Culture Collection (ATCC), Manassas, VA, MC3T3-E1, passage 33–45) in supplementary data) were maintained in alpha modified minimum essential medium (α-MEM), 10% fetal bovine serum (FBS), and 1% penicillin streptomycin (Pen-Strep). hMSCs were cultured at 37 °C with 5% CO2 in a humidified incubator. Immunostaining was performed to stain F-actin and nuclei following a previously published method.[51] In brief, cells were fixed in 3.7% paraformaldehyde for 15 minutes and incubated with a permeabilization buffer (3% bovine serum albumin and 0.1% Triton X-100 in phosphate-buffered saline (PBS)) for 45 minutes at room temperature. Cells were incubated with a 1:1000 dilution of Phalloidin in permeabilization buffer for 30 minutes to fluorescently label actin and a 1:5000 dilution of DAPI in permeabilization buffer for 15 minutes to stain nuclei. Immunostained samples were mounted with Fluoromount-G™ (SouthernBiotech) and imaged at 10X with a Leica DM5500 upright microscope (Leica Microsystems, Buffalo Groove, IL). A live/dead cell imaging kit (488/570, Thermo Fisher Scientific) was used to assess cell viability of hMSCs in collagen cells in gel and on PMMA fibers. Equal volumes of 2X working solution (mixture of Live Green and Dead Red) and cell culture media was added to the cells and incubated for 15 minutes at room temperature, Figure S3.
Quantification of Cell Morphological Parameters and Cell Orientation in Hydrogel
Morphological analysis was performed on immunofluorescent images. The “Measure Object Size and Shape Module” in CellProfiler software (Broad Institute, USA) was used to calculate morphological parameters such as cell nuclei orientation, cell area and cell perimeter. The cell alignment was measured by the angle between nuclei and vertical axis. An example of cell analysis can be found in supplementary data, Figure S3. For analysis of cell actin orientation inside the gel we used OrientationJ, an ImageJ plug-in, available online at http://bigwww.epfl.ch/demo/orientation. Measurement of angles orientation histogram and creating a hue-saturation-brightness (HSB) color-coded map of actin orientation were explained in details by Rezakhaniha et al., and can be found in details in [52].
Collagen gel, Cell-loaded Gel
For collagen gel preparation, a basic solution (1 N NaOH) was used to neutralize the acidic collagen solution (3.3 mg/ml, Collagen I, rat tail, BD Biosciences). First, 10X PBS (100 µl) was added to the collagen solution (~590 µL). NaOH (14.75 µl) was added to adjust the pH to an alkaline milieu. hMSCs (MC3T3 in supplementary data) and culture media (~295 µL) were mixed and added to the neutralized gel to achieve a final concentration of 2 mg/ml. During the preparation, the gel solution was kept in on ice and for gelation, place the collagen gel in a cell culture incubator at 37 °C with 5% CO2 for 30 min.
Supplementary Material
Acknowledgments
We thank Brittany L. Banik for critical reading of the manuscript and Daniel T. Bowers for his valuable insights. We also would like to thank Dr. Tim Tighe for his help on operating AFM instrument. We acknowledge a US National Institutes of Health (NIH) R03 grants (AR065192), and the start up funds at the Pennsylvania state university.
Footnotes
Supporting Information is available from the Wiley Online Library or from the author.
Contributor Information
Pouria Fattahi, Department of Biomedical Engineering, Pennsylvania State University, University Park, PA 16802 (USA).
Jordan T. Dover, Department of Biomedical Engineering, Pennsylvania State University, University Park, PA 16802 (USA)
Justin L. Brown, Department of Biomedical Engineering, Pennsylvania State University, University Park, PA 16802 (USA), JLB92@psu.edu, Phone: 814-865-5190
References
- 1.Langer R, Vacanti J. Science (80-.) 1993;260:920. doi: 10.1126/science.8493529. [DOI] [PubMed] [Google Scholar]
- 2.Yang F, Murugan R, Wang S, Ramakrishna S. Biomaterials. 2005;26:2603. doi: 10.1016/j.biomaterials.2004.06.051. [DOI] [PubMed] [Google Scholar]
- 3.Salgado AJ, Oliveira JM, Martins A, Teixeira FG, Silva Na, Neves NM, Sousa N, Reis RL. Int. Rev. Neurobiol. 2013:1–33. doi: 10.1016/B978-0-12-410499-0.00001-0. [DOI] [PubMed] [Google Scholar]
- 4.Howard D, Buttery LD, Shakesheff KM, Roberts SJ. J. Anat. 2008;213:66. doi: 10.1111/j.1469-7580.2008.00878.x. [DOI] [PMC free article] [PubMed] [Google Scholar]
- 5.Geckil H, Xu F, Zhang X, Moon S, Demirci U. Nanomedicine (Lond) 2010;5:469. doi: 10.2217/nnm.10.12. [DOI] [PMC free article] [PubMed] [Google Scholar]
- 6.Onoe H, Okitsu T, Itou A, Kato-Negishi M, Gojo R, Kiriya D, Sato K, Miura S, Iwanaga S, Kuribayashi-Shigetomi K, Matsunaga YT, Shimoyama Y, Takeuchi S. Nat. Mater. 2013;12:584. doi: 10.1038/nmat3606. [DOI] [PubMed] [Google Scholar]
- 7.Kang H-W, Lee SJ, Ko IK, Kengla C, Yoo JJ, Atala A. Nat. Biotechnol. 2016;34:312. doi: 10.1038/nbt.3413. [DOI] [PubMed] [Google Scholar]
- 8.Dinis TM, Elia R, Vidal G, Auffret A, Kaplan DL, Egles C. ACS Appl. Mater. Interfaces. 2014;6:16817. doi: 10.1021/am504159j. [DOI] [PubMed] [Google Scholar]
- 9.Zhu P, Lin A, Tang X, Lu X, Zheng J, Zheng G, Lei T. AIP Adv. 2016;6:55304. [Google Scholar]
- 10.Dahlin RL, Kasper FK, Mikos AG. Tissue Eng. Part B Rev. 2011;17:349. doi: 10.1089/ten.teb.2011.0238. [DOI] [PMC free article] [PubMed] [Google Scholar]
- 11.Mo XM, Xu CY, Kotaki M, Ramakrishna S. Biomaterials. 2004;25:1883. doi: 10.1016/j.biomaterials.2003.08.042. [DOI] [PubMed] [Google Scholar]
- 12.Higgins AM, Banik BL, Brown JL. Integr. Biol. 2015;7:229. doi: 10.1039/c4ib00225c. [DOI] [PMC free article] [PubMed] [Google Scholar]
- 13.Ozdemir T, Xu L-C, Siedlecki C, Brown JL. Integr. Biol. 2013;5:1407. doi: 10.1039/c3ib40068a. [DOI] [PubMed] [Google Scholar]
- 14.Muerza-Cascante ML, Haylock D, Hutmacher DW, Dalton PD. Tissue Eng. Part B Rev. 2015;21:187. doi: 10.1089/ten.TEB.2014.0347. [DOI] [PubMed] [Google Scholar]
- 15.Ren J, Blackwood Ka, Doustgani A, Poh PP, Steck R, Stevens MM, Woodruff Ma. J. Biomed. Mater. Res. Part A. 2014;102:3140. doi: 10.1002/jbm.a.34985. [DOI] [PubMed] [Google Scholar]
- 16.Rajabzadeh S, Maruyama T, Sotani T, Matsuyama H. Sep. Purif. Technol. 2008;63:415. [Google Scholar]
- 17.Wang F, Liu Z, Wang B, Feng L, Liu L, Lv F, Wang Y, Wang S. Angew. Chemie - Int. Ed. 2014;53:424. doi: 10.1002/anie.201308795. [DOI] [PubMed] [Google Scholar]
- 18.Hu X, Liu S, Zhou G, Huang Y, Xie Z, Jing X. J. Control. Release. 2014;185:12. doi: 10.1016/j.jconrel.2014.04.018. [DOI] [PubMed] [Google Scholar]
- 19.Xie J, Liu W, MacEwan MR, Bridgman PC, Xia Y. ACS Nano. 2014;8:1878. doi: 10.1021/nn406363j. [DOI] [PMC free article] [PubMed] [Google Scholar]
- 20.Pham QP, Sharma U, Mikos AG. Tissue Eng. 2006;12:1197. doi: 10.1089/ten.2006.12.1197. [DOI] [PubMed] [Google Scholar]
- 21.Reneker DH, Yarin AL. Polymer (Guildf) 2008;49:2387. [Google Scholar]
- 22.Barnes CP, Sell SA, Boland ED, Simpson DG, Bowlin GL. Adv. Drug Deliv. Rev. 2007;59:1413. doi: 10.1016/j.addr.2007.04.022. [DOI] [PubMed] [Google Scholar]
- 23.Reneker DH, Yarin AL, Fong H, Koombhongse S. J. Appl. Phys. 2000;87:4531. [Google Scholar]
- 24.Long Y-Z, Yu M, Sun B, Gu C-Z, Fan Z. Chem. Soc. Rev. 2012;41:4560. doi: 10.1039/c2cs15335a. [DOI] [PubMed] [Google Scholar]
- 25.Yang D, Lu B, Zhao Y, Jiang X. Adv. Mater. 2007;19:3702. [Google Scholar]
- 26.Teo WE, Ramakrishna S. Nanotechnology. 2006;17:R89. doi: 10.1088/0957-4484/17/14/R01. [DOI] [PubMed] [Google Scholar]
- 27.Sun D, Chang C, Li S, Lin L. Nano Lett. 2006;6:839. doi: 10.1021/nl0602701. [DOI] [PubMed] [Google Scholar]
- 28.Pan C-T, Yen C-K, Lin L, Lu Y-S, Li H-W, Huang JC-C, Kuo S-W. RSC Adv. 2014;4:21563. [Google Scholar]
- 29.Di Camillo D, Fasano V, Ruggieri F, Santucci S, Lozzi L, Camposeo A, Pisignano D. Nanoscale. 2013;5:11637. doi: 10.1039/c3nr03094f. [DOI] [PMC free article] [PubMed] [Google Scholar]
- 30.Lei TP, Lu XZ, Yang F. AIP Adv. 2015;5:41301. [Google Scholar]
- 31.Chang C, Limkrailassiri K, Lin L. Appl. Phys. Lett. 2008;93:123111. [Google Scholar]
- 32.Bisht GS, Canton G, Mirsepassi A, Kulinsky L, Oh S, Dunn-Rankin D, Madou MJ. Nano Lett. 2011;11:1831. doi: 10.1021/nl2006164. [DOI] [PubMed] [Google Scholar]
- 33.Ozbolat IT. Trends Biotechnol. 2015;33:395. doi: 10.1016/j.tibtech.2015.04.005. [DOI] [PubMed] [Google Scholar]
- 34.Duan B. Ann. Biomed. Eng. 2017;45:195. doi: 10.1007/s10439-016-1607-5. [DOI] [PubMed] [Google Scholar]
- 35.Murphy SV, Atala A. Nat. Biotechnol. 2014;32:773. doi: 10.1038/nbt.2958. [DOI] [PubMed] [Google Scholar]
- 36.He J, Xu F, Cao Y, Liu Y, Li D. J. Phys. D. Appl. Phys. 2016;49:55504. [Google Scholar]
- 37.Zhu J, Lin X, Zhang Z, Luo X. RSC Adv. 2015;5:24975. [Google Scholar]
- 38.Zheng G, Sun L, Wang X, Wei J, Xu L, Liu Y, Zheng J, Liu J. Appl. Phys. A. 2016;122:112. [Google Scholar]
- 39.Ding Y, Duan Y, Huang Y. Energy Technol. 2015;3:351. [Google Scholar]
- 40.Duan Y, Huang Y, Yin Z, Bu N, Dong W. Nanoscale. 2014;6:3289. doi: 10.1039/c3nr06007a. [DOI] [PubMed] [Google Scholar]
- 41.Sun B, Long Y-Z, Liu S-L, Huang Y-Y, Ma J, Zhang H-D, Shen G, Xu S. Nanoscale. 2013;5:7041. doi: 10.1039/c3nr01832f. [DOI] [PubMed] [Google Scholar]
- 42.Persano L, Camposeo A, Pisignano D. Prog. Polym. Sci. 2015;43:48. [Google Scholar]
- 43.Zheng G, Li W, Wang X, Wu D, Sun D, Lin L. J. Phys. D. Appl. Phys. 2010;43:415501. [Google Scholar]
- 44.Lamprecht MR, Sabatini DM, Carpenter AE. Biotechniques. 2007;42:71. doi: 10.2144/000112257. [DOI] [PubMed] [Google Scholar]
- 45.Carpenter AE, Jones TR, Lamprecht MR, Clarke C, Kang I, Friman O, Guertin Da, Chang J, Lindquist Ra, Moffat J, Golland P, Sabatini DM. Genome Biol. 2006;7:R100. doi: 10.1186/gb-2006-7-10-r100. [DOI] [PMC free article] [PubMed] [Google Scholar]
- 46.Huang C, Ozdemir T, Xu L-C, Butler PJ, Siedlecki Ca, Brown JL, Zhang S. J. Biomed. Mater. Res. Part B Appl. Biomater. 2016;104:488. doi: 10.1002/jbm.b.33397. [DOI] [PMC free article] [PubMed] [Google Scholar]
- 47.Mohanty S, Larsen LB, Trifol J, Szabo P, Burri HVR, Canali C, Dufva M, Emnéus J, Wolff A. Mater. Sci. Eng. C. 2015;55:569. doi: 10.1016/j.msec.2015.06.002. [DOI] [PubMed] [Google Scholar]
- 48.Wallace D. Adv. Drug Deliv. Rev. 2003;55:1631. doi: 10.1016/j.addr.2003.08.004. [DOI] [PubMed] [Google Scholar]
- 49.Yu YZ, Zheng LL, Chen HP, Chen WH, Hu QX. Adv. Manuf. 2014;2:231. [Google Scholar]
- 50.Baker BM, Chen CS. J. Cell Sci. 2012;125:3015. doi: 10.1242/jcs.079509. [DOI] [PMC free article] [PubMed] [Google Scholar]
- 51.Jaiswal D, Brown JL. J. Biomed. Mater. Res. - Part A. 2012;100 A:2921. doi: 10.1002/jbm.a.34234. [DOI] [PubMed] [Google Scholar]
- 52.Rezakhaniha R, Agianniotis A, Schrauwen JTC, Griffa A, Sage D, Bouten CVC, van de Vosse FN, Unser M, Stergiopulos N. Biomech. Model. Mechanobiol. 2012;11:461. doi: 10.1007/s10237-011-0325-z. [DOI] [PubMed] [Google Scholar]
Associated Data
This section collects any data citations, data availability statements, or supplementary materials included in this article.