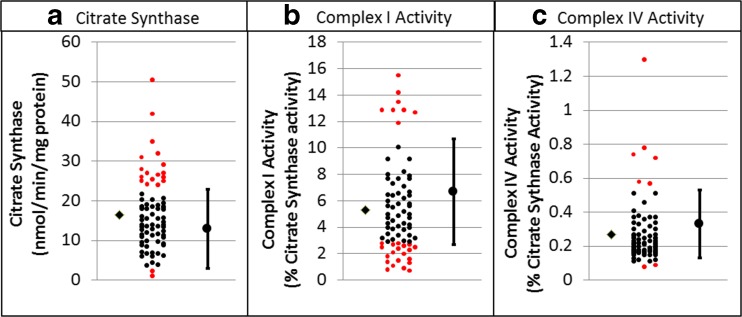
Fig. 1.
Activity of Citrate Synthase and activities of Complex I and IV normalized to Citrate Synthase for children with Autism Spectrum Disorder (ASD). For each graph the control mean and minimal and maximum limits of normal controls are provided on the right. Individual participant data is provided in the center of each graph with individuals having values outside of the normal range highlighted in red. The mean of the ASD group is depicted on the left of the individual data points as diamond

