

Abstract
Growing evidence suggests that Autism Spectrum Disorder (ASD) involves abnormalities of multiple functional networks. Neuroimaging studies of ASD have therefore increasingly focused on connectivity. Many functional connectivity (fcMRI) studies have reported network underconnectivity in children and adults with ASD. However, there are notable inconsistencies, with some studies reporting overconnectivity. A previous literature survey suggested that a few methodological factors play a crucial role in differential fcMRI outcomes. Using three ASD data sets (two task‐related, one resting state) from 54 ASD and 51 typically developing (TD) participants (ages 9–18 years), we examined the impact of four methodological factors: type of pipeline (co‐activation vs. intrinsic analysis, related to temporal filtering and removal of task‐related effects), seed selection, field of view (whole brain vs. limited ROIs), and dataset. Significant effects were found for type of pipeline, field of view, and dataset. Notably, for each dataset results ranging from robust underconnectivity to robust overconnectivity were detected, depending on the type of pipeline, with intrinsic fcMRI analyses (low bandpass filter and task regressor) predominantly yielding overconnectivity in ASD, but co‐activation analyses (no low bandpass filter or task removal) mostly generating underconnectivity findings. These results suggest that methodological variables have dramatic impact on group differences reported in fcMRI studies. Improved awareness of their implications appears indispensible in fcMRI studies when inferences about “underconnectivity” or “overconnectivity” in ASD are made. In the absence of a gold standard for functional connectivity, the combination of different methodological approaches promises a more comprehensive understanding of connectivity in ASD. Hum Brain Mapp 35:4035–4048, 2014. © 2014 Wiley Periodicals,Inc.
Keywords: functional connectivity, fMRI, autism, resting state, region of interest, temporal filtering, task regression
INTRODUCTION
Autism Spectrum Disorder (ASD) is a highly prevalent developmental disorder characterized by communication and social interaction deficits, along with repetitive and restrictive behaviors [DSM‐IV‐TR, 2000]. While the causes of ASD remain unclear today, there is some consensus of genetic risk factors specifically affecting neural circuit formation [Eapen, 2011; Toro et al., 2010]. Growing evidence also suggests that ASD is not a localized brain disorder, but a disorder involving multiple functional networks [Müller, 2007; Rippon et al., 2007; Vissers et al., 2012; Wass, 2011]. Therefore, increasing focus in ASD research has been directed towards the study of functional and anatomical brain connectivity in the search for biomarkers. The need for connectivity studies is further supported by findings of overgrowth [Courchesne et al., 2001; Hazlett et al., 2011] and atypical microstructure [Weinstein et al., 2011; Wolff et al., 2012] of white matter in infants and toddlers with ASD.
Early studies of functional connectivity in ASD using positron emission tomography [Castelli et al., 2002; Horwitz et al., 1988] were hampered by this technique's virtual absence of temporal resolution. With the broad availability of functional MRI and its improved temporal resolution, more recently the number of functional connectivity MRI (fcMRI) studies of ASD has grown rapidly. Like conventional fMRI, fcMRI relies on the blood oxygenation level dependent (BOLD) signal, which indirectly reflects neuronal activity [Logothetis and Pfeuffer, 2004]. Whereas conventional fMRI models the variance of BOLD time series with respect to task designs, fcMRI detects interregional cross‐correlations of the BOLD signal [Biswal et al., 1995; Fox and Raichle, 2007]. Correlations in the low‐frequency domain [c. 0.1 > f > 0.01 Hz; Cordes et al., 2001] are thought to reflect network‐specific fluctuations in local field potentials [Leopold et al., 2003; Schölvinck et al., 2010]. This fcMRI approach with focus on spontaneous, low‐frequency BOLD fluctuations is commonly called intrinsic fcMRI [Van Dijk et al., 2010] and has been successfully implemented in studies of numerous networks, such as motor [Biswal et al., 1995; Jiang et al., 2004], visual [Cordes et al., 2000; Lowe et al., 1998; Nir et al., 2006], language [Hampson et al., 2002], reading [Koyama et al., 2011], working memory [Lowe et al., 2000], task control [Dosenbach et al., 2007; Seeley et al., 2007], default mode [Fox et al., 2005; Greicius et al., 2003], or attention [Fox et al., 2006] systems. Although resting state (RS) fMRI data are commonly used for the study of intrinsic functional connectivity, network‐specific synchronized low‐frequency BOLD fluctuations can also be extracted from fMRI data acquired during task performance, by regressing out the task effects [Fair et al., 2007; Van Dijk et al., 2010].
As pointed out by Horwitz [2003], however, functional connectivity is a loosely defined term both conceptually and methodologically. Interestingly, the ASD literature has been dominated by fcMRI approaches that differ substantially from the intrinsic fcMRI approach that is most common in the non‐ASD literature [Cole et al., 2010; Fair et al., 2007; Fox and Raichle, 2007; Schölvinck et al., 2010; Van Dijk et al., 2010]. In a landmark study, Just et al. [2004] proposed an “underconnectivity theory” of ASD based on findings of reduced BOLD synchronization among regions of interest (ROIs) in a sentence comprehension task [see updated review in Just et al., 2012]. Corresponding underconnectivity findings in ASD were subsequently reported in a large number of fcMRI studies for finger movement [Mostofsky et al., 2009], visuomotor coordination [Villalobos et al., 2005], face processing [Kleinhans et al., 2008], verbal working memory [Koshino et al., 2005], sentence comprehension [Kana et al., 2006], response inhibition [Kana et al., 2007; Lee et al., 2009], embedded figures [Damarla et al., 2010], problem solving [Just et al., 2007], cognitive control [Solomon et al., 2009], self‐representation [Lombardo et al., 2010], and tasks tapping into theory of mind [Kana et al., 2009; Mason et al., 2008]. While most of these studies tested for BOLD correlations that included task effects, others followed procedures corresponding to intrinsic fcMRI analysis. Notably, many of these reported findings that were partly [Di Martino et al., 2011; Ebisch et al., 2011; Lynch et al., in press; Mizuno et al., 2006; Monk et al., 2009; Rudie et al., 2013; Turner et al., 2006] or completely [Keehn et al., 2013a; Noonan et al., 2009; Shen et al., 2012; Shih et al., 2010, 2011] inconsistent with the underconnectivity theory.
Given the heterogeneity of the disorder, cohort effects cannot be completely ruled out as a contributor to these inconsistencies. However, the strict adherence of fcMRI studies to consistent diagnostic procedures considered gold standard [Lord et al., 1994, 2001] makes it likely that methodological factors play a more crucial role in differential fcMRI outcomes. As mentioned, one striking feature of many fcMRI studies on ASD is the inclusion of BOLD variance driven by task performance. This co‐activation approach differs from intrinsic fcMRI approaches in the broader fcMRI literature. Jones et al. [2010] examined the effect of task regression in fcMRI analysis and found that underconnectivity findings from co‐activation analysis of an ASD dataset, i.e., without task regression (removal of task‐driven effects), were diminished when task effects were modeled as nuisance regressors in the analyses. While this finding was consistent with a survey of a large number of ASD fcMRI studies by our group [Müller et al., 2011], this survey also showed that an additional finding by Jones and colleagues [2010], according to which global signal regression was the main factor generating overconnectivity effects in ASD, was not consistent with the bulk of the literature. Instead, results from this survey [Müller et al., 2011], which can be considered the precursor to the present study, highlighted potential methodological factors in addition to task regression, namely temporal filtering, field of view (FOV; i.e., detection of effects in limited ROIs vs. the whole brain), and possibly seed selection.
While the survey identified methodological variables that may be crucial for inconsistencies in the ASD fcMRI literature, it also highlighted the need for further empirical investigation. The current study provides such an investigation by examining the effects of specific methodological variables in fcMRI analysis in systematic and quantitative fashion. Three ASD datasets were used for comparative analyses: two event‐related datasets acquired during task performance (one using a visual search [VS] paradigm and the other using the rapid serial visual presentation [RSVP] paradigm [Serences et al., 2005]), and one resting‐state dataset. Based on our previous literature survey [Müller et al., 2011], we hypothesized that methodological choices corresponding to co‐activation analysis (without task regression and low bandpass filtering) would tend to yield underconnectivity findings in ASD, especially when effects were examined in activation‐based ROIs (rather than across the whole brain), whereas those corresponding to intrinsic fcMRI (with task regression and low bandpass filtering) would tend to yield overconnectivity results. Furthermore, we examined whether the source for seed placement (e.g., activation in TD vs. ASD groups) or the type of dataset (acquired during task performance vs. rest) would affect the pattern of between‐group fcMRI findings.
METHODS
Participants
The study included 54 ASD and 51 TD participants. Of these 27 ASD and 24 TD participants were recruited for the VS study. After exclusion for excessive head motion (>1.5 mm), 19 ASD and 19 TD participants, matched for age, handedness, sex, IQ, and head motion, were retained for the VS study. For the RSVP and RS studies, 27 ASD and 27 TD participants were scanned. For the RS study, five ASD and two TD participants were excluded for excessive motion, reducing the sample for this dataset to 21 ASD and 25 age, handedness, and IQ‐matched TD participants. An additional two participants, one from each group, were excluded from the RSVP sample due to red–green color‐blindness affecting task performance, reducing the final sample for this study to 20 ASD and 24 age, handedness, and IQ‐matched TD participants (Table 1). No significant differences or interactions were detected between groups for errors or response time on the VS task. For the RSVP task, no significant differences between groups were found for response time, but the ASD group made significantly more errors than the TD group (Table 1).
Table 1.
Demographic data for ASD and TD groups for each dataset
| VS | RSVP | RS | |||||||
|---|---|---|---|---|---|---|---|---|---|
| TD (n = 20) | ASD (n = 19) | TD (n = 24) | ASD (n = 20) | TD (n = 25) | ASD (n = 21) | ||||
| Mean (SD) | Mean (SD) | Mean (SD) | Mean (SD) | Mean (SD) | Mean (SD) | ||||
| Range | Range | P | Range | Range | P | Range | Range | P | |
| Age (years) | 14.0 (2.5) | 13.8 (2.7) | 0.86 | 14.3 (1.5) | 14.2 (1.8) | 0.89 | 14.2 (1.7) | 15.0 (1.7) | 0.09 |
| 9.3–18.5 | 8.8–18.3 | 12.2–17.11 | 12.1–17.1 | 10.0–16.9 | 12.1–17.7 | ||||
| Verbal IQ | 110.0 (14.0) | 110.3 (14.0) | 0.94 | 106.7 (2.0) | 112.9 (3.3) | 0.12 | 106.2 (9.7) | 112.2 (15.8) | 0.12 |
| 74–133 | 88–147 | 87–126 | 83–147 | 87–126 | 83–147 | ||||
| Nonverbal IQ | 112.2 (12.3) | 113 (10.2) | 0.84 | 107.8 (2.3) | 112.6 (3.1) | 0.24 | 108.0 (11.3) | 112.4 (16.0) | 0.29 |
| 85–129 | 93–131 | 86–129 | 70–140 | 86–129 | 70–140 | ||||
| Handedness | 18 right, 2 left | 17 right, 2 left | 20 right, 4 left | 17 right, 3 left | 21 right, 4 left | 18 right, 3 left | |||
| Sex | All males | All males | Six females | One female | Six females | One female | |||
| Response time (ms) | 1167.4 (201.1) | 1224.7 (204.6) | 0.41 | 800.0 (28.9) | 819.6 (38.8) | 0.22 | — | — | |
| Error rate (%) | 9.1 (5.1) | 13.4 (9.3) | 0.11 | 15.3 (3.2) | 23.1 (6.4) | 0.01 | — | — | |
For all three studies, clinical diagnoses were confirmed using the Autism Diagnostic Interview–Revised (ADI‐R) [Rutter et al., 2003], the Autism Diagnostic Observation Schedule (ADOS) [Lord et al., 2001], and expert clinical judgment according to DSM‐IV criteria. Children with ASD‐related medical conditions (e.g., Fragile‐X syndrome, tuberous sclerosis), and other neurological conditions (e.g., epilepsy, Tourette's Syndrome) were excluded. Participants in the TD group had neither reported personal or family history of ASD nor any reported history of other neurological or psychiatric conditions. Informed assent and consent was obtained from all participants and their caregivers in accordance with the University of California, San Diego and San Diego State University Institutional Review Boards.
Data Acquisition
All MRI data were acquired on a GE 3T MR750 scanner with an eight‐channel head coil. High‐resolution structural images were acquired with a standard FSPGR T1‐weighted sequence (TR: 11.08 ms; TE: 4.3 ms; flip angle: 45°; FOV: 256 mm; 256 × 256 matrix; 180 slices; 1 mm3 resolution).
Visual search (VS) data were acquired in four functional runs, each consisting of 128 whole‐brain volumes acquired in 39 or 40 interleaved slices using a single‐shot, gradient‐recalled, echo‐planar pulse sequence (TR: 2500 ms; TE: 30 ms; flip angle: 90°; matrix: 64 × 64; slice thickness: 3.2 mm; in‐plane resolution: 3.4 mm2). Target stimulus was an upright “T” and distractors were Ts rotated 90°, 180°, and 270°. A total of 240 search trials, and 232 null trials were presented [for details see Supporting Information Figure 1 and Keehn et al., 2013b].
For rapid serial visual presentation (RSVP), four 6 min functional runs were obtained using a single‐shot gradient‐recalled, echo‐planar pulse sequence consisting of 180 whole‐brain volumes (TR: 2000 ms; TE: 30 ms; slice thickness: 3.4 mm; in‐plane resolution: 3.4 mm2). Stimuli included three streams of varying numbers presented in four iterations per trial (120 ms per iteration, 480 ms per trial; for details see Supporting Information Figure 2).
RS data were acquired in one 6:10 min scan using the same protocol as for RSVP. For this scan, participants were asked to keep their eyes fixated on a white cross‐hair in the center of a black rear‐projection screen, to relax, and to try not to fall asleep.
Preprocessing and Activation Analysis
All data were preprocessed and analyzed using the Analysis of Functional Neuroimages suite [AFNI; Cox, 1996]. The first four time points for each run were discarded to remove effects of signal instability, and slice‐time correction was performed. Functional data were coregistered to Talairach space, resampled to isotropic 3 mm voxels, and spatially smoothed to a global full‐width at half‐maximum (FWHM) of 5 mm, using AFNI's 3dBlurToFWHM.
VS and RSVP fMRI data were then scaled to a grand signal mean of 100, and concatenated to create a single time‐series. The hemodynamic impulse response function (IRF) for each stimulus type was estimated using a general linear model. Variable‐shape IRFs for each stimulus type were estimated using piecewise linear B‐spline (tent) basis functions. For RSVP, within‐ and between‐group t‐tests were used to assess activation for target‐present versus target‐absent trials. For VS, within‐ and between‐group t‐tests were used to assess activation for all search trials versus null trials. All statistical maps were corrected for multiple comparisons to a cluster corrected threshold of p < 0.05.
Seed Selection and Regions of Interest
The selection of dataset‐specific ROIs served two goals. First, it allowed us to determine whether group bias in seed ROI selection had any effect on functional connectivity findings. In simple terms, the question was whether a seed that was based on activation patterns detected in one group (rather than the other group or both groups combined) would affect the overall pattern of results. Second, selection of ROIs was required for the examination of the field of view variable, to compare effects within a given activation‐defined network (e.g., visual search network) to effects detected across the entire brain. As described above, this variable had been found crucial in our precursor study [Müller et al., 2011], as ASD underconnectivity studies were mostly those limited to effects within task‐specific networks, whereas studies reporting mixed or overconnectivity findings mostly examined effects across the whole brain.
Five ROIs each were identified for VS and RSVP based on the strongest activation clusters each from three separate one‐sample t‐tests (for TD group, ASD group, and both groups combined), generating three sets of ROIs: TD‐biased, ASD‐biased, and combined activation ROIs. These three sets of five ROIs each constituted the restricted FOV for the VS and RSVP datasets. For whole‐brain FOV analysis, one seed, corresponding to the cluster of strongest activation, was selected from each set (see Supporting Information Tables I and III for ROI coordinates). For the resting‐state dataset, the restricted FOV was the default mode or task negative network as defined by Fox and colleagues [2005] (see Supporting Information Table III for ROI coordinates), and the primary seed for whole brain FOV analysis was in posterior cingulate cortex. All ROIs had approximately equal volume of c.1,000 µl (30–40 voxels). For each ROI, a 6 mm radius sphere was drawn, centered at the reported coordinates, and voxels falling outside the group grey matter mask were removed. If this removal resulted in an ROI with <30 voxels, the radius was increased until an ROI volume in the target range was identified.
An additional set of ROIs was also used for direct comparison across all three datasets. These ROIs were adopted from the landmark study by Just et al. [2004], which was the first to report functional underconnectivity in ASD (see Fig. 1 for ROIs). Freesurfer parcels [Desikan et al., 2006; Fischl et al., 2004] corresponding to the regions, for which underconnectivity was reported by Just and colleagues, were trimmed to the size of 30–40 voxels each, to maintain consistency of ROI volumes across all analyses. A seed in LIFG was used as primary seed for whole brain FOV analysis, based on the main activation effect reported in this study for the TD group and the finding of underconnectivity for ROI pairs involving IFG.
Figure 1.

A: Correlation matrices for dataset‐specific ROIs. Note that for all matrices time series were averaged across all voxels within each ROI. VS dataset (top): Correlation matrices for intrinsic versus co‐activation pipelines and ROIs selected based on activation in the TD group—left and right middle occipital gyrus (RMO and LMO), right superior parietal lobule (RSPL), left supplementary motor area (LSMA), and left precuneus (LP); based on activation in the ASD group—right and left superior parietal lobule (RSPL and LSPL), right and left middle occipital gyrus (RMO and LMO), and left supplementary motor area (LSMA); and based on activation for both groups combined—right superior parietal lobule (RSPL), left middle occipital gyrus (LMO), left supplementary motor area (LSMA), left precuneus (LP), and left lingual gyrus (LLG). RSVP dataset (middle): Correlation matrices for ROIs selected based on activation in the TD group—left fusiform gyrus (LFG), right lingual gyrus (RLG), right middle occipital gyrus (RMOG), left inferior frontal gyrus (LIFG), and left precentral gyrus (LPG); based on activation in the ASD group—left precuneus (LP), right middle frontal gyrus (RMFG), right and left precentral gyrus (RPG and LPG), right supramarginal gyrus (RSG); and based on activation in both groups combined—left fusiform gyrus (LFG), left middle occipital gyrus (LMOG), right precentral gyrus (RPG), left inferior frontal gyrus (LIFG), and right lingual gyrus (RLG). RS dataset (bottom): Correlation matrices for DMN ROIs—posterior cingulate cortex/precuneus (PCC), retrosplenial cortex (RET‐SP), left and right lateral parietal cortex (LLP and RLP), left and right medial prefrontal cortex (LMPF and RMPF), left and right superior frontal gyrus (LSFG and RSFG), left and right parahippocampal gyrus (LPAR‐HIP and RPAR‐HIP)—for low band‐pass filtering versus no low‐pass filtering. +/−, significantly higher/lower r value on direct between‐group comparison; white solid squares indicate significantly greater connectivity than for comparison pipeline (dashed squares represent significantly reduced connectivity in comparison matrix). B: Correlation matrices from intrinsic FC analysis for each data set and for ROIs derived from Just et al. [2004]: calcarine fissure (CALC), left dorsolateral prefrontal cortex (LDLPFC), left inferior extrastriate (LIES), left inferior frontal gyrus (LIFG), left intraparietal sulcus (LIPS), and left superior temporal gyrus (LSTG). White squares indicate ROI pairs showing significant main effect of dataset in univariate ANOVA; solid squares represents highest r value, dashed squares medium r value, dotted squares lowest r value. C: Examples of divergent between‐group effects for co‐activation versus intrinsic pipeline, for VS dataset with seed in left middle occipital gyrus (based on TD activation); for RSVP dataset with seed in left fusiform gyrus (based on TD activation); for RS dataset with seed in posterior cingulate cortex (DMN). Negative x‐coordinate indicates sagittal slice through left hemisphere.
FCMRI Data Analysis: Co‐activation Versus Intrinsic Pipelines
Preprocessed data were subject to two analysis pipelines. The first pipeline was a co‐activation analysis (as described above), with no low‐pass filtering (NLP) or task regression. The second pipeline was an intrinsic fcMRI analysis, including low band‐pass (LBP) filtering at 0.008 < f < 0.08 Hz (applied to seed time series and all nuisance regressors) and task regression for the two task‐related datasets (VS, RSVP) to isolate intrinsic network‐specific BOLD fluctuations [Cordes et al., 2001; Lowe et al., 2000]. Orthogonal task regressors for each trial type were used (14 for VS, 9 for RSVP). Task regressors were convolved with a variable hemodynamic response, using AFNI's TENT function. Two different FOVs were applied in each pipeline: network‐specific (limited to ROIs) and whole brain. The ROIs adopted from Just et al. [2004] were only implemented for the intrinsic fcMRI pipeline, since no task‐activated data from the original study were available.
For each dataset, the average BOLD time course was extracted from each ROI in each set (as described above). In view of the known impact of head motion on BOLD correlations [Power et al., 2012; Van Dijk et al., 2012], several steps beyond conventional motion correction were taken in the preprocessing and analysis of each dataset to reduce the effects of head motion. Six rigid‐body motion parameters estimated from realignment of functional volumes were modeled as nuisance variables and removed with regression. Furthermore, time points with excessive motion (>1.5 mm displacement from one time point to the next) and their two immediate neighbors were censored from statistical analysis. A univariate ANOVA testing for group differences in motion (using the root mean square of displacement) across datasets indicated no main effects for dataset (p = 0.69) or group (p = 0.40), and no interaction effect between group and dataset (p = 0.89). For each dataset, time series from white matter and ventricular masks were also extracted for each participant using Freesurfer [Desikan et al., 2006; Fischl et al., 2004], trimmed to avoid overlap with grey matter. These time series were entered as nuisance variables in the general linear model testing for BOLD time series correlations between each seed ROI and other voxels in the brain.
Field of View
Analyses were performed either for all voxels across the entire brain or restricted to regions of interest. For ROI analyses (restricted FOV), data were analyzed in two ways: (1) For correlation matrices (presented in Fig. 1A,B), averaged time courses were extracted from each ROI and correlated against each other in a pairwise fashion. This served as a first‐pass approach for summary visualization of differences between co‐activation and intrinsic fcMRI pipelines (Fig. 1A,B). (2) For voxelwise ROI analyses (presented in Table 2), the averaged time course from each seed was tested for correlation with each voxel within the ROIs of the given network. This voxelwise approach served to compare the effects of restricted versus whole brain FOV, as part of an overall test of methodological variables presented in Table 2.
Table 2.
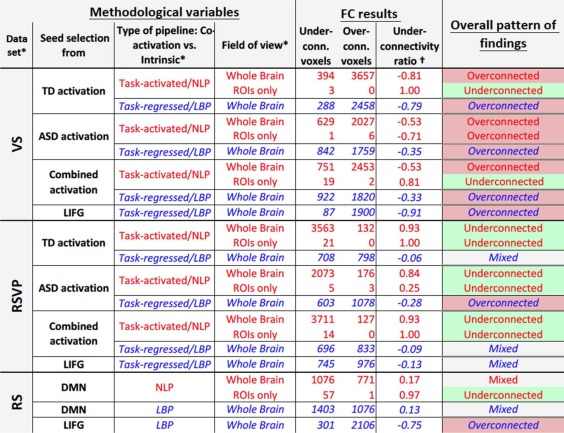
Overview of functional connectivity findings for different datasets and methodological variables [Color table can be viewed in the online issue, which is available at http://wileyonlinelibrary.com.]
|
Font color (web version only) indicates two main processing pipelines (red: co‐activation [retaining task effects without low‐pass filtering]; blue: intrinsic FC [isolating intrinsic fluctuation through low bandpass filtering and task regression]). NLP, no low‐pass filter; LBP, low bandpass filter. Seeds for each analysis are stated in the main text. Note that the LIFG seed corresponds to main ROI from Just et al. [2004], based on their activation and FC findings. Fill color in right column indicates main patterns of between group findings (UR ≥ 0.25: underconnected; UR ≤ −0.25: overconnected; all else: mixed). [Color Table can be viewed in the online issue, which is available at http://wileyonlinelibrary.com.]
Main effect p < 0.05;
(U − O)/(U + O)U, O = number of underconnected, overconnected voxels (p < 0.05, uncorrected).
Underconnectivity Ratio
For this test of methodological variables, a univariate ANOVA was run using type of dataset, seed selection, type of pipeline (co‐activation vs. intrinsic), and field of view as independent variables and an underconnectivity ratio (UR) for each condition as the dependent variable (Table 2). The UR was calculated as: UR = , where U and O equal the number of underconnected and overconnected voxels (p < 0.05, uncorrected), respectively, derived from direct between‐group comparisons. For detailed justification of the selected significance threshold, see Supporting Information (p. 2).
RESULTS
A summary of results is presented in Table 2, which lists the number of brain voxels with significant between‐group findings for each analysis.
Underconnectivity Versus Overconnectivity Results
Using cutoffs as stated in Table 2 for qualitative labeling of the overall pattern of findings for each analysis (listed in the right most column), we found that 9 of 24 analyses resulted in underconnectivity findings. All nine of these were generated by the co‐activation pipeline (no task regressor or low bandpass filter). Among these nine, six were generated by analyses with FOV restricted to activation ROIs. Two of the nine resulted from the VS, six from the RSVP, and one from the RS dataset. Conversely, 10 of the 24 analyses resulted in overconnectivity findings. Of these 10, six were generated by the intrinsic FC pipeline (with task regressors and low bandpass filter), and four by the co‐activation pipeline. Of the latter, three were generated by analyses with whole‐brain FOV. Eight of the 10 resulted from the VS, one from the RSVP, and one from the RS dataset.
An additional 5 of 24 analyses resulted in mixed connectivity findings. Four of these five were generated by the task‐regressed pipeline with low‐pass filter. All five were generated by analyses with whole‐brain FOV. Three of the five resulted from the RSVP dataset, and two from the RS dataset.
Individual Methodological Variables
Patterns of results differed for type of dataset, with two under‐ and eight overconnectivity findings for VS dataset, contrasted by six under‐ and only one overconnectivity finding for RSVP dataset. Results for RS dataset were overall mixed.
For the ROI selection variable, three of six analyses using seeds based on TD activation yielded underconnectivity, two overconnectivity, and one mixed connectivity findings. For the six analyses using seeds based on ASD activation, four yielded overconnectivity findings, and two underconnectivity findings. For the six analyses using seeds based on combined activation of both groups, three yielded underconnectivity, two overconnectivity, and one mixed connectivity findings.
For the variable co‐activation versus intrinsic FC analysis (i.e., task effect and temporal filtering), 6 of 10 analyses for task‐related datasets (VS and RSVP) yielded overconnectivity findings for intrinsic FC analysis, while the other four produced mixed connectivity effects. Of the 14 co‐activation analyses using no low band‐pass filter and task regressors, nine resulted in underconnectivity, four in overconnectivity, and one in mixed connectivity findings. Correlation matrices for all ROI pairings contrasting results from co‐activation versus intrinsic FC pipelines, and examples of contrasting findings are shown in Figure 1.
For the FOV variable, six of seven analyses with FOV restricted to activation ROIs yielded underconnectivity findings, with one yielding overconnectivity findings. Of the 17 analyses using whole‐brain FOV, three resulted in underconnectivity findings, nine in overconnectivity finding, and four in mixed connectivity findings.
For the seed in LIFG selected based on Just et al. [2004], only the intrinsic FC pipeline with whole brain FOV was applied for all three datasets (as task‐activated data for sentence comprehension were not available). Two of these analyses yielded overconnectivity, and one mixed findings.
Underconnectivity Ratio
Results from the univariate ANOVA for the UR indicated three main effects (Fig. 2). We detected a main effect for type of pipeline (temporal filtering/task regression; F[1,22] = 8.77, p = 0.007), with the co‐activation pipeline (task‐activated, no low‐pass filter) obtaining a higher mean UR (M = 0.38) than the intrinsic FC pipeline (task‐regressed, low band‐pass filter; M = −0.35). A main effect was also found for FOV (F[1,22] = 7.87, p = 0.01), with a higher mean UR for ROI‐restricted FOV (M = 0.62) than for whole‐brain FOV (M = −0.15). An additional main effect was found for type of dataset (F[1,21] = 4.38, p = 0.04), with higher mean UR for the RSVP (M = 0.35) than the RS dataset (M = −0.10), and lowest mean UR for the VS dataset (M = −0.41). No significant interaction effects were detected.
Figure 2.
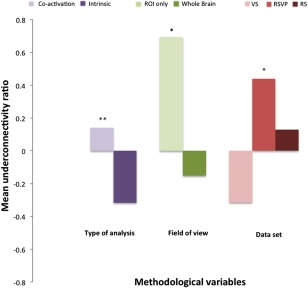
Underconnectivity ratios averaged across all pipelines (as shown in Table 2) for each variable for which main effects were detected in ANOVA. Underconnectivity ratios are higher for co‐activation type of analysis and for field of view limited to activation‐derived ROIs. Differences related to data set can also be seen, that is, more overconnectivity for VS than for RSVP, with RS falling in the middle. P values are based on main effects from ANOVA. **p < 0.01; *p < 0.05. [Color figure can be viewed in the online issue, which is available at http://wileyonlinelibrary.com.]
Additional Analyses
Following exclusion for head motion, samples were no longer sex‐matched for RSVP and RS datasets and age‐matched for the RS dataset. Since the main comparisons in this study were between data analysis pipelines for identical datasets, this was unlikely to affect the pattern of results. Nonetheless, we performed secondary analyses for fully sex‐ and age‐matched subsamples. The overall pattern of findings was similar for these subsamples (see Supporting Information Table IV).
DISCUSSION
The growing fcMRI literature in ASD has been marked by partially inconsistent findings [Vissers et al., 2012]. While cohort effects and heterogeneity within the population may play a role, it has been proposed that much of these inconsistencies may be accounted for by a few methodological variables [Jones et al., 2010; Müller et al., 2011]. The current study tested the effects of such candidate methodological variables on fcMRI results in systematic and quantitative fashion in three different datasets. Specifically, these methodological variables included type of pipeline (co‐activation vs. intrinsic), seed selection, field of view (FOV), and type of dataset. The findings were largely consistent with our hypotheses derived from an earlier literature survey [Müller et al., 2011]. Three variables (type of pipeline, FOV, and type of dataset) had significant impact on the overall pattern of findings, which ranged from strong underconnectivity to strong overconnectivity. More specifically, co‐activation analyses (without low‐pass temporal filters and removal of task effects) were likely to yield underconnectivity findings in ASD, whereas intrinsic FC analyses, which isolated spontaneous BOLD fluctuations through low bandpass filtering and task regression, generated mostly overconnectivity findings. The latter was most pronounced when FC effects were detected across the whole brain, rather than limited to ROIs. Remarkably, for each of our three datasets, competing pipelines generated both strong underconnectivity and strong overconnectivity findings, depending on the mentioned methodological variables. Inspection of FC matrices for network ROIs (Fig. 1A,B) suggests that differential effects across pipelines reflected shifts in the overall distribution of group differences (toward underconnectivity or overconnectivity), rather than complete inversions of effects (e.g., from strong underconnectivity for a given ROI pairing on one analysis to strong overconnectivity on another).
Intrinsic Versus Co‐activation FC
As hypothesized, differential data processing along co‐activation versus intrinsic FC analysis pipelines had significant effects on the overall pattern of between‐group findings, with co‐activation yielding mostly underconnectivity and intrinsic FC analysis mostly overconnectivity effects in the ASD group. This highlights the importance of a strict distinction between co‐activation and intrinsic FC analyses. Insufficient awareness of this distinction can be considered the major reason for the often stark inconsistencies in the fcMRI literature on ASD and the resulting misperceptions [Hughes, 2007]. As described in the Introduction, intrinsic fcMRI findings are more likely to reflect task‐independent network organization. Spontaneous neuronal activity fluctuations are observed at many temporal scales, from the very low frequencies detected in BOLD fMRI to high gamma [>80 Hz, Canolty et al., 2007], which can only be detected through intracranial recording and possibly in magnetoencephalography [Khan et al., 2013]. Oscillations at different frequencies have been found to be linked in a nesting relationship of cross‐frequency coupling, with the phase of lower‐frequency oscillations driving amplitude at higher frequencies [Canolty and Knight, 2010]. Specifically relevant to fcMRI is the observation that low‐frequency oscillations regulate distributed neuronal networks and are susceptible to environmental entrainment [Canolty and Knight, 2010]. Learning induced changes in network‐specific synchronized low‐frequency fluctuations have indeed been detected in fcMRI studies [Lewis et al., 2009; Schultz et al., 2012; Wang et al., 2012]. Intrinsic fcMRI, which isolates such distributed and synchronized very‐low frequency oscillations, is therefore considered to reflect large‐scale Hebbian synaptic changes, providing a window onto fundamental mechanisms of functional network organization [Johnson, 2011]. The finding of partial overconnectivity in ASD from intrinsic fcMRI analyses will be interpreted with regard to its possible neurofunctional relevance further below in the context of field of view.
The mentioned fundamental neurobiological relevance of intrinsic fcMRI does not imply that co‐activation analyses, which tend to yield underconnectivity findings—both based on the current study and the broader literature [Müller et al., 2011]—are not informative. However, one needs to be aware that findings from the co‐activation technique will predominantly reflect the effects of online cognitive and sensorimotor processing. If this processing occurs in a domain of known or suspected cognitive‐behavioral impairment, the finding of reduced BOLD correlations is expected. As discussed further below, the inverse is true for domains of relative strength in ASD [Keehn et al., 2013b].
Field of View
The detection of a significant main effect of FOV has both pragmatic and conceptual implications, although this finding requires some caution, given the small number of voxels entered into the computation of the underconnectivity ratio for several pipelines. Focus on ROIs selected based on their known or expected relevance for a functional domain of interest (e.g., face perception or theory of mind) has been rather common in ASD fcMRI studies because it may be considered to protect from detection of unexpected effects elsewhere in the brain that are hard to interpret. Selective presentation of findings was obvious, for example, in two studies [Agam et al., 2010; Ebisch et al., 2011], which also showed partial overconnectivity findings in Figures (5 and 2–3, respectively; confirmed by personal communication with authors), but exclusively discussed underconnectivity effects occurring within ROIs. Neglect of unexpected overconnectivity findings is equivalent to the exclusion of empirical “anomalies” in the context of normal science [Kuhn, 1962]—here: the theory of general underconnectivity in ASD—and therefore not surprising. However, such neglect runs the risk of missing crucial features of aberrant network organization in ASD.
A few recent studies have shown some indication of the underlying network characteristics. These studies suggest that network differentiation and specialization, which are emerging features of development in the typical brain [Johnson, 2011], may be impaired in ASD. Two of these [Rudie et al., 2012; Shih et al., 2011] reported reduced network differentiation in ASD, using seed‐based fcMRI analyses. Concordant findings for both functional and anatomical network organization from graph theory were more recently reported by Rudie et al. [2013]. While conceptually related, findings from the two groups differ in important respects. Whereas the studies by Rudie et al. [2012, 2013] suggest that overconnectivity findings may actually reflect reduced negative connectivity observed in TD groups, which could be interpreted as reduced inhibitory connectivity, this explanation does not account for findings by Shih et al. [2011] or similar results from other studies [Keehn et al., 2013b; Shen et al., 2012], all of which detected overconnectivity in ASD groups between brain regions that showed positive BOLD correlations in TD control groups. The latter was also true for analyses yielding overconnectivity effects in the present study.
Divergent findings may relate to the ongoing debate about global signal regression [GSR; Fox et al., 2009; Murphy et al., 2009]. Jones et al. [2010] first suggested that overconnectivity in ASD might be exclusively observed after GSR. In partial support, supplementary analyses in Rudie et al. [2012] show expansion of overconnectivity effects in ASD after GSR. However, while the shift in the distribution of correlations through GSR may surely have an effect on between‐group comparisons, it is unlikely that overconnectivity findings can be explained in this way. Several studies reporting (partial) overconnectivity in ASD did not employ GSR [Keehn et al., 2013b; Monk et al., 2009; Noonan et al., 2009; Shen et al., 2012; Shih et al., 2010, 2011; Welchew et al., 2005]. Since our precursor study [Müller et al., 2011] did not suggest any consistent effects of GSR, we did not implement GSR as a variable in the current study. Overconnectivity was found along numerous pipelines in three different datasets (Table 2), always in the absence of GSR. In addition to these empirical findings, methodological considerations also appear to speak against the use of GSR. With the implementation of nuisance regressors extracted from white matter and CSF, it is likely that some global signal fluctuations caused by signal instability or other global noise components can be statistically removed without GSR. Since the global signal probably includes true BOLD fluctuations across widespread brain networks [Schölvinck et al., 2010], additional use of GSR may therefore do more harm than good [Gotts et al., 2013; Saad et al., 2012].
Type of Dataset
We also found a significant main effect for type of dataset. Whereas the VS dataset yielded predominantly overconnectivity effects even when task effects were regressed out as nuisance variables, the RSVP dataset yielded mostly underconnectivity effects. The most likely explanation relates to the domain of processing the two different tasks tapped into. Visual search has been referred to as an “island of sparing,” with normal or even superior function in ASD [Keehn et al., 2013b; O'Riordan et al., 2001]. Conversely, behavioral performance on the RSVP task was reduced in ASD (compared to TD participants), suggesting that this task tapped into a subdomain of attention that is impaired in ASD [Allen and Courchesne, 2001; Keehn et al., 2013b] Our findings for VS are consistent with an often overlooked prediction of the underconnectivity theory by Just et al. [2004] that functional connectivity may actually be increased for domains of strength in ASD.
While performance differences between VS and RSVP would obviously affect co‐activation results, as indeed observed, note that even intrinsic FC analyses were impacted by task domain since seeds were selected based on activation for the respective tasks. However, findings for a seed in LIFG suggest that dataset‐specific differences were further affected by factors other than seed selection. Although predominance of overconnectivity (reflected in a negative UR) was found for all three datasets processed along the intrinsic whole brain FOV pipeline, its degree varied from robust (UR ≤ −0.75) for VS and RS to subtle (UR = −0.13) for RSVP. In particular, differential results for VS and RSVP may suggest that even thorough measures to remove effects of task‐related online processing (through multiple task regressors for each stimulus type and low bandpass filtering) were not entirely successful in isolating intrinsic non‐task driven BOLD fluctuations [cf. Fair et al., 2007]. However, note that cohorts for the two studies differed (e.g., VS included ASD participants under 12 years of age), which may have also contributed to divergent results.
The possibility of residual task effects confounding intrinsic fcMRI results may favor the use of RS, but caution is warranted. It is likely that individuals with ASD do not enter a typical self‐referential “default mode” as readily during instructed “resting” as TD controls [Kennedy et al., 2006]. In fact, little is known about what cognitive states and types of mind wandering [Mason et al., 2007] people with ASD go through in the absence of a clearly defined task. Since the RS does not permit monitoring of cognitive processing through measures of task performance, potential confounds due to systematic differences in response between TD and ASD cohorts are hard to rule out definitively. As a general conclusion, the recommendation must be to implement both RS and task‐regressed paradigms to identify consistency of intrinsic FC effects across datasets. The implementation of simple, but continuously engaging tasks, the effects of which may be more cleanly regressed out, could be advantageous.
Seed Selection
No significant effect was found for seed selection. However, this null finding may be attributed to the inclusion of only two task datasets in the study, which limited the number of pipeline comparisons. As discussed above, the two task datasets also differed heavily in the distribution of underconnectivity ratios (being shifted towards overconnectivity for VS, but underconnectivity for RSVP), which may have further reduced our ability to detect effects of seed selection. Note that inspection of individual analyses mostly showed differences in mean URs in the expected direction (higher for seeds based on TD activation than for those based on ASD activation), when co‐activation analyses were considered. Our null finding therefore by no means indicates that careful avoidance of group bias in the selection of seeds would be irrelevant. On the contrary, such selection is of great importance specifically in co‐activation analyses. However, compared to other methodological issues discussed above, seed selection bias has been avoided in many fcMRI studies of ASD and therefore does not constitute a major topic of debate.
Limitations
While we tested for between‐group effects along a large number of analysis pipelines, numerous other methodological, demographic, and clinical variables might affect fcMRI findings in ASD. We focused on contrasting findings from co‐activation and intrinsic fcMRI analyses. For pragmatic reasons (avoiding an unmanageable plethora of findings from even more pipelines), we combined task regression and low bandpass filtering, both of which serve the isolation of spontaneous low‐frequency fluctuations, and were therefore unable to test for any differential effects of these variables. Our study resorted to datasets with sample sizes of c.20 per group, which were not available for other task domains. In view of the stark differences between VS and RSVP datasets, it is likely that inclusion of data from different task domains might have affected some of our findings. Note, however, that the direction of differences in findings between pipelines was overall consistent across datasets.
Our cohorts were limited to children and adolescents, leaving the possibility that fcMRI methods may affect adult ASD in different ways. However, this appears unlikely given that our literature meta‐analysis [Müller et al., 2011], which included many adult studies, yielded highly consistent results. Our ASD cohort was also limited to high‐functioning participants, given the need for compliance with motion restraints. Very little is known about functional brain network organization at the low‐functioning end of the autism spectrum.
CONCLUSIONS
Our findings support the hypothesis that different analytic approaches, which can be grossly distinguished as co‐activation versus intrinsic fcMRI, have dramatic impact on group differences observed in comparisons between TD and ASD samples. In each dataset, results varied from strong underconnectivity to robust overconnectivity in ASD, depending on the type of analysis. Prevalent underconnectivity was exclusively found for co‐activation analyses, whereas each intrinsic fcMRI analysis yielded overconnectivity or mixed findings. The overall frequency of robustly prevalent overconnectivity findings in 10 of 24 analyses suggests that the still common model of underconnectivity in ASD [Just et al., 2007; Minshew and Williams, 2007; Schipul et al., 2011; Vissers et al., 2012; Wass, 2011] may have to be revised. This was also supported by our findings for a seed and ROIs adopted from the original milestone study reporting underconnectivity in ASD by Just et al. [2004], which instead showed mixed effects or strong overconnectivity, depending on dataset.
A more adequate model views fcMRI findings as a reflection of reduced network segregation and integration [Rudie et al., 2013] and of impaired local cortical differentiation [Shih et al., 2011] in ASD, which may result from the interplay between early cortical and white matter overgrowth [Courchesne et al., 2001; Weinstein et al., 2011; Wolff et al., 2012] and experience‐driven plasticity in cortical network formation [Johnson, 2011]. Advances in our understanding of functional network organization in ASD and its links with symptomatology and cognitive and sensorimotor impairment will require careful implementation of methods, preferably in the use of multiple functional datasets and with the addition of anatomical and other imaging measures, such as diffusion tensor imaging or magnetoencephalography. Using a spatial metaphor, given the large number of often inconsistent “one‐dimensional” reports on connectivity in ASD using a single imaging technique, it appears that only the parallel implementation of multiple imaging modalities and analysis techniques will allow to create views of connectivity from multiple angles and to form a “three‐dimensional picture” that can truly and reliably inform a more comprehensive understanding of network organization in ASD.
ACKNOWLEDGMENTS
The authors thank the participants and their families.
Supporting information
Supporting Information
Aarti Nair and Christopher L. Keown. contributed equally to this work.
REFERENCES
- Agam Y, Joseph RM, Barton JJ, Manoach DS (2010): Reduced cognitive control of response inhibition by the anterior cingulate cortex in autism spectrum disorders. Neuroimage 52:336–347. [DOI] [PMC free article] [PubMed] [Google Scholar]
- Allen G, Courchesne E (2001): Attention function and dysfunction in autism. Front Biosci 6:D105–D119. [DOI] [PubMed] [Google Scholar]
- Biswal B, Yetkin FZ, Haughton VM, Hyde JS (1995): Functional connectivity in the motor cortex of resting human brain using echo‐planar MRI. Magn Reson Med 34:537–541. [DOI] [PubMed] [Google Scholar]
- Canolty RT, Knight RT (2010): The functional role of cross‐frequency coupling. Trends Cogn Sci 14:506–515. [DOI] [PMC free article] [PubMed] [Google Scholar]
- Canolty RT, Soltani M, Dalal SS, Edwards E, Dronkers NF, Nagarajan SS, Kirsch HE, Barbaro NM, Knight RT (2007): Spatiotemporal dynamics of word processing in the human brain. Front Neurosci 1:185–196. [DOI] [PMC free article] [PubMed] [Google Scholar]
- Castelli F, Frith C, Happe F, Frith U (2002): Autism, Asperger syndrome and brain mechanisms for the attribution of mental states to animated shapes. Brain 125:1839–1849. [DOI] [PubMed] [Google Scholar]
- Cole DM, Smith SM, Beckmann CF (2010): Advances and pitfalls in the analysis and interpretation of resting‐state FMRI data. Front Syst Neurosci 4:1–15. [DOI] [PMC free article] [PubMed] [Google Scholar]
- Cordes D, Haughton VM, Arfanakis K, Wendt GJ, Turski PA, Moritz CH, Quigley MA, Meyerand ME (2000): Mapping functionally related regions of brain with functional connectivity MR imaging. AJNR Am J Neuroradiol 21:1636–1644. [PMC free article] [PubMed] [Google Scholar]
- Cordes D, Haughton VM, Arfanakis K, Carew JD, Turski PA, Moritz CH, Quigley MA, Meyerand ME (2001): Frequencies contributing to functional connectivity in the cerebral cortex in “resting‐state” data. AJNR Am J Neuroradiol 22:1326–1333. [PMC free article] [PubMed] [Google Scholar]
- Courchesne E, Karns CM, Davis HR, Ziccardi R, Carper RA, Tigue ZD, Chisum HJ, Moses P, Pierce K, Lord C, Lincoln AJ, Pizzo S, Schreibman L, Haas RH, Akshoomoff NA, Courchesne RY (2001): Unusual brain growth patterns in early life in patients with autistic disorder: An MRI study. Neurology 57:245–254. [DOI] [PubMed] [Google Scholar]
- Cox RW (1996): AFNI: Software for analysis and visualization of functional magnetic resonance neuroimages. Comput Biomed Res 29:162–173. [DOI] [PubMed] [Google Scholar]
- Damarla SR, Keller TA, Kana RK, Cherkassky VL, Williams DL, Minshew NJ, Just MA (2010): Cortical underconnectivity coupled with preserved visuospatial cognition in autism: Evidence from an fMRI study of an embedded figures task. Autism Res: Official J Int Soc Autism Res 3:273–279. [DOI] [PMC free article] [PubMed] [Google Scholar]
- Desikan RS, Segonne F, Fischl B, Quinn BT, Dickerson BC, Blacker D, Buckner RL, Dale AM, Maguire RP, Hyman BT, Albert MS, Killiany RJ (2006): An automated labeling system for subdividing the human cerebral cortex on MRI scans into gyral based regions of interest. Neuroimage 31:968–980. [DOI] [PubMed] [Google Scholar]
- Di Martino A, Kelly C, Grzadzinski R, Zuo XN, Mennes M, Mairena MA, Lord C, Castellanos FX, Milham MP (2011): Aberrant striatal functional connectivity in children with autism. Biol Psychiatry 69:847–856. [DOI] [PMC free article] [PubMed] [Google Scholar]
- Dosenbach NU, Fair DA, Miezin FM, Cohen AL, Wenger KK, Dosenbach RA, Fox MD, Snyder AZ, Vincent JL, Raichle ME, Schlaggar BL, Petersen SE (2007): Distinct brain networks for adaptive and stable task control in humans. Proc Natl Acad Sci USA 104:11073–11078. [DOI] [PMC free article] [PubMed] [Google Scholar]
- DSM‐IV‐TR (2000): Diagnostic and statistical manual of mental disorders (4th ed., text rev.). Washington, DC: DSM‐IV‐TR, American Psychiatric Association. [Google Scholar]
- Eapen V (2011): Genetic basis of autism: Is there a way forward? Curr Opin Psychiatry 24:226–236. [DOI] [PubMed] [Google Scholar]
- Ebisch SJ, Gallese V, Willems RM, Mantini D, Groen WB, Romani GL, Buitelaar JK, Bekkering H (2011): Altered intrinsic functional connectivity of anterior and posterior insula regions in high‐functioning participants with autism spectrum disorder. Hum Brain Mapp 32:1013–1028. [DOI] [PMC free article] [PubMed] [Google Scholar]
- Fair DA, Schlaggar BL, Cohen AL, Miezin FM, Dosenbach NU, Wenger KK, Fox MD, Snyder AZ, Raichle ME, Petersen SE (2007): A method for using blocked and event‐related fMRI data to study “resting state” functional connectivity. Neuroimage 35:396–405. [DOI] [PMC free article] [PubMed] [Google Scholar]
- Fischl B, van der Kouwe A, Destrieux C, Halgren E, Segonne F, Salat DH, Busa E, Seidman LJ, Goldstein J, Kennedy D, Caviness V, Makris N, Rosen B, Dale AM (2004): Automatically parcellating the human cerebral cortex. Cereb Cortex 14:11–22. [DOI] [PubMed] [Google Scholar]
- Fox MD, Raichle ME (2007): Spontaneous fluctuations in brain activity observed with functional magnetic resonance imaging. Nat Rev Neurosci 8:700–711. [DOI] [PubMed] [Google Scholar]
- Fox MD, Snyder AZ, Vincent JL, Corbetta M, Van Essen DC, Raichle ME (2005): The human brain is intrinsically organized into dynamic, anticorrelated functional networks. Proc Natl Acad Sci USA 102:9673–9678. [DOI] [PMC free article] [PubMed] [Google Scholar]
- Fox MD, Corbetta M, Snyder AZ, Vincent JL, Raichle ME (2006): Spontaneous neuronal activity distinguishes human dorsal and ventral attention systems. Proc Natl Acad Sci USA 103:10046–10051. [DOI] [PMC free article] [PubMed] [Google Scholar]
- Fox MD, Zhang D, Snyder AZ, Raichle ME (2009): The global signal and observed anticorrelated resting state brain networks. J Neurophysiol 101:3270–3283. [DOI] [PMC free article] [PubMed] [Google Scholar]
- Gotts SJ, Saad ZS, Jo HJ, Wallace GL, Cox RW, Martin A (2013): The perils of global signal regression for group comparisons: A case study of Autism Spectrum Disorders. Front Hum Neurosci 7:1–20. [DOI] [PMC free article] [PubMed] [Google Scholar]
- Greicius MD, Krasnow B, Reiss AL, Menon V (2003): Functional connectivity in the resting brain: A network analysis of the default mode hypothesis. Proc Natl Acad Sci USA 100:253–258. [DOI] [PMC free article] [PubMed] [Google Scholar]
- Hampson M, Peterson BS, Skudlarski P, Gatenby JC, Gore JC (2002): Detection of functional connectivity using temporal correlations in MR images. Hum Brain Mapp 15:247–262. [DOI] [PMC free article] [PubMed] [Google Scholar]
- Hazlett HC, Poe MD, Gerig G, Styner M, Chappell C, Smith RG, Vachet C, Piven J (2011): Early brain overgrowth in autism associated with an increase in cortical surface area before age 2 years. Arch Gen Psychiatry 68:467–476. [DOI] [PMC free article] [PubMed] [Google Scholar]
- Horwitz B (2003): The elusive concept of brain connectivity. Neuroimage 19:466–470. [DOI] [PubMed] [Google Scholar]
- Horwitz B, Rumsey JM, Grady CL, Rapoport SI (1988): The cerebral metabolic landscape in autism. Intercorrelations of regional glucose utilization. Arch Neurol 45:749–755. [DOI] [PubMed] [Google Scholar]
- Hughes JR (2007): Autism: The first firm finding = underconnectivity? Epilepsy Behav 11:20–24. [DOI] [PubMed] [Google Scholar]
- Jiang T, He Y, Zang Y, Weng X (2004): Modulation of functional connectivity during the resting state and the motor task. Hum Brain Mapp 22:63–71. [DOI] [PMC free article] [PubMed] [Google Scholar]
- Johnson MH (2011): Interactive specialization: A domain‐general framework for human functional brain development. Dev Cogn Neurosci 1:7–21. [DOI] [PMC free article] [PubMed] [Google Scholar]
- Jones TB, Bandettini PA, Kenworthy L, Case LK, Milleville SC, Martin A, Birn RM (2010): Sources of group differences in functional connectivity: An investigation applied to autism spectrum disorder. Neuroimage 49:401–414. [DOI] [PMC free article] [PubMed] [Google Scholar]
- Just MA, Cherkassky VL, Keller TA, Minshew NJ (2004): Cortical activation and synchronization during sentence comprehension in high‐functioning autism: Evidence of underconnectivity. Brain 127:1811–1821. [DOI] [PubMed] [Google Scholar]
- Just MA, Cherkassky VL, Keller TA, Kana RK, Minshew NJ (2007): Functional and anatomical cortical underconnectivity in autism: Evidence from an FMRI study of an executive function task and corpus callosum morphometry. Cereb Cortex 17:951–961. [DOI] [PMC free article] [PubMed] [Google Scholar]
- Just MA, Keller TA, Malave VL, Kana RK, Varma S (2012): Autism as a neural systems disorder: A theory of frontal‐posterior underconnectivity. Neurosci Biobehav Rev 36:1292–1313. [DOI] [PMC free article] [PubMed] [Google Scholar]
- Kana RK, Keller TA, Cherkassky VL, Minshew NJ, Just MA (2006): Sentence comprehension in autism: Thinking in pictures with decreased functional connectivity. Brain 129:2484–2493. [DOI] [PMC free article] [PubMed] [Google Scholar]
- Kana RK, Keller TA, Minshew NJ, Just MA (2007): Inhibitory control in high‐functioning autism: Decreased activation and underconnectivity in inhibition networks. Biol Psychiatry 62:198–206. [DOI] [PMC free article] [PubMed] [Google Scholar]
- Kana RK, Keller TA, Cherkassky VL, Minshew NJ, Adam Just M (2009): Atypical frontal‐posterior synchronization of Theory of Mind regions in autism during mental state attribution. Soc Neurosci 4:135–152. [DOI] [PMC free article] [PubMed] [Google Scholar]
- Keehn B, Müller R‐A, Townsend J (2013a): Atypical attentional networks and the emergence of autism. Neurosci Biobehav Rev 37:164–183. [DOI] [PMC free article] [PubMed] [Google Scholar]
- Keehn B, Shih P, Brenner L, Townsend J, Müller R‐A (2013b): Functional connectivity for an “island of sparing” in autism spectrum disorder: An fMRI study of visual search. Hum Brain Mapp 34:2524–2537. [DOI] [PMC free article] [PubMed] [Google Scholar]
- Kennedy DP, Redcay E, Courchesne E (2006): Failing to deactivate: Resting functional abnormalities in autism. Proc Natl Acad Sci USA 103:8275–8280. [DOI] [PMC free article] [PubMed] [Google Scholar]
- Khan S, Gramfort A, Shetty NR, Kitzbichler MG, Ganesan S, Moran JM, Lee SM, Gabrieli JD, Tager‐Flusberg HB, Joseph RM, Herbert MR, Hamalainen MS, Kenet T (2013): Local and long‐range functional connectivity is reduced in concert in autism spectrum disorders. Proc Natl Acad Sci USA 110:3107–3112. [DOI] [PMC free article] [PubMed] [Google Scholar]
- Kleinhans NM, Richards T, Sterling L, Stegbauer KC, Mahurin R, Johnson LC, Greenson J, Dawson G, Aylward E (2008): Abnormal functional connectivity in autism spectrum disorders during face processing. Brain 131:1000–1012. [DOI] [PubMed] [Google Scholar]
- Koshino H, Carpenter PA, Minshew NJ, Cherkassky VL, Keller TA, Just MA (2005): Functional connectivity in an fMRI working memory task in high‐functioning autism. Neuroimage 24:810–821. [DOI] [PubMed] [Google Scholar]
- Koyama MS, Di Martino A, Zuo XN, Kelly C, Mennes M, Jutagir DR, Castellanos FX, Milham MP (2011): Resting‐state functional connectivity indexes reading competence in children and adults. J Neurosci 31:8617–8624. [DOI] [PMC free article] [PubMed] [Google Scholar]
- Kuhn T (1962): The Structure of Scientific Revolutions. Chicago, IL: University of Chicago Press. [Google Scholar]
- Lee PS, Yerys BE, Della Rosa A, Foss‐Feig J, Barnes KA, James JD, VanMeter J, Vaidya CJ, Gaillard WD, Kenworthy LE (2009): Functional connectivity of the inferior frontal cortex changes with age in children with autism spectrum disorders: A fcMRI study of response inhibition. Cereb Cortex 19:1787–1794. [DOI] [PMC free article] [PubMed] [Google Scholar]
- Leopold DA, Murayama Y, Logothetis NK (2003): Very slow activity fluctuations in monkey visual cortex: Implications for functional brain imaging. Cereb Cortex 13:422–433. [DOI] [PubMed] [Google Scholar]
- Lewis CM, Baldassarre A, Committeri G, Romani GL, Corbetta M (2009): Learning sculpts the spontaneous activity of the resting human brain. Proc Natl Acad Sci USA 106:17558–17563. [DOI] [PMC free article] [PubMed] [Google Scholar]
- Logothetis NK, Pfeuffer J (2004): On the nature of the BOLD fMRI contrast mechanism. Magn Reson Imaging 22:1517–1531. [DOI] [PubMed] [Google Scholar]
- Lombardo MV, Chakrabarti B, Bullmore ET, Sadek SA, Pasco G, Wheelwright SJ, Suckling J, Baron‐Cohen S (2010): Atypical neural self‐representation in autism. Brain 133:611–624. [DOI] [PubMed] [Google Scholar]
- Lord C, Rutter M, Le Couteur A (1994): Autism diagnostic interview‐revised: A revised version of a diagnostic interview for caregivers of individuals with possible pervasive developmental disorders. J Autism Dev Disord 24:659–685. [DOI] [PubMed] [Google Scholar]
- Lord C, Rutter M, DiLavore P, Risi S (2001): Autism Diagnostic Observation Schedule. Los Angeles, CA: Western Psychological Services. [Google Scholar]
- Lowe MJ, Mock BJ, Sorenson JA (1998): Functional connectivity in single and multislice echoplanar imaging using resting‐state fluctuations. Neuroimage 7:119–132. [DOI] [PubMed] [Google Scholar]
- Lowe MJ, Dzemidzic M, Lurito JT, Mathews VP, Phillips MD (2000): Correlations in low‐frequency BOLD fluctuations reflect cortico‐cortical connections. Neuroimage 12:582–587. [DOI] [PubMed] [Google Scholar]
- Lynch CJ, Uddin LQ, Supekar K, Khouzam A, Phillips J, Menon V (2013): Default mode network in childhood autism: Posteromedial cortex heterogeneity and relationship with social deficits. Biol Psychiatry 74:212–219. [DOI] [PMC free article] [PubMed] [Google Scholar]
- Mason MF, Norton MI, Van Horn JD, Wegner DM, Grafton ST, Macrae CN (2007): Wandering minds: The default network and stimulus‐independent thought. Science 315:393–395. [DOI] [PMC free article] [PubMed] [Google Scholar]
- Mason RA, Williams DL, Kana RK, Minshew N, Just MA (2008): Theory of Mind disruption and recruitment of the right hemisphere during narrative comprehension in autism. Neuropsychologia 46:269–280. [DOI] [PMC free article] [PubMed] [Google Scholar]
- Minshew NJ, Williams DL (2007): The new neurobiology of autism: Cortex, connectivity, and neuronal organization. Arch Neurol 64:945–950. [DOI] [PMC free article] [PubMed] [Google Scholar]
- Mizuno A, Villalobos ME, Davies MM, Dahl BC, Müller R‐A (2006): Partially enhanced thalamo‐cortical functional connectivity in autism. Brain Res 1104:160–174. [DOI] [PubMed] [Google Scholar]
- Monk CS, Peltier SJ, Wiggins JL, Weng SJ, Carrasco M, Risi S, Lord C (2009): Abnormalities of intrinsic functional connectivity in autism spectrum disorders. Neuroimage 47:764–772. [DOI] [PMC free article] [PubMed] [Google Scholar]
- Mostofsky SH, Powell SK, Simmonds DJ, Goldberg MC, Caffo B, Pekar JJ (2009): Decreased connectivity and cerebellar activity in autism during motor task performance. Brain 132:2413–2425. [DOI] [PMC free article] [PubMed] [Google Scholar]
- Müller R‐A (2007): The study of autism as a distributed disorder. Ment Retard Dev Disabil Res Rev 13:85–95. [DOI] [PMC free article] [PubMed] [Google Scholar]
- Müller R‐A, Shih P, Keehn B, Deyoe JR, Leyden KM, Shukla DK (2011): Underconnected, but how? A survey of functional connectivity MRI studies in autism spectrum disorders. Cereb Cortex 21:2233–2243. [DOI] [PMC free article] [PubMed] [Google Scholar]
- Murphy K, Birn RM, Handwerker DA, Jones TB, Bandettini PA (2009): The impact of global signal regression on resting state correlations: Are anti‐correlated networks introduced? Neuroimage 44:893–905. [DOI] [PMC free article] [PubMed] [Google Scholar]
- Nir Y, Hasson U, Levy I, Yeshurun Y, Malach R (2006): Widespread functional connectivity and fMRI fluctuations in human visual cortex in the absence of visual stimulation. Neuroimage 30:1313–1324. [DOI] [PubMed] [Google Scholar]
- Noonan SK, Haist F, Müller R‐A (2009): Aberrant functional connectivity in autism: Evidence from low‐frequency BOLD signal fluctuations. Brain Res 1262:48–63. [DOI] [PMC free article] [PubMed] [Google Scholar]
- O'Riordan MA, Plaisted KC, Driver J, Baron‐Cohen S (2001): Superior visual search in autism. J Exp Psychol Hum Percept Perform 27:719–730. [DOI] [PubMed] [Google Scholar]
- Power JD, Barnes KA, Snyder AZ, Schlaggar BL, Petersen SE (2012): Spurious but systematic correlations in functional connectivity MRI networks arise from subject motion. Neuroimage 59:2142–2154. [DOI] [PMC free article] [PubMed] [Google Scholar]
- Rippon G, Brock J, Brown C, Boucher J (2007): Disordered connectivity in the autistic brain: Challenges for the “new psychophysiology.” Int J Psychophysiol 63:164–172. [DOI] [PubMed] [Google Scholar]
- Rudie JD, Shehzad Z, Hernandez LM, Colich NL, Bookheimer SY, Iacoboni M, Dapretto M (2012): Reduced functional integration and segregation of distributed neural systems underlying social and emotional information processing in autism spectrum disorders. Cereb Cortex 22:1025–1037. [DOI] [PMC free article] [PubMed] [Google Scholar]
- Rudie JD, Brown JA, Beck‐Pancer D, Hernandez LM, Dennis EL, Thompson PM, Bookheimer SY, Dapretto M (2013): Altered functional and structural brain network organization in autism. Neuroimage: Clinical 2:79–94. [DOI] [PMC free article] [PubMed] [Google Scholar]
- Rutter M, LeCouteur A, Lord C (2003): Autism Diagnostic Interview—R. Los Angeles, CA: Wester Psychological Services. [Google Scholar]
- Saad ZS, Gotts SJ, Murphy K, Chen G, Jo HJ, Martin A, Cox RW (2012): Trouble at rest: How correlation patterns and group differences become distorted after global signal regression. Brain Connect 2:25–32. [DOI] [PMC free article] [PubMed] [Google Scholar]
- Schipul SE, Keller TA, Just MA (2011): Inter‐regional brain communication and its disturbance in autism. Front Syst Neurosci 5:1–11. [DOI] [PMC free article] [PubMed] [Google Scholar]
- Schölvinck ML, Maier A, Ye FQ, Duyn JH, Leopold DA (2010): Neural basis of global resting‐state fMRI activity. Proc Natl Acad Sci USA 107:10238–10243. [DOI] [PMC free article] [PubMed] [Google Scholar]
- Schultz DH, Balderston NL, Helmstetter FJ (2012): Resting‐state connectivity of the amygdala is altered following Pavlovian fear conditioning. Front Hum Neurosci 6:1–10. [DOI] [PMC free article] [PubMed] [Google Scholar]
- Seeley WW, Menon V, Schatzberg AF, Keller J, Glover GH, Kenna H, Reiss AL, Greicius MD (2007): Dissociable intrinsic connectivity networks for salience processing and executive control. J Neurosci 27:2349–2356. [DOI] [PMC free article] [PubMed] [Google Scholar]
- Serences JT, Shomstein S, Leber AB, Golay X, Egeth HE, Yantis S (2005): Coordination of voluntary and stimulus‐driven attentional control in human cortex. Psychol Sci 16:114–122. [DOI] [PubMed] [Google Scholar]
- Shen MD, Shih P, Ottl B, Keehn B, Leyden KM, Gaffrey MS, Muller RA (2012): Atypical lexicosemantic function of extrastriate cortex in autism spectrum disorder: Evidence from functional and effective connectivity. Neuroimage 62:1780–1791. [DOI] [PMC free article] [PubMed] [Google Scholar]
- Shih P, Shen M, Öttl B, Keehn B, Gaffrey MS, Müller R‐A (2010): Atypical network connectivity for imitation in autism spectrum disorder. Neuropsychologia 48:2931–2939. [DOI] [PMC free article] [PubMed] [Google Scholar]
- Shih P, Keehn B, Oram JK, Leyden KM, Keown CL, Müller R‐A (2011): Functional differentiation of posterior superior temporal sulcus in autism: A functional connectivity magnetic resonance imaging study. Biol Psychiatry 70:270–277. [DOI] [PMC free article] [PubMed] [Google Scholar]
- Solomon M, Ozonoff SJ, Ursu S, Ravizza S, Cummings N, Ly S, Carter CS (2009): The neural substrates of cognitive control deficits in autism spectrum disorders. Neuropsychologia 47:2515–2526. [DOI] [PMC free article] [PubMed] [Google Scholar]
- Toro R, Konyukh M, Delorme R, Leblond C, Chaste P, Fauchereau F, Coleman M, Leboyer M, Gillberg C, Bourgeron T (2010): Key role for gene dosage and synaptic homeostasis in autism spectrum disorders. Trends Genet 26:363–372. [DOI] [PubMed] [Google Scholar]
- Turner KC, Frost L, Linsenbardt D, McIlroy JR, Müller R‐A (2006): Atypically diffuse functional connectivity between caudate nuclei and cerebral cortex in autism. Behav Brain Funct 2:34–45. [DOI] [PMC free article] [PubMed] [Google Scholar]
- Van Dijk KR, Hedden T, Venkataraman A, Evans KC, Lazar SW, Buckner RL (2010): Intrinsic functional connectivity as a tool for human connectomics: Theory, properties, and optimization. J Neurophysiol 103:297–321. [DOI] [PMC free article] [PubMed] [Google Scholar]
- Van Dijk KR, Sabuncu MR, Buckner RL (2012): The influence of head motion on intrinsic functional connectivity MRI. Neuroimage 59:431–438. [DOI] [PMC free article] [PubMed] [Google Scholar]
- Villalobos ME, Mizuno A, Dahl BC, Kemmotsu N, Müller R‐A (2005): Reduced functional connectivity between V1 and inferior frontal cortex associated with visuomotor performance in autism. Neuroimage 25:916–925. [DOI] [PMC free article] [PubMed] [Google Scholar]
- Vissers ME, Cohen MX, Geurts HM (2012): Brain connectivity and high functioning autism: A promising path of research that needs refined models, methodological convergence, and stronger behavioral links. Neurosci Biobehav Rev 36:604–625. [DOI] [PubMed] [Google Scholar]
- Wang Z, Liu J, Zhong N, Qin Y, Zhou H, Li K (2012): Changes in the brain intrinsic organization in both on‐task state and post‐task resting state. Neuroimage 62:394–407. [DOI] [PubMed] [Google Scholar]
- Wass S (2011): Distortions and disconnections: Disrupted brain connectivity in autism. Brain Cogn 75:18–28. [DOI] [PubMed] [Google Scholar]
- Weinstein M, Ben‐Sira L, Levy Y, Zachor DA, Ben Itzhak E, Artzi M, Tarrasch R, Eksteine PM, Hendler T, Ben Bashat D (2011): Abnormal white matter integrity in young children with autism. Hum Brain Mapp 32:534–543. [DOI] [PMC free article] [PubMed] [Google Scholar]
- Welchew DE, Ashwin C, Berkouk K, Salvador R, Suckling J, Baron‐Cohen S, Bullmore E (2005): Functional disconnectivity of the medial temporal lobe in Asperger's syndrome. Biol Psychiatry 57:991–998. [DOI] [PubMed] [Google Scholar]
- Wolff JJ, Gu H, Gerig G, Elison JT, Styner M, Gouttard S, Botteron KN, Dager SR, Dawson G, Estes AM, Evans AC, Hazlett HC, Kostopoulos P, McKinstry RC, Paterson SJ, Schultz RT, Zwaigenbaum L, Piven J (2012): Differences in white matter fiber tract development present from 6 to 24 months in infants with autism. Am J Psychiatry 169:589–600. [DOI] [PMC free article] [PubMed] [Google Scholar]
Associated Data
This section collects any data citations, data availability statements, or supplementary materials included in this article.
Supplementary Materials
Supporting Information