

Summary
Background
Cognitive decline is a debilitating manifestation of disease progression in Parkinson’s disease. We aimed to develop a clinical-genetic score to predict global cognitive impairment in patients with the disease.
Methods
A prediction algorithm for global cognitive impairment (defined as Mini Mental State Exam (MMSE) ≤25) was built using data from 1,350 patients with 5,165 longitudinal visits over 12.8 (median, 2.8) years. Age at onset, MMSE, education, motor exam score, gender, depression and GBA mutations, machine selected through stepwise Cox’ hazards analysis and Akaike’s information criterion, were used to compute the multivariable predictor. Independent validation was achieved in another 1,132 patients with 19,127 visits over 8.6 (median, 6.5) years.
Findings
The cognitive risk score accurately predicted cognitive impairment within ten years of disease onset with an area under the curve (AUC) of >0.85 in both the discovery (95% CI, 0.821–0.902) and validation populations (95% CI, 0.779 – 0.913). 72.6% of patients scoring in the highest quartile were cognitively impaired by ten years vs. 3.7% in the lowest quartile (hazard ratio, 18.4, 95% CI, 9.4 – 36.1). Dementia or disabling cognitive impairment was predicted with an AUC of 0.877 (95% CI 0.788–0.943) and high negative predictive value (0.920, 95% 0.877–0.954) at the predefined cutoff (0.196). Performance was stable in 10,000 randomly resampled subsets.
Interpretation
Our predictive algorithm provides a potential test for future cognitive health or impairment in patients with Parkinson’s. It could improve trials of cognitive interventions and inform on prognosis.
Introduction
Cognitive decline is one of the most debilitating manifestations of disease progression in Parkinson’s and a key determinant of a patient’s quality of life and independence1. The ability to predict and manage this complication is highly relevant for recruitment and stratification of clinical trials, particularly those designed to slow disease progression and to prevent dementia. While a multitude of Parkinson’s medications is available to improve motor aspects of the disease, these do not have a major effect on cognitive decline.
Demographic and clinical risk factors for cognitive decline in PD are emerging. Age-at-onset2,3, depression2, and education2 have been nominated as predictors of dementia in multiple small or medium-sized cohorts (e.g. the largest published study examined 400 subjects for several years)2,3. Measures of baseline disease severity using motor and cognitive scores are linked to an increased risk of developing future dementia2,3. Complementing these clinical clues, mutations in the β-glucocerebrosidase gene (GBA; found in about 10% of patients with gene sequencing) are linked to accelerated cognitive decline in PD4,5. Other progression loci have been nominated, but remain controversial or await further replication in large, longitudinal studies (e.g. APOE, SNCA, MAPT; reviewed in Ref.6).
Here we develop a clinical-genetic score predictive of global cognitive impairment in a discovery set of 1,350 participants with PD followed in six longitudinal cohorts and validated in 1,132 participants from three independent longitudinal cohorts. The versatile cognitive risk calculator for PD (http://scherzerlaboratory.org/tools/login.php) can be used to calculate a patient’s risk estimate.
Methods
Study Design and Participants
Figure 1 shows a summary of our workflow. Table 1 describes the cohorts. Details are available in the appendix. 3,200 patients with PD were longitudinally assessed with 27,022 study visits in nine cohorts2,7–13 from North America and Europe between 1986 and 2016 (table 1 and appendix figure 1). 96.3% of study visits occurred within 12 years of follow-up with a median follow-up time of 6.4 years from disease onset (inter-quartile range, 4.6 years) (appendix figure 2). We thus focused our primary analysis on the 12-year time frame from disease onset. Serial Mini Mental State Exam (MMSE) scores14 were longitudinally collected in seven cohorts. Montreal Cognitive Assessment (MoCA)15 scores were collected in two cohorts and converted to MMSE scores according to a published formula16. To ensure consistency across studies, an MMSE score with the cutoff of ≤ 25 was defined as an indicator of significant global cognitive impairment as recommended by the International Parkinson and Movement Disorders Society (MDS) Task Force17. Cohort-specific definitions of Parkinson’s disease dementia were used (appendix table 1). The MDS-Unified PD Rating Scale (UPDRS) part II and III scores were obtained from four cohorts, and estimated for the five remaining cohorts using the UPDRS or SPES/SCOPA-motor scales18 based on published conversion formulas19,20 (table 1). Hoehn and Yahr scales (HY)14 were longitudinally collected in all cohorts. Ethnicity was self-reported. GBA mutations were retrospectively genotyped and defined as in Ref.4. For several cohorts this analysis evaluated previously collected longitudinal phenotypic data; for the active HBS, PPMI, PDBP, DIGPD cohorts both retro- and prospectively collected longitudinal data elements were included. Because stratification of patients in clinical trials is a potential application of the prognosis score, we a priori assigned the two trial cohorts, DATATOP and PreCEPT, together with PPMI to the validation population (figure 1). Written informed consent for each cohort was obtained from the participants under the supervision of each local ethics committee. The Institutional Review Board of Partners HealthCare approved the current analyses.
Figure 1. Flow chart of study design.
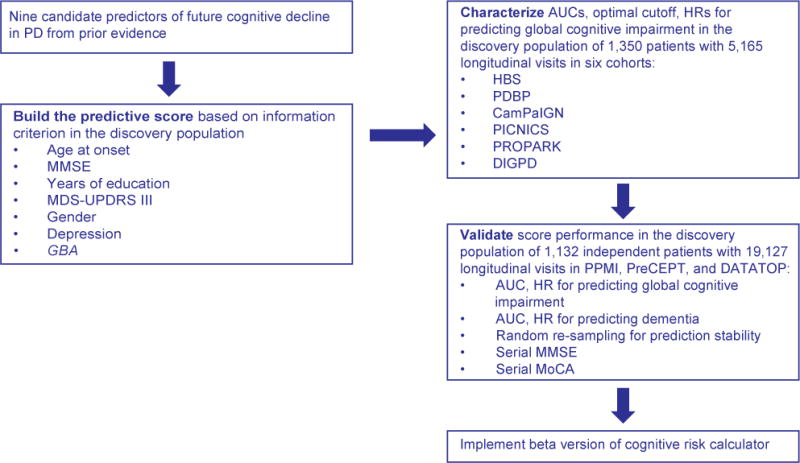
HBS=Harvard Biomarkers Study, DATATOP=Deprenyl and Tocopherol Antioxidative Therapy of Parkinsonism; PreCEPT=Parkinson Research Examination of CEP-1347 Trial/A Longitudinal Followup of the PRECEPT Study Cohort; CamPaIGN=Cambridgeshire Parkinson’s Incidence from GP to Neurologist; PICNICS=Parkinsonism Incidence, Cognition and Non-motor heterogeneity in Cambridgeshire; DIGPD=Drug Interaction with Genes in PD; PROPARK=PROfiling PARKinson’s disease study; PDBP=Parkinson’s Disease Biomarkers Program; PPMI=Parkinson’s Progression Marker Initiative (PPMI). AUC=area under the curve.
Table 1.
Overview of study cohorts.
| Study (Country) | N (% male) | Age at Enrollment (years, SD) | Years of Education (years, SD) | Study Years (years, range) | GBA Mutation no. of subjects (%) | Mutations Screened | Clinical Data |
|---|---|---|---|---|---|---|---|
| HBS (USA) | 556 (64.2%) | 66.1 (9.8) | 15.1 (1.9) | 1.8 (0–8.0) | 42 (7.6%) | Targeted Sequencing or N370S, E326K, T369M Genotyping | MMSE, H, UPDRS I–IV |
| DATATOP (USA, Canada) | 437 (66.6%) | 60.1 (9.0) | 14.3 (3.4) | 6.3 (0–7.8) | 39 (8.9%) | Targeted Sequencing | MMSE, HY, UPDRS I–III |
| DIGPD (France) | 409 (58.7%) | 62.3 (9.7) | 12.1 (3.3) | 2.3 (0–5.0) | 32 (7.8%) | Sanger Sequencing | MMSE, HY, MDS-UPDRS I–IV |
| CamPaIGN (UK) | 114 (57.0%) | 69.4 (9.9) | 11.5 (3.3) | 6.9 (0–12.8) | 15 (13.2%) | Sanger Sequencing | MMSE, HY, UPDRS I–III |
| PICNICS (UK) | 129 (65.9%) | 68.8 (9.2) | 12.1 (2.9) | 3.1 (0–6.7) | 8 (6.2%) | Sanger Sequencing | MMSE, HY, MDS-UPDRS I–IV |
| PROPARK (Netherlands) | 327 (66.1%) | 59.6 (10.7) | 12.0 (4.2) | 4.6 (0–6.3) | 53 (16.2%) | Targeted Sequencing or Whole Exome Sequencing | MMSE, HY, SPES/SCOPA-motor scale |
| PreCEPT (USA, Canada) | 332 (66.6%) | 60.5 (9.4) | 16.1 (3.2) | 6.7 (0–8.6) | 32 (9.6%) | Targeted Sequencing | MMSE, HY, UPDRS I–III |
| PDBP (USA) | 499 (61.9%) | 64.9 (9.2) | 15.6 (2.7) | 0.7 (0–3.1) | 46 (9.2%) | NeuroX Genotyping | MoCA, HY, MDS-UPDRS I–IV |
| PPMI (USA, Europe) | 396 (64.9%) | 61.6 (9.7) | 15.5 (3.0) | 3.2 (0–5.1) | 41 (10.4%) | Whole Exome Sequencing | MoCA, HY, MDS-UPDRS I–IV |
The studies included are the Harvard Biomarkers Study (HBS)7; Deprenyl and Tocopherol Antioxidative Therapy of Parkinsonism (DATATOP)8; Parkinson Research Examination of CEP-1347 Trial/A Longitudinal Follow-up of the PRECEPT Study Cohort (PreCEPT/PostCEPT)9; Cambridgeshire Parkinson’s Incidence from GP to Neurologist (CamPaIGN)10, Parkinsonism: Incidence, Cognition and Non-motor heterogeneity in Cambridgeshire (PICNICS)11, Drug Interaction with Genes in PD (DIGPD), PROfiling PARKinson’s disease (PROPARK) study 2, Parkinson’s Disease Biomarkers Program (PDBP)13 and Parkinson’s Progression Markers Initiative (PPMI)12. HBS was examined in two parts: for 173 individuals targeted sequencing of the entire GBA locus was performed; for 383 participants three GBA mutations were genotyped. UPDRS subscale II, III scores were converted into MDS-UPDRS II, III scores according to the conversion formula developed by Goetz et al.19. The SPES/SCOPA-motor scale was converted into MDS-UPDRS III score according to Ref.20. The MoCA from PDBP and PPMI was converted into MMSE score according to Ref.16.
Statistical Analysis
Building the Cognitive Risk Score
The discovery population was used to evaluate candidate clinical and GBA risk factors and to build the predictive score using a statistic similar to the Framingham Cardiovascular Risk score21. A step by step calculation of the score is included in the appendix table 4, figure 6. Nine clinical and genetic risk factors previously associated with dementia in PD were considered for evaluation based on prior evidence2,3 and applicability to our datasets: GBA mutation status, age at onset of PD, gender, years of education at baseline, baseline MMSE, MDS-UPDRS II, MDS-UPDRS III scores, Hoehn & Yahr stage, and baseline depression status. GBA was included because of unequivocal evidence from multiple, large longitudinal studies (e.g.4,5). Other candidate progression loci are controversial and need further longitudinal replication6. The Cox proportional hazards statistic was used to estimate the influence of these risk factors on time (years from PD onset) to reaching the endpoint of global cognitive impairment (i.e., duration of diagnosed PD illness at point of cognitive impairment) during longitudinal follow-up in the discovery population. The Cox regression coefficients, which were incorporated into the cognitive predictive score, each index the hazard rate throughout the time period analyzed, which is assumed to be constant throughout that period. This “proportional hazard assumption” was valid for all predictors except the MDS-UPDRS II, which was discarded for this reason. The eight remaining risk factors were entered into a multivariable Cox model. Backward elimination was performed to remove uninformative variables from the model based on the lowest Akaike’s information criterion (AIC). Hoehn & Yahr stage was eliminated from the model during this process (AIC of 2,088.2 without HY vs. 2,089.5 with HY). The final multivariable Cox regression model then included the remaining seven risk factors (figure 1). To adjust for differences among the seven cohorts, a “cohort” term was included as a random effect (using a “frailty” Cox model). The score was then validated in 1,132 patients with 19,127 follow-up visits over 8.6 (median, 6.5; IQR 3.1) years. Cochran’s Q-test and the I2 index were used to test for heterogeneity across studies (appendix table 2). In all analyses, p values less than or equal to 0.05 were considered statistically significant.
Application to Dementia
Dementia is characterized as a loss of cognitive ability severe enough to interfere with normal activities of daily living17. We conservatively tested dementia prediction in individuals with PD (without cognitive impairment at enrollment) in the validation population that was not used to build the predictive score. 1,132 patients with 19,127 longitudinal study visits were available for this analysis.
Stability
To test the stability of the predictive score we rebuilt and retested the score in 10,000 training and test sets randomly generated from the entire study population.
Generalized Mixed Random and Fixed Effects Longitudinal Meta-analysis (LMM)
To evaluate longitudinal trajectories of serial MMSE and MoCA scores in patients with high (> 0.196) vs. low cognitive predictive scores (≤ 0.196) at enrollment, we performed LMM adjusting for disease duration at enrollment using appropriate cohorts from the validation population.
Detailed methods, statistical analyses, supplemental results, and illustrative case studies are shown in the appendix.
The Online Calculator can be found at http://scherzerlaboratory.org/tools/login.php
Role of the funding source
The study funders had no role in the study design, data collection, data analysis, data interpretation, or writing of the report. The corresponding author and all coauthors had full access to all the data in the study and had final responsibility for the decision to submit for publication.
Results
Clinical-genetic score and prediction of cognitive decline in the discovery population
3,200 patients with PD from nine cohorts were screened for eligibility. 235 patients were excluded because of a MMSE ≤ 25 at baseline; 135 were excluded because their first study visit occurred more than 12 years from disease onset. Six cohorts representing 1,350 patients (after exclusion of an additional 334 patients with missing covariates) with 5,165 longitudinal visits over 12.8 (median, 2.8; interquartile range (IQR) 3.1) years) were assigned to the discovery population (figure 1): HBS, CamPaIGN, PICNICS, PROPARK, DIGPD and PDBP. The proportional variance in the cognitive predictive scores accounted for by the model as a whole was 97.4%. Each of the seven predictors included into the model significantly contributed to the information content of the score. Age at PD onset was responsible for 56.5% of the variance, followed by MMSE at enrollment (7.7%), years of education (5.4%), MDS-UPDRS part III score at enrollment (4.7%), gender (2.6%), depression at enrollment (1.9%), and GBA carrier status (1.5%).
Our cognitive risk score showed high accuracy (quantified by AUC estimates) for predicting, whether a patient will develop global cognitive impairment within ten years from disease onset. In the discovery population, the AUC was 0.863 (95% CI 0.821–0.901; figure 2A); with a specificity of 0.717 (95%CI 0.652–0.775) and a sensitivity of 0.865 (95%CI 0.802–0.918) at the optimal cutoff (0.196). Patients with cognitive predictive scores in the highest (fourth) quartile had a dramatically increased hazard ratio (HR) for global cognitive impairment of 21.6 (95% CI, 10.9 – 42.9) compared to those in the lowest risk quartile (the reference quartile; p < 0.0001, table 2). Kaplan-Meier survival curves of subjects in the highest and lowest risk quartiles, respectively (figure 2C), revealed that 95.8% (95% CI 92.7%–99.1%) of patients in the lowest quartile of predictive scores survived for ten years without global cognitive impairment in contrast to only 34.9% (95% CI 26.5%–46.2%) in the highest quartile (a 60.9% difference; p < 0.0001 log-rank test; figure 2C).
Figure 2. Prediction of global cognitive impairment.
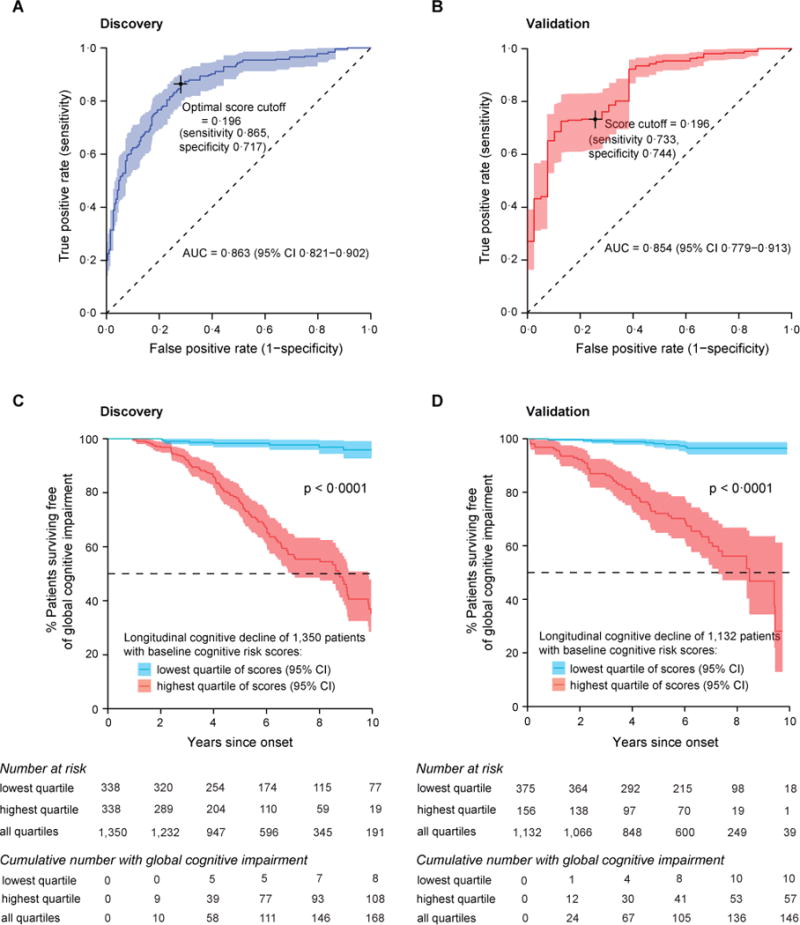
(A,B) The cognitive risk score showed high accuracy (quantified by AUC estimates) for predicting, whether a patient will develop global cognitive impairment within ten years from disease onset in the discovery and the validation populations. (A) In the discovery population, 1,350 patients with PD and MMSE > 25 at baseline were followed with 5,165 visits for up to 12.8 (median, 2.8) years. (B) In the independent validation population, 1,132 patients with PD and MMSE > 25 at baseline were followed with 19,127 visits for up to 8.6 (median, 6.5) years. Sensitivity and specificity at the cutoff score of 0.196 (the optimal cutoff identified in the discovery population) are shown for both populations. (C,D) Covariate-adjusted Kaplan-Meier curves for survival free of global cognitive impairment. (C) In the discovery population, 95.8% (95% CI 92.7%–99.1%) of patients with PD in the lowest (first) quartile of scores survived for ten years without global cognitive impairment compared to 34.9% (95% CI 26.5%–46.2%) of those scoring in the highest (fourth) quartile. (D) In the validation population, 96.3% (95% CI 94.1% – 98.6%) of patients in the lowest quartile of scores survived for ten years without global cognitive impairment compared to 27.4% (95% CI 12.6%–59.8%) of patients scoring in the highest quartile scores. To ensure consistency across studies, an MMSE score with the cutoff of ≤ 25 was taken as an indicator of significant global cognitive impairment as recommended by the International Parkinson and Movement Disorders Society (MDS) Task Force17.
Table 2.
Patients with high cognitive predictive scores have a substantially increased hazard ratio for global cognitive impairment compared to those with scores in the lowest quartile.
| Quartile
|
||||
|---|---|---|---|---|
| 1 | 2 | 3 | 4 | |
|
| ||||
| 0 to <0.0954 | 0.0954 to <0.1958 | 0.1958 to <0.3789 | 0.3789 to ≤1 | |
| Discovery population | ||||
| Parkinson’s disease (N) | 338 | 337 | 337 | 338 |
| Cognitive predictive scores (range) | 0.0076–0.0954 | 0.0954–0.1955 | 0.1961–0.3788 | 0.3789–1.0000 |
| HR (95% CI)# | 1 | 2.7 (1.2–5.9) | 6.0 (2.9–12.5) | 21.6 (10.9–42.9) |
| p value | 0.013 | <0.0001 | <0.0001 | |
| Validation population | ||||
| Parkinson’s disease (N) | 375 | 320 | 281 | 156 |
| Cognitive predictive scores (range) | 0.0089–0.0951 | 0.0955–0.1951 | 0.1959–0.3776 | 0.3809–0.9729 |
| HR (95% CI)# | 1 | 3.2 (1.6–6.7) | 8.3 (4.2–16.2) | 18.4 (9.4–36.1) |
| p value | 0.0015 | <0.0001 | <0.0001 | |
Hazard ratio (HR) and confidence intervals (CI) were calculated using Cox regression models.
Prediction of cognitive decline in the validation population
The score built in the discovery study (consisting of the seven predictors and β coefficients from the discovery study) was locked-in and applied “as is” to the new patients. Similarly, the quartile ranges and the optimal cutoff identified in the discovery study were rigorously applied to the validation population. The predictive score was accurate in the validation population with an AUC of 0.854 (95% CI 0.779–0.913) (figure 2B). Specificity was 0.744 (95% CI 0.604–0.868) and sensitivity was 0.733 (95% CI 0.617–0.831) at the pre-set cutoff of a score of 0.196. Adjusting for a 26.7% prevalence of Mild Cognitive Impairment in non-demented patients with PD patients22 yielded a negative predictive value of 0.884 (95% CI 0.818–0.923) with a positive predictive value of 0.510 (95% CI 0.400–0.639). Patients with predictive scores in the highest (fourth) quartile had a substantially increased HR for global cognitive impairment of 18.4 (95% CI, 9.4 – 36.1) compared to those in the lowest risk quartile (table 2). Kaplan-Meier survival curves of subjects in the highest and lowest quartile of predictive scores, respectively, in the validation population are shown in figure 2D. 96.3% (95% CI 94.1% – 98.6%) of patients in the lowest quartile of predictive scores survived for ten years without global cognitive impairment while only 27.4% (95% CI 12.6%–59.8%) of patients in the highest quartile of predictive scores survived for ten years without global cognitive impairment in the validation population (a 68.9% difference; p < 0.0001 log-rank test; figure 2D).
Prediction of dementia
Cohort-specific definitions of a clinical diagnosis of PD dementia (PDD) were employed as described in the Methods. The AUC for predicting dementia within ten years from onset was 0.877 (95% CI 0.788–0.943) — even higher than for global cognitive decline (figure 3). At the cutoff of 0.196, dementia was predicted with a sensitivity of 0.861 (95% CI 0.716–0.944) and specificity of 0.721 (95% CI 0.594–0.841). The negative predictive values for dementia ranged from 0.920 (95% 0.877–0.954) to 0.941 (95% CI 0.919 – 0.961) based on systematic estimates of prevalence of dementia amongst patients with PD ranging from 31.1% (high quality studies)23 to 24.5% (all studies)23. Patients with predictive scores in the highest (fourth) quartile had a substantially increased HR for dementia of 21.9 (95% CI, 6.5 – 73.1) compared to those scoring in the lowest quartile (table 3). 98.9 (95% CI 97.6% – 99.9%) of patients in the lowest quartile of predictive scores survived for ten years without dementia while only 48.3% (95% CI 21.3%–62.8%) of patients in the highest quartile of predictive scores survived for ten years without dementia (a 50.6% difference; p < 0.0001 log-rank test).
Figure 3. Prediction of dementia.

Beyond cognitive decline, the clinical-genetic score predicts risk of dementia in individuals with PD in validation population. 1,132 patients (without global cognitive impairment at baseline) with 19,127 longitudinal study visits were available for this analysis. The accuracy of the clinical-genetic score for predicting dementia was high with an AUC of 0.877 (95% CI 0.788–0.943). Sensitivity and specificity for predicting dementia at the cutoff (0.196; as predefined in the discovery population).
Table 3.
Patients with high cognitive predictive scores have an increased hazard ratio for dementia compared to those with scores in the lowest quartile.
| Quartile
|
||||
|---|---|---|---|---|
| 1 | 2 | 3 | 4 | |
|
| ||||
| 0 to <0.0954 | 0.0954 to <0.1958 | 0.1958 to <0.3789 | 0.3789 to ≤1 | |
| Validation population | ||||
| Parkinson’s disease (N) | 372 | 317 | 279 | 154 |
| Cognitive predictive scores (range) | 0.0089–0.0951 | 0.0955–0.1951 | 0.1959–0.3376 | 0.3809–0.9729 |
| HR (95% CI)# | 1 | 3.1 (0.8–11.9) | 8.8 (2.6–30.0) | 21.9 (6.5–73.1) |
| p value | 0.091 | 0.0005 | <0.0001 | |
Hazard ratio (HR) and confidence intervals (CI) were calculated using Cox regression models.
Stable predictive accuracy in 10,000 re-sampled training and test sets
In 10,000 iterations, age at onset, enrollment MMSE score, and years of education remained in the model after stepwise pruning in 100% of iterations, enrollment MDS-UPDRS III in 98.30%, GBA carrier status in 91.79%, depression in 90.61%, and gender in 78.52% (figure 4A). HY stage (which did not make it into our clinical-genetic score) was added to the model in 34.86% of iterations. Across 10,000 re-sampled test sets, the mean AUC was 0.833 (95% CI, 0.785–0.876) consistent with stable performance. Moreover, the score stably and accurately predicted dementia across the 10,000 re-sampled training and test sets with an average training AUC of 0.879 (95% CI 0.837–0.916) and an average testing AUC of 0.872 (95% CI 0.817–0.920) (figure 4B).
Figure 4. Stability of the score.
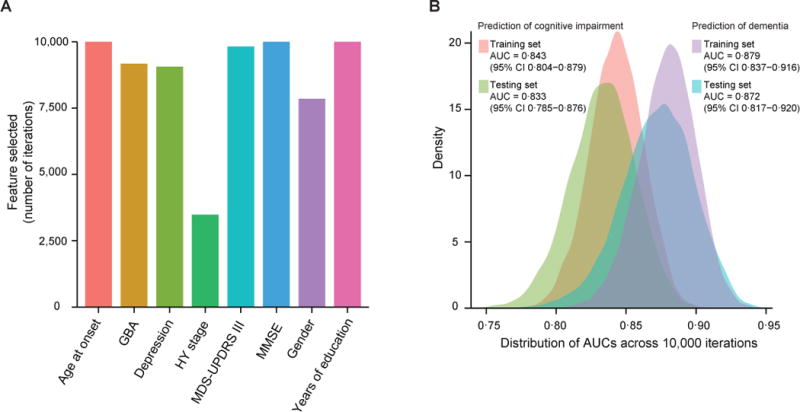
To test the stability of the predictive score, we rebuilt and retested the score model in 10,000 randomly generated training and test subsets. In each iteration the entire population of patients was randomly split into a training and a test set pair. In each iteration, we rebuilt the predictive score ab initio in the training set, eliminated predictor variables based on the Akaike information criterion, and used it to predict global cognitive decline in the corresponding test set. (A) In 10,000 iterations, age at onset, enrollment MMSE score, and years of education remained in the score model after stepwise pruning in 100% of iterations, enrollment MDS-UPDRS III in 98.30%, GBA carrier status in 91.79%, depression in 90.61%, and gender in 78.52%. HY stage (which did not make it into our clinical-genetic score) was included in 34.86% of iterations. (B) Across the 10,000 re-sampled test sets, the mean AUC was 0.833 (95% CI, 0.785–0.876) for predicting global cognitive impairment and, even higher, 0.872 (95% CI, 0.817–0.929) for dementia. These data indicate stable variable selection and score performance.
Prediction of longitudinal trajectories in MoCA scores
PD patients with high enrollment predictive scores had a significantly more rapid longitudinal decline in MMSE scores over time with p < 0.0001 compared to the patients with low enrollment predictive scores (figure 5A). The MoCA test may be more sensitive than the MMSE for detecting cognitive change in patients with PD15. We analyzed the longitudinal trajectories of MoCA scores in PPMI and PreCEPT, two of the validation cohorts, which have included this scale into their assessment battery. Patients with high predictive scores at enrollment had a much steeper decline in MoCA scores over time compared to patients with low predictive scores with p < 0.0001 (figure 5B).
Figure 5. Prediction of longitudinal trajectories of Mini Mental State Exam (MMSE) and Montreal Cognitive Assessment (MoCA) scores.
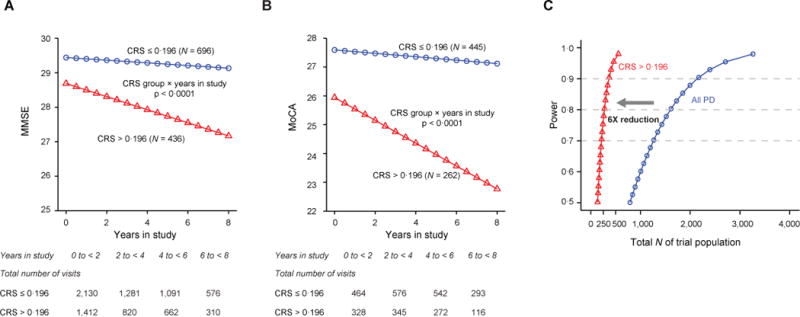
(A) To evaluate longitudinal trajectories of serial MMSE scores in the patients with high (> 0.196) vs. low enrollment cognitive predictive scores (≤ 0.196) at enrollment, we performed a generalized mixed random and fixed effects longitudinal meta-analysis adjusting for disease duration at enrollment. These analyses were conservatively restricted to the validation population. PD patients with high enrollment predictive scores had a significantly more rapid longitudinal decline in MMSE scores over time with p < 0.0001 compared to the patients with low enrollment predictive scores. Illustrative mean MMSE scores across time predicted from the estimated fixed effect parameters in the mixed random and fixed effects model analysis are shown for Parkinson’s patients with low clinical-genetic predictive scores (blue) and those with high scores at enrollment (red). Patients with high scores (measured at enrollment) had a more rapid decline in cognitive function (as measured by serial MMSE) compared to those with low scores with p < 0.0001 adjusting for duration of PD at enrollment. Illustrative MMSE values for a mean disease duration at enrollment are shown. CRS=global cognitive impairment predictive score.
(B) Illustrative mean MoCA scores across time predicted from the estimated fixed effect parameters in the mixed random and fixed effects model analysis in Parkinson’s patients with low clinical-genetic predictive scores (≤ 0.196; blue) and those with high scores at enrollment (> 0.196; red). Patients with high clinical-genetic scores at enrollment had a more rapid decline in MoCA scores compared to those with low scores with p < 0.0001 adjusting for disease duration at enrollment. The analysis of MoCA scores was restricted to PPMI and PreCEPT, the two validation cohorts, which had included this scale into their assessment battery. MoCA scores were not collected in DATATOP. Illustrative MoCA values for a mean disease duration at enrollment are shown.
(C) Improved power for clinical trials in populations with elevated clinical-genetic scores. Enriching populations based on the clinical-genetic score >0.196 for trials of therapeutics designed to address cognitive impairment in PD will reduce the required sample size by 6-fold compared to an equally powered trial without enrichment. In this hypothetical power estimate, required sample sizes were 137 for the placebo and 137 for the experimental treatment group in order to achieve 80% power. A traditional clinical trial of any PD patients (not enriched based on the clinical-genetic score) would require 801 patients per group to achieve the same power (over the same three-year time period, assuming same α, standard deviation, and test-retest correlations). α= 0.05 for detecting the difference in trajectories for MoCA across time for the placebo vs. the treatment group (group × time interaction).
Improving power in a hypothetical clinical trial
We performed a power analysis to estimate sample size requirements for a three-year clinical trial of a hypothetical drug designed to halt cognitive decline (as measured by serial MoCA or MMSE, respectively) in a trial of patients predicted to be at high risk of cognitive decline based on an enrollment cognitive risk scores at or above the cutoff of 0.196. Sample sizes of 137 (152) per placebo and 137 (152) per drug group were sufficient in order to yield 80% power for serial MoCA (or MMSE assessments). By contrast, if instead unselected patients with PD were enrolled to test the same experimental drug (over the same time period, assuming the same α, same standard deviation, and same test-retest correlations), 801 (802) patients would need be enrolled for each of the active treatment and placebo arms to achieve 80% power for serial MoCA (or MMSE assessments) (figure 5C). Detailed methods and two illustrative case studies are shown in the appendix. Medications inhibiting acetylcholine esterase activity (AChE) can be used to enhance cognitive function in patients with PD and could conceivably inflate MMSE scores. However, we found no statistically significant influence of AChE inhibitors (rivastigmine, donepezil and galantamine) on MMSE scores in the three cohorts with pertinent medication information (PPMI, PDBP, HBS), neither at enrollment nor during longitudinal follow-up.
For longitudinal analyses, examining the performance and stability of the prediction accuracy for various time frames (not just the ten-year time frame) using time-dependent ROC curves is of interest. For our score, the time-dependent prediction accuracy (as measured by the incident/dynamic average iAUC24) was stable at various time points (from 1 to 11 years from disease onset; appendix figure 4). It somewhat degraded during year 12, likely due to the relatively low number of patients who completed 12 years of follow-up.
Collectively, the clinical-genetic cognitive predictive score was robustly associated with both binary and continuous longitudinal cognitive outcomes, including global cognitive impairment, level 1 dementia, and decline in MMSE and MoCA scores over time.
A clinical variables-only version of the predictive score
In settings where GBA genotyping is not easily obtained, a version of the score comprising only the six clinical features (without GBA) could be used. This clinical score was informative and predicted global cognitive decline with high accuracy in both the discovery population with an AUC of 0.859 (95% CI, 0.816 – 0.898) and the validation population with an AUC of 0.827 (95% CI, 0.741 – 0.893) (appendix figure 5A, B). However, in a head-to-head comparison with the clinical-genetic score, the prediction accuracy of the clinical-only score significantly underperformed (p < 0.0001; appendix figure 5E).
Discussion
We have developed and replicated a cognitive risk score in 2,830 patients with PD and 25,069 longitudinal clinical assessments. The area under the curve for accurately predicting global cognitive impairment within ten years of disease onset was greater than 85% in both the discovery and validation populations (with 95% CIs of 0.821–0.902 and 0.779 – 0.913, respectively). The AUC for predicting development of dementia within ten years from disease onset was 87.7% (95% CI, 0.788 – 0.943) in the validation population. The cognitive risk score was associated with the binary outcomes of future cognitive impairment and dementia as well as continuous longitudinal measures such as a steeper decline in MMSE and MoCA scores tracked over time.
In addition to the clinical-genetic risk factors here evaluated, reduced levels of Aβ42 in cerebrospinal fluid have been linked to dementia in PD25 and this is supported by neuroimaging studies with Amyloid PET26. The predictive score is non-invasive, without the risks associated with lumbar puncture and without the restricted availability of PET imaging. The clinical-genetic version can be implemented in any setting with access to a certified gene testing lab. The clinical variables-only version can be nearly universally deployed.
The prediction algorithm developed has strengths. It was built starting from a small set of variables linked to cognitive decline or dementia in PD by prior evidence. This enhances the validity of the variables in the score. The parameters were winnowed down through machine learning. The predictor was built (as well as tested) in longitudinal cohorts, a superior study design compared to time-static, cross-sectional studies. The cohorts included vary in their design, recruitment, and assessments. PICNICS, CamPaIGN, and PROPARK are population-based cohorts designed to represent a community. HBS, PDBP, and PPMI are biomarkers cohorts. DATATOP and PreCEPT are clinical trial cohorts. These cohorts are not representative of the PD patient population as a whole, however, they are similar to “typical” clinical trial populations in the US. The fact that the score was informative across these varying cohorts is a testament to its robustness. It should be usable for other similar cohorts and most importantly, trial populations.
The score has the potential to facilitate clinical trials of experimental treatments designed to ameliorate or slow cognitive decline. Therapeutic trials in PD are hampered by the highly varied rate of progression to clinical endpoints. Because some participants with PD on placebo will experience minimal decline in cognition, it is difficult to demonstrate a therapeutic effect of the experimental therapeutic over a reasonable sample size and time course. The prognostic score represents a simple tool for stratifying and enriching the trial with patients most prone to rapid cognitive decline. Therapeutics that arrest or slow down the cognitive decline leading to dementia (which can be taken as a surrogate marker of advancing pathology) are likely to be disease modifying. Our power analysis estimated that recruiting patients with high cognitive risk scores >0.196 into such a trial will reduce the required samples size by as much as 6-fold (figure 5C). Our model should translate into more cost-effective trials, allow for “more shots on target”, and increase chances of success.
Our cognitive predictive score yields substantial negative predictive values of 88.4% for cognitive impairment and 92.0% for dementia within ten years from disease onset, but it is not yet ready for use in routine clinical care. A necessary next step towards use in clinical care will be a large prospective study using a neuropsychological test battery. If further confirmed, a low score could be reassuring for some patients and their families and inform planning decisions. On the other hand, a high score, while beneficial for enriching a research trial population, has a limited positive predictive value for a specific patient (in part due to the modest prevalence of cognitive impairment in the general PD population). It is as yet unknown, whether modification of any of the risk factors comprising the score will impact on cognitive outcome. This raises difficult ethical questions similar to issues surrounding ApoE4 testing in mild cognitive impairment27. Education is per definition modifiable, but no ready made interventions have been delineated for PD. Trials of GBA-directed therapeutics are just beginning. As with any medical advance pushing beyond current practice paradigms, the appropriate medical and ethical framework for considering the cognitive predictive score in practice settings will have to be carefully outlined.
In the DATATOP and PreCEPT cohorts, DNA was collected several years after enrollment for a subset of participants9. They may underrepresent patients with more rapidly progressive disease, but it is unlikely that this would yield a spurious association between the cognitive predictive score and cognitive decline. The Cochran’s Q-test for heterogeneity of effects across cohorts indicated that any differences in disease progression between studies (due to sampling or selection effects) should not bias the test. We found no evidence that memory enhancing medications or drop outs materially influenced the results of this study.
The frequency of global cognitive impairment (within ten years from disease onset) among patients with PD in the discovery and validation populations was consistent, 24.7% and 26.0%, respectively, based on Kaplan-Meier estimates. These estimates are in keeping with reported prevalence estimates, ranging from 18.9%28 to 57.1% for mild cognitive impairment29 and from 8.3% to 41% for dementia among patients with PD (reviewed in23). Furthermore, natural history studies have attempted to capture the frequency of cognitive impairment in PD, but due to major design differences, the range of estimates is wide, from 26%2 to as high as 83% among twenty-year survivors30. A definite view has not crystallized due to small sample sizes, variable follow-up lengths, and fundamental differences in the analytical methods.
Going forward, we plan to refine the score and extend its applications. Ongoing efforts to map the genomes and epigenomes of Parkinson’s patients should discover new predictors. Such data can, in theory, be seamlessly integrated into the versatile prediction tool we have here developed. We believe that in the near future, data-driven prediction will inspire a new proactive and preventive approach to PD.
Supplementary Material
Research in context.
Evidence before this study
We searched PubMed with the terms “Parkinson’s disease”, “dementia”, “cognitive impairment” for reports published before October, 2015. Previous studies identified individual clinical risk factors associated with cognitive deficits in PD. Recently, mutations in the Gaucher’s disease-associated gene β-glucocerebrosidase (GBA) were associated with cognitive impairment in PD. The user-friendly Framingham Cardiovascular Risk score estimates a patient’s 10-year risk of having a heart attack based on age, gender, and cardiovascular risk factors and has had a major impact on medical practice. For PD, however, no integrated and widely applicable assessment tool for predicting the risk of cognitive decline is available.
Added value of this study
We built and validated a first clinical-genetic score for the prediction of cognitive decline in patients with PD. This cognitive risk score accurately predicted cognitive impairment within ten years of disease onset with an area under the curve (AUC) of >0.85. The predictive score may be of particular use for enriching clinical trials designed for disease modification, for preventing or ameliorating cognitive decline. The sample size required for such a hypothetical trial could be reduced by as much as 6-fold, if only high risk patients are included, compared with an equally powered trial of “all comers”. A beta-version of the cognitive risk calculator is available online.
Implications of all the available evidence
The score will enable trialists to enrich their populations with participants most likely to experience cognitive decline. Further studies are needed to identify and validate additional clinical, genetic, and biological risk factors that could be seamlessly integrated into this versatile risk assessment tool.
Acknowledgments
We thank all study participants, their families, and friends for their support and participation, and our study coordinators. The co-investigators and contributors from PDBP, HBS, DIGPD, PreCEPT/PostCEPT, PICNICS, CamPaIGN, PROPARK, as well as acknowledgements for PPMI and DATATOP are listed in the appendix.
Funding. National Institutes of Health, U.S. Department of Defense
Funding. This work was supported in part by NIH grants U01 NS082157, U01NS095736 (to CRS), U.S. Department of Defense grants W81XWH-1-0007 (BR) and W81XWH-15-10007 (to CRS); M.E.M.O. Hoffman Foundation (to CRS); Brigham & Women’s Hospital Departmental Funds (to BB). The Harvard Biomarkers Study is supported by the Harvard NeuroDiscovery Center (HNDC), the Parkinson’s Disease Biomarkers Program (PDBP) U01 NS082157, U01NS100603 of the NINDS, and the Massachusetts Alzheimer’s Disease Research Center (ADRC) P50 AG005134 grant of the National Institute on Aging, Harvard Aging Brain Study grant P01 AG036694.
The PreCEPT/PostCEPT cohort was funded by Cephalon Inc and Lundbeck for the parent PRECEPT clinical trial and follow-up PostCEPT cohort, and the Department of Defense Neurotoxin Exposure Treatment Parkinson’s Research Program (W23RRYX7022N606), NINDS PD-DOC (NS050095), the Parkinson’s Disease Foundation (New York, NY). Additional funding information for the PreCEPT/PostCEPT cohort and corresponding investigators is listed in Ref9. The CamPaIGN and PICNICS studies received funding support from the Wellcome Trust, MRC, Parkinson’s UK, Cure-PD, the Patrick Berthoud Trust, the Van Geest Foundation and NIHR funding of a Biomedical Research Centre at the University of Cambridge/Addenbrooke’s Hospital. DIGPD cohort was promoted by the Assistance Publique Hôpitaux de Paris, and founded by the French clinical research hospital program-PHRC (code AOR08010). The research leading to these results was has received funding from the program “Investissements d’Avenir” ANR-10-IAIHU-06. DATATOP was supported by NIH grant NS24778.The PROPARK study was funded by the Prinses Beatrix Fonds (project no.WAR05-0120), the van Alkemade-Keuls Foundation (‘Stichting Alkemade-Keuls’), and the International Parkinson Foundation (‘Stichting ParkinsonFonds’).
Author contributions
GL integrated data, performed statistical analysis, wrote the manuscript, reviewed and edited manuscript; JJL interpreted data, wrote the statistical analysis section, reviewed and edited manuscript; JCC, AB, FC, designed, enrolled study participants in DIGPD study, reviewed and edited manuscript; AE collected data in DIGPD study, reviewed and edited manuscript; BB integrated data, provided funding, reviewed and edited manuscript; ZL, KP processed biospecimens and performed quality-control, reviewed and edited manuscript; DF, KB performed patient assessments, obtained and processed biospecimens of HBS; reviewed and edited manuscript; IEJ processed data in the PROPARK study, reviewed and edited manuscript; AT-L assisted with overseeing organization and execution of HBS, reviewed and edited manuscript; SW-R contributed to GBA sequencing in CamPAIGN and PICNICS study, reviewed and edited manuscript; SE processed data in PreCEPT/PostCEPT study, reviewed and edited manuscript; CMT served on the Steering Committee of DATATOP, PostCEPT and PPMI, reviewed and edited manuscript; IS was principal investigator of DATATOP and the PRECEPT/PostCEPT clinical trials, and reviewed and edited manuscript; AEL served on the Steering Committees for the DATATOP and PreCEPT studies, reviewed and edited manuscript; GM collected data in DIGPD study, processed biospecimens of the DIGPD cohort for GBA sequencing, reviewed and edited manuscript; BR designed and served on the Steering Committee of PPMI, reviewed and edited manuscript; PH; JJvH, JM designed and directed PROPARK study, reviewed and edited manuscript; RAB, CHW-G designed, and the recruitment and assessment of patients and DNA sample collection and preparation in CamPAIGN and PICNICS study, reviewed and edited manuscript. CRS conceived, directed, supervised, and interpreted the study, wrote the manuscript, provided funding, designed and directed HBS, and designed and served on their Steering Committees of PPMI and PDBP.
Financial disclosures
GL, JJL, ZL, KP, DF, KB, IEJ, AT-L, SW-R, SE, AE, AB, FC, PH, and CHW-G report no conflicts of interest.
JCC: No conflict of interest concerning this study. JCC reports research grants from the French Ministry of Health, the Michael J. Fox Foundation, Ipsen, Sanofi-Aventis; travel grants from Teva, Lundbeck, UCB, Novartis; honoraria from Abbvie, Pfizer, Zambon; Stocks from the B&A Therapeutics Company.
BB is an employee of Biogen Idec.
CMT has consulted for Ultragenyx Pharmaceuticals and Neurocrine Biosciences.
AEL has served as an advisor for Abbvie, Acorda, Avanir Pharmaceuticals, Bristol Myers Squibb, Cipla, Intekrin, and Merck; received honoraria from Medtronic, Teva, UCB, AbbVie; received grants from Brain Canada, Canadian Institutes of Health Research, Edmond J Safra Philanthropic Foundation, Michael J. Fox Foundation, the Ontario Brain Institute, National Parkinson Foundation, Parkinson Society Canada, Physicians Services Incorporated (PSI), W. Garfield Weston Foundation; received publishing royalties from Saunders, Wiley-Blackwell, Johns Hopkins Press, and Cambridge University Press; and has served as an expert witness in cases related to the welding industry BR is an employee of Voyager Therapeutics, former employee of Biogen Idec and shareholder.
IS was funded by NS050095, Parkinson’s Disease Foundation, Cephalon Inc, and Lundbeck A/S; consults for Auspex Pharmaceuticals, AZTherapies, Edison Pharmaceuticals, Lundbeck A/S, Genzyme Corporation, Johnson & Johnson, Neuroglobe Ltd, Omeros Corporation, Orphazyme APS, Prana Biotechnology, Salamandra LLC, Seneb Biosciences, Sofinnova Venture Partners, Velocity Pharmaceutical Development, and Voyager Therapeutics; and receives periodic honoraria from Banner Alzheimer’s Institute, JAMA Neurology, NINDS, Nortwestern University, Partners Health Care, and University of California Irvine.
JJvH: has received funding for research from the Alkemade-Keuls Foundation, the Stichting Parkinson Fonds, the ParkinsonVereniging (grant no 2012-V10, the Netherlands Organization of Scientific Research (NWO), grant no 628.004.001), The Netherlands Organisation for Health Research and Development (Zon-MW; grant no 104002008)
RAB received grant support from the MRC, Wellcome Trust, NIHR, EU, Cure PT, PUK, Rosetrees Trust and ACT. He has received royalties from Wiley, Springer and honoraria from Lilly.
JM: No conflict of interest concerning this study. JM reports research grants from The Netherlands Organisation for Scientific Research (NWO; grant no 628.004.001), The Netherlands Organisation for Health Research and Development (Zon-MW; grant no 104002008), the ‘Parkinson Vereniging’ (grant no 2012-V10), the ‘Stichting Alkemade-Keuls, and the ‘Stichting ParkinsonFonds’.
CRS has collaborated with Pfizer, Opko, Proteome Sciences, Genzyme Inc., and Lysosomal Therapies; has consulted for Genzyme; has served as Advisor to the Michael J. Fox Foundation, NIH, Department of Defense; is on the Scientific Advisory Board of the American Parkinson Disease Association; has received funding from the NIH, the U.S. Department of Defense, the Harvard NeuroDiscovery Center, the Michael J. Fox Foundation, American Parkinson Disease Association, and the M.E.M.O. Hoffman Foundation.
Footnotes
Publisher's Disclaimer: This is a PDF file of an unedited manuscript that has been accepted for publication. As a service to our customers we are providing this early version of the manuscript. The manuscript will undergo copyediting, typesetting, and review of the resulting proof before it is published in its final citable form. Please note that during the production process errors may be discovered which could affect the content, and all legal disclaimers that apply to the journal pertain.
References
- 1.Schrag A, Jahanshahi M, Quinn N. What contributes to quality of life in patients with Parkinson’s disease? J Neurol Neurosurg Psychiatry. 2000;69(3):308–12. doi: 10.1136/jnnp.69.3.308. [DOI] [PMC free article] [PubMed] [Google Scholar]
- 2.Zhu K, van Hilten JJ, Marinus J. Predictors of dementia in Parkinson’s disease; findings from a 5-year prospective study using the SCOPA-COG. Parkinsonism Relat Disord. 2014;20(9):980–5. doi: 10.1016/j.parkreldis.2014.06.006. [DOI] [PubMed] [Google Scholar]
- 3.Aarsland D, Andersen K, Larsen JP, Lolk A, Nielsen H, Kragh-Sorensen P. Risk of dementia in Parkinson’s disease: a community-based, prospective study. Neurology. 2001;56(6):730–6. doi: 10.1212/wnl.56.6.730. [DOI] [PubMed] [Google Scholar]
- 4.Liu G, Boot B, Locascio JJ, et al. Specifically neuropathic Gaucher’s mutations accelerate cognitive decline in Parkinson’s. Ann Neurol. 2016;80(5):674–85. doi: 10.1002/ana.24781. [DOI] [PMC free article] [PubMed] [Google Scholar]
- 5.Cilia R, Tunesi S, Marotta G, et al. Survival and dementia in GBA-associated Parkinson’s disease: The mutation matters. Ann Neurol. 2016 doi: 10.1002/ana.24777. [DOI] [PubMed] [Google Scholar]
- 6.Aarsland D, Creese B, Politis M, et al. Cognitive decline in Parkinson disease. Nat Rev Neurol. 2017 doi: 10.1038/nrneurol.2017.27. [DOI] [PMC free article] [PubMed] [Google Scholar]
- 7.Locascio JJ, Eberly S, Liao Z, et al. Association between alpha-synuclein blood transcripts and early, neuroimaging-supported Parkinson’s disease. Brain. 2015 doi: 10.1093/brain/awv202. [DOI] [PMC free article] [PubMed] [Google Scholar]
- 8.Jankovic J, McDermott M, Carter J, et al. Variable expression of Parkinson’s disease: a baseline analysis of the DATATOP cohort. The Parkinson Study Group. Neurology. 1990;40(10):1529–34. doi: 10.1212/wnl.40.10.1529. [DOI] [PubMed] [Google Scholar]
- 9.Ravina B, Tanner C, Dieuliis D, et al. A longitudinal program for biomarker development in Parkinson’s disease: a feasibility study. Mov Disord. 2009;24(14):2081–90. doi: 10.1002/mds.22690. [DOI] [PubMed] [Google Scholar]
- 10.Williams-Gray CH, Mason SL, Evans JR, et al. The CamPaIGN study of Parkinson’s disease: 10-year outlook in an incident population-based cohort. J Neurol Neurosurg Psychiatry. 2013;84(11):1258–64. doi: 10.1136/jnnp-2013-305277. [DOI] [PubMed] [Google Scholar]
- 11.Breen DP, Evans JR, Farrell K, Brayne C, Barker RA. Determinants of delayed diagnosis in Parkinson’s disease. J Neurol. 2013;260(8):1978–81. doi: 10.1007/s00415-013-6905-3. [DOI] [PubMed] [Google Scholar]
- 12.Parkinson Progression Marker I. The Parkinson Progression Marker Initiative (PPMI) Prog Neurobiol. 2011;95(4):629–35. doi: 10.1016/j.pneurobio.2011.09.005. [DOI] [PMC free article] [PubMed] [Google Scholar]
- 13.Rosenthal LS, Drake D, Alcalay RN, et al. The NINDS Parkinson’s disease biomarkers program. Mov Disord. 2015 doi: 10.1002/mds.26438. [DOI] [PMC free article] [PubMed] [Google Scholar]
- 14.Goetz CG, Poewe W, Rascol O, et al. Movement Disorder Society Task Force report on the Hoehn and Yahr staging scale: status and recommendations. Mov Disord. 2004;19(9):1020–8. doi: 10.1002/mds.20213. [DOI] [PubMed] [Google Scholar]
- 15.Hoops S, Nazem S, Siderowf AD, et al. Validity of the MoCA and MMSE in the detection of MCI and dementia in Parkinson disease. Neurology. 2009;73(21):1738–45. doi: 10.1212/WNL.0b013e3181c34b47. [DOI] [PMC free article] [PubMed] [Google Scholar]
- 16.van Steenoven I, Aarsland D, Hurtg H, Chen-Plotkin A. Conversion Between Mini-Mental State Examination, Montreal Cognitive Assessment, and Dementia Rating Scale-2 Scores in Parkinson’s Disease. Movement Disorders. 2014:1809–14. doi: 10.1002/mds.26062. [DOI] [PMC free article] [PubMed] [Google Scholar]
- 17.Dubois B, Burn D, Goetz C, et al. Diagnostic procedures for Parkinson’s disease dementia: recommendations from the movement disorder society task force. Mov Disord. 2007;22(16):2314–24. doi: 10.1002/mds.21844. [DOI] [PubMed] [Google Scholar]
- 18.Marinus J, Visser M, Stiggelbout AM, et al. A short scale for the assessment of motor impairments and disabilities in Parkinson’s disease: the SPES/SCOPA. J Neurol Neurosurg Psychiatry. 2004;75(3):388–95. doi: 10.1136/jnnp.2003.017509. [DOI] [PMC free article] [PubMed] [Google Scholar]
- 19.Goetz CG, Stebbins GT, Tilley BC. Calibration of unified Parkinson’s disease rating scale scores to Movement Disorder Society-unified Parkinson’s disease rating scale scores. Mov Disord. 2012;27(10):1239–42. doi: 10.1002/mds.25122. [DOI] [PubMed] [Google Scholar]
- 20.Verbaan D, van Rooden SM, Benit CP, van Zwet EW, Marinus J, van Hilten JJ. SPES/SCOPA and MDS-UPDRS: formulas for converting scores of two motor scales in Parkinson’s disease. Parkinsonism Relat Disord. 2011;17(8):632–4. doi: 10.1016/j.parkreldis.2011.05.022. [DOI] [PubMed] [Google Scholar]
- 21.Wilson PW, D’Agostino RB, Levy D, Belanger AM, Silbershatz H, Kannel WB. Prediction of coronary heart disease using risk factor categories. Circulation. 1998;97(18):1837–47. doi: 10.1161/01.cir.97.18.1837. [DOI] [PubMed] [Google Scholar]
- 22.Litvan I, Aarsland D, Adler CH, et al. MDS Task Force on mild cognitive impairment in Parkinson’s disease: critical review of PD-MCI. Mov Disord. 2011;26(10):1814–24. doi: 10.1002/mds.23823. [DOI] [PMC free article] [PubMed] [Google Scholar]
- 23.Aarsland D, Zaccai J, Brayne C. A systematic review of prevalence studies of dementia in Parkinson’s disease. Mov Disord. 2005;20(10):1255–63. doi: 10.1002/mds.20527. [DOI] [PubMed] [Google Scholar]
- 24.Heagerty PJ, Zheng Y. Survival model predictive accuracy and ROC curves. Biometrics. 2005;61(1):92–105. doi: 10.1111/j.0006-341X.2005.030814.x. [DOI] [PubMed] [Google Scholar]
- 25.Alves G, Lange J, Blennow K, et al. CSF Abeta42 predicts early-onset dementia in Parkinson disease. Neurology. 2014;82(20):1784–90. doi: 10.1212/WNL.0000000000000425. [DOI] [PubMed] [Google Scholar]
- 26.Gomperts SN, Locascio JJ, Rentz D, et al. Amyloid is linked to cognitive decline in patients with Parkinson disease without dementia. Neurology. 2013;80(1):85–91. doi: 10.1212/WNL.0b013e31827b1a07. [DOI] [PMC free article] [PubMed] [Google Scholar]
- 27.Roberts PM, Perez EO. Ethics research compendium. Hauppauge New York: Nova Publishers; 2013. [Google Scholar]
- 28.Aarsland D, Bronnick K, Larsen JP, Tysnes OB, Alves G, Norwegian ParkWest Study G Cognitive impairment in incident, untreated Parkinson disease: the Norwegian ParkWest study. Neurology. 2009;72(13):1121–6. doi: 10.1212/01.wnl.0000338632.00552.cb. [DOI] [PubMed] [Google Scholar]
- 29.Williams-Gray CH, Foltynie T, Brayne CE, Robbins TW, Barker RA. Evolution of cognitive dysfunction in an incident Parkinson’s disease cohort. Brain. 2007;130(Pt 7):1787–98. doi: 10.1093/brain/awm111. [DOI] [PubMed] [Google Scholar]
- 30.Hely MA, Reid WG, Adena MA, Halliday GM, Morris JG. The Sydney multicenter study of Parkinson’s disease: the inevitability of dementia at 20 years. Mov Disord. 2008;23(6):837–44. doi: 10.1002/mds.21956. [DOI] [PubMed] [Google Scholar]
Associated Data
This section collects any data citations, data availability statements, or supplementary materials included in this article.