

Abstract
The interface between cells and non-biological surfaces regulates cell attachment, chronic tissue responses, and ultimately the success of medical implants or biosensors. Clinical and laboratory studies show that topological features of the surface profoundly influences cellular responses, e.g. titanium surfaces with nano- and microtopographical structures enhance osteoblast attachment and host-implant integration as compare to smooth surface. To understand how cells and tissues respond to different topographical features, it is of critical importance to directly visualize the cell-materials interface at the relevant nanometer length scale. Here, we present a new method for in situ examination of the cell-to-material interface at any desired location, based on focused-ion beam milling and scanning electron microscopy imaging (FIB-SEM) to resolve the cell membrane-to-material interface with 10 nm resolution. By examining how cell membranes interact with topographical features such as nanoscale protrusions or invaginations, we discovered that the cell membrane readily deforms inward and wraps around protruding structures, but hardly deforms outward to contour invaginating structures. This asymmetric membrane response (inward vs. outward deformation) causes the cleft width between the cell membrane and the nanostructure surface to vary for more than an order of magnitude. Our results suggest that surface topology is a crucial consideration for the development of medical implants or biosensors whose performances are strongly influenced by the cell-to-material interface. We anticipate that the method can be used to explore the direct interaction of cells/tissue with medical devices such as metal implants in the future.
Many biological applications and biomedical devices require direct contact between cells and non-biological materials1. In the case of medical implants, the cell-to-materials interface is a key determinant for successful device integration with surrounding tissues, providing mechanical support and minimizing host foreign body responses2–4. Extensive clinical and laboratory studies have shown that surface topologies of non-biological materials can significantly affect cellular and tissue responses. For example, titanium implants having a rough surface perform much better than those having a smooth surface for osteoblast attachment, host-implant integration, and the overall success of the implant1,5. At the cellular level, surfaces with nano- and micrometer topographical features have been shown to actively affect cell behavior such as stimulating stem cell differentiation6, enhancing osteoblast maturation7, and regulating macrophage activity8. In this context, understanding how cells interact with different features on the material surface is essential to study how surface topologies regulate cell signaling, guide cell migration, and control stem cell differentiation9–11.
The most critical feature of the cell-to-materials interface is the cleft between the cell membrane and the material surface, usually in the range of 50-200 nm for flat surfaces12–14. Sophisticated optical techniques have been developed to measure the cleft distance, such as fluorescence interference contrast (FLIC) microscopy15–17, surface-generated structured illumination microscopy, and variable incidence angle FLIC microscopy (VIA-FLIC18). However, these interference-based techniques are limited to smooth and reflective surfaces, and not suitable for surfaces with topological features. Transmission electron microscopy (TEM) is the most widely used method to directly visualize membrane structures at the nanoscale13,14,19. However, TEM requires sectioning the sample into ultra-thin slices (<100 nm thickness) with mechanical knives, a procedure not compatible with a variety of substrate materials. For this reason, the support material underneath the cells has to be removed and the removal process by chemical or physical treatment is often not feasible, and even if feasible, the procedure is challenging and can induce structural artifact at the interface13,20.
A combination of focused ion beam (FIB) and scanning electron microscopy (SEM) constitutes an alternative approach for in situ imaging interfaces of any material and any desired location21. However, using FIB-SEM to examine the cell-to-materials interface is severely limited by the lack of contrast of biological specimens and the sponge-like intracellular defects induced by hard drying procedures22–24. Resin embedding preparation with heavy metals allow the visualization of intracellular structures even in proximity of nanostructures25,26 but the resin matrix around the cells does not allow any visualization of the entire cells unless a 3D reconstruction of the whole specimen is performed. Recently, thin-layer resin embedding methods have been developed to allow the visualization of cells on microstructures24,27,28 but the contrast of the resulting samples is still too low to clearly resolve the membrane-to-material interface at the nanoscale. To date, there is no method that can reliably resolve the plasma membrane in proximity of nano and microstructures and thus to measure the cleft distance between the cell membrane and the material surface. Therefore, the question of how surface topology affects the cleft distance remains largely unexplored.
In this work, we present a new FIB-SEM method that can precisely resolve the cell-to-substrate interface with 10 nm resolution. At the core of our FIB-SEM method is a new sample preparation method based on controlled thin-resin plasticization of adherent cells with heavy metal staining. Unlike the usual hard drying methods, this procedure embeds cells in a thin plastic layer, which not only preserves the subcellular structures but also provides a solid support for the subsequent FIB milling. The thin-layer plasticization method includes five major steps: cell fixation, heavy metal staining, resin infiltration, extracellular resin removal, and resin polymerization (Figure 1a). Specifically, mammalian cells cultured on the desired substrate are fixed by glutaraldehyde to crosslink intracellular structures (i.e. proteins) so that they can withstand the subsequent staining and embedding processes without altering the interstitial space between the membrane and the material surface29,30. After fixation, the cells are treated with osmium and uranium-based staining series (RO-T-O procedure31,32 and en bloc staining, see Experimental procedure for details), a critical step to provide high contrast to membrane and protein structures. Then, cells are infiltrated with liquid epoxy-based resin. Traditional resin embedding procedures for TEM typically result in a 2 - 5 millimeter-thick polymer block, preventing the visualization of the whole-cell morphology. In our method, after resin infiltration and before resin polymerization, a resin-removal step is introduced that strips off the excess extracellular resin by first draining and, then, flushing the sample with ethanol. This step thins down the resin coating outside the cell membrane to tens of nanometers while maintaining a stable intracellular resin embedding24. The final step involves curing the liquid resin to a thin layer of plastic with cells embedded inside. Since extracellular resin is largely removed, cell topography and membrane protrusions in contact with the underlying substrate are clearly visible under SEM. Figure 1b shows a resin-embedded HL-1 cell cultured on a quartz substrate with arrays of nanopillars, and Supplementary S1 shows resin-embedded PC12 cells and primary cortical neurons cultured on flat glass substrates, where fine features of the cell membrane are well preserved.
Figure 1. Imaging the cell-to-material interface by FIB/SEM.
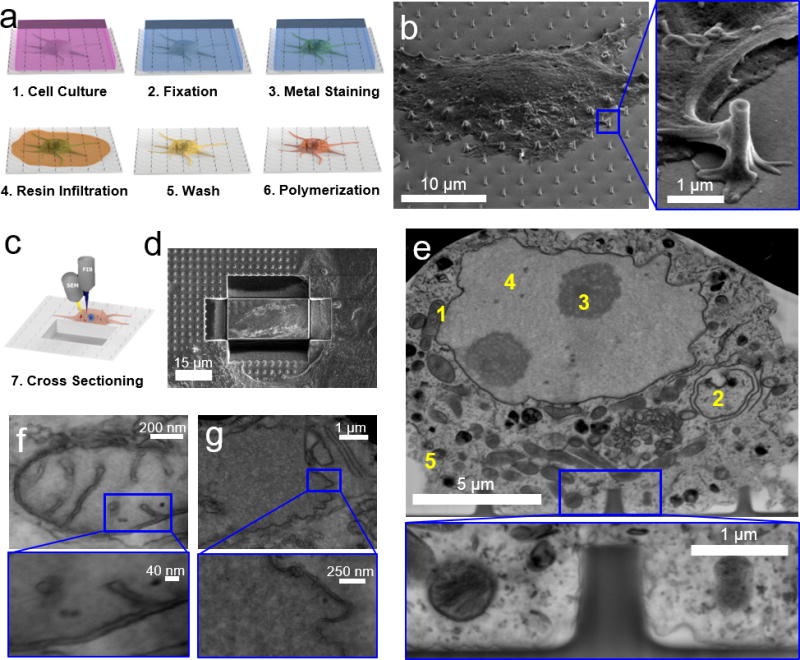
a) Schematics of the sample preparation procedure by thin-layer resin plasticization with contrast enhancement. b) A SEM image of a plasticized HL-1 cell on a quartz substrate with nanopillars shows that extracellular resin is removed and the cell morphology is clearly visible. The insert shows that the membrane protrusions in contract with a nanopillar are well preserved. c) Schematics and d) experimental results of using FIB milling to cut trenches through the cell and the substrate and open up the interface. e) A SEM image of the interface after FIB milling reveals intracellular compartments and organelles such as mitochondria (1), intracellular membranes (2), nucleoli (3), nucleus (4) and cellular membrane (5). Inset: at the interface between the cell and the quartz substrate, the plasma membrane is shown to warp around a vertical nanopillar. Intracellular structures and local curvatures on the plasma membrane resembling clathrin-mediated endocytosis events can be identified. f-g) Zoomed-in FIB-SEM images of mitochondria (f) and nuclear envelope (g), The insets clearly resolves the inner and outer membranes and interstitial space. Figures e-g have been acquired from backscattered detectors (voltage: 5-10 kV, current: 0.64-1.4 nA), tilt is 52°, original images are black-white inverted.
Samples prepared via thin layer-plasticization are directly mounted on FIB-SEM for in situ examination of the cell-to-substrate interface. For this purpose, we first examine a large sample area by SEM to identify locations of interest, such as places where cell membranes are in contact with topological features like nanopillars. Once a desired area is located, it is coated with a thin layer of platinum to prevent sample damage during the next FIB milling step (see Experimental procedure and Supplementary S2). Then, a high-energy gallium ion beam (acceleration current of 0.74 nA) is focused on the sample to cut through the platinum protection layer, the cell-embedded thin plastic layer underneath, and at least 1 µm deep into the substrate. This process is repeated to remove material and open up a vertical surface (Figure 1c–d). Then, a low-current, e.g. 80 pA, ion beam is used to remove re-deposited material and polish the cross section. This step is critical for limiting the well-known curtaining phenomena and ion-induced structural damage at the interface33. SEM visualization of the cross section clearly shows intracellular structures as well as the interface between the cell membrane and the substrate (Figure 1e). Unlike previous FIB-SEM images that usually contain sponge-like structures with no discernable subcellular structures24,27,34, our FIB-SEM images show very clear subcellular structures such as the cell membrane, the nucleus, nucleoli, the nuclear envelope, mitochondria and intracellular membranes. We note that the resin wash step of the thin-resin plasticization procedure needs to be carried out gently to avoid over-removal of the resin, which can cause cracks in the cell membrane and intracellular space. For the heavy metal staining step, either over-staining or under-staining results in poor structural contrast and lower resolution, similar to TEM samples. All FIB-SEM images are black-and-white inverted. Original images are shown in Supplementary S2.
To determine the resolution of our FIB-SEM method, we have examined a group of well-characterized cellular compartments using high magnification SEM imaging. Figure 1f shows a mitochondrion with clearly resolved inner and outer membranes (~10 nm distance) as well as the cristae structures. Figure 1g shows the structure of a nuclear envelope with well distinguishable inner and outer membranes which are separated by an interstitial space of about 20 nm. Endoplasmic reticulum (ER) structures as parallel running membranes can be seen in the vicinity of the nucleus, and the associated small granules attached to the membrane of the ER likely are ribosomes (Supplementary S3). Other intracellular structures such as multivesicular bodies and intracellular membrane can also be resolved in Supplementary S3. Furthermore, high magnification SEM image of the cell-substrate interface clearly reveals that the plasma membrane is very close to the flat substrate surface and contours around local nanopillar features (Figure 1e - inset).
The development of the new FIB-SEM method allows us to quantitatively address the question of how different surface topographies affect the cell-substrate cleft distance. For this study, we engineer SiO2 substrate (or Si substrates with a SiO2 surface layer) with different surface geometries, including protrusions, invaginations, flat, and other complex structures (see Experimental procedure for fabrication details). The protrusions are vertical nanopillars with diameters or length varying from 200 nm to 1500 nm, and a height of 1 µm and spacing of 3-5 µm (Figure 2b,d and Supplementary S4). The invaginations are pores with diameters varying from 200 nm to 6000 nm, and a depth of about 500 nm - 1µm and spacing of 3 µm (20 µm for the largest pore) (Figure 2g,i and Supplementary S5). A cell on a flat surface is shown in Figure 2l. The complex structures include nanotubes, nanobars, irregular nanocones, nanoletters (CUIO) and grooves and they are shown in Supplementary S4&S6. All substrates were coated with Poly-L-lysine or fibronectine to facilitate cell adhesion. HEK or HL-1 cells were used for the studies. Cells cultured on different substrates were processed for FIB-SEM imaging using our new aforementioned preparation method. SEM images of cells cultured on flat, nanopillar, and nanopore substrates before FIB milling show healthy and spread cell morphology (Supplementary S7).
Figure 2. Surface topology drastically affects the cleft distance between the cell membrane and the material surface.
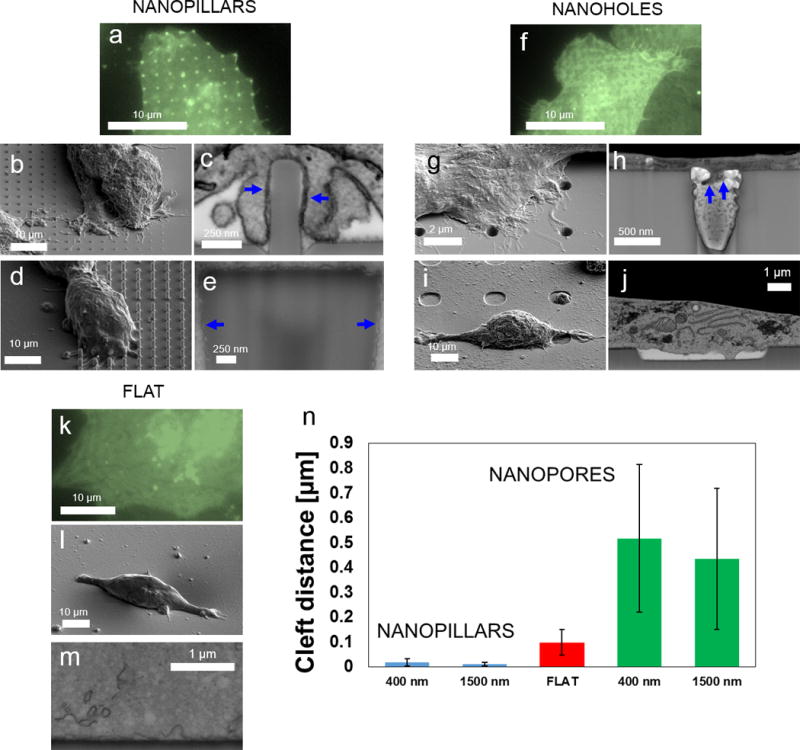
a,f,k) CAAX-GFP transfected cells in green on nanopillars (a), nanopores (f) and flat surface (k) show accumulation (bright spots) for nanopillars and uniform distribution for nanopores and flat surface. b,d,g,i,l) SEM of plasticized HEK cells on a nanopillar arrays (b,d), nanopore arrays (g,i) and flat surface (l). c,e,h,j) FIB cross sections reveal that plasma membrane wraps tightly around nanopillars with 400 nm (c) and 1500 nm diameter (e) while mostly grows on top of nanopores of about 400 nm in diameter (h) and tentatively grows inside the nanopore of about 6 µm diameter but remain far away from the surface in most places (j). m) FIB cross section of a cell on a planar silicon surface shows the membrane-to-material contact at the interface. n) Direct measurements shows that nanopillars reduce the cleft distance as compared to flat surfaces, while nanopores drastically increase the cleft distance.
The FIB-SEM imaging reveals drastic differences in how cell membranes respond to different substrate nanotopologies. For substrates with protruding structures, the cell membrane deforms readily and wraps conformably around the surface topology, as shown in Figure 2c&e and (Supplementary S8), for nanopillars with 400 nm and about 1500 nm diameter, respectively. For nanopillars of all diameters the cell membrane is usually within 10 - 30 nm in average from the substrate surface. In sharp contrast, for substrates with invaginating structures, the cell membrane hardly deforms and does not contour the surface of nanopores or the hollow centers of the nanotubes (Supplementary S9). For small diameter pores (Figure 2h), the cell membrane extends into the pores slightly, but the cleft distance is usually more than 10 times greater that for nanopillars. For nanopores as large as 6 µm in diameter and 500 nm depth, the cell membrane is still far away from the surface (Figure 2j) but some attachment points are created into the pore. For flat surfaces, the cell membrane remains close to the surface (Figure 2m). A similar phenomenon is observed in other complex structures (Supplementary S9). For protruding structures such as nanobars, CUIO nanoletters and nanocones, the cell membrane is very close to the substrate surface, while for invaginating structures such as grooves, the cell membrane is far away from the substrate surface (Supplementary S9). For nanotubes, the cell membrane wraps tightly around the outside wall of the tube (protruding structure), while remains far away from the inner wall of the hollow center (invaginating structure, Supplementary S9). This is a surprising result as previous studies suggest that the cell membrane is highly deformable and can extend into pits as small as 50 nm35,36.
In order to evaluate the cleft formed between the plasma membrane and different surface topographies, we systematically measured the average cleft distance for surfaces with nanopillars and nanopores with comparable dimensions, and flat surfaces (measurement statistics shown in Supplementary S10). As seen in Figure 2n, the cleft distance is ~ 100 nm (stdv 50 nm) for flat surface, which agrees with previous studies12,14. The cleft distance decreases to ~ 15 nm (stdv 10 nm) for nanopillars while increases to >400 nm for nanopores (stdv 300 nm). These dramatic changes in the cleft width suggest that the plasma membrane interacts with protruding and invaginating surface topologies in fundamentally different ways. In addition, we calculated the cleft area between the membrane and the nanostructures for all the investigated nanoholes and nanopillar types. The cleft index measurement confirms that the cleft area increases in the presence of nanopores and decreases in presence of nanopillars (see Supplementary S10 and S11 for details).
To corroborate the FIB-SEM studies, we also examined how the plasma membrane interacts with different surface topologies by fluorescence imaging. At the same time, we simultaneously probed the distribution of actin filaments, which are well known to participate in the dynamics and the formation of protrusions or invaginations on the cell membrane37,38. Cells were co-transfected with two plasmids, CAAX-GFP, which serves as a marker for the plasma membrane, and LifeAct-RFP, which is widely used to visualize F-actin in cells. Fluorescence imaging of CAAX-GFP confirms that the cell membrane wraps around nanopillars (bright spots due to projection of the vertical membrane in Figure 2a) but not nanopores or flat surface (Figure 2f,k). LifeAct-RFP imaging shows that F-actin accumulates strongly on nanopillar locations, but is absent at nanopore (Supplementary S12) and flat surfaces (data not shown). This preliminary result suggests that actin filament might be involved in forming the close contact between the cell membrane and the nanopillars.
Next, we examine whether the topological effect for the interface cleft depends on the chemical composition of the material. Considering that our FIB-SEM method is applicable to materials with diverse composition and stiffness, we compared flat and nanopillar surfaces made of quartz (Young’s modulus ~80 GPa) and conductive polymer blend poly(3,4-ethylenedioxythiophene):polystyrene sulfonate (PEDOT, Young’s modulus ~ 1 GPa). Unlike quartz (shown as the grey bottom layer in Figure 2f–i), PEDOT is conductive and scatters electrons strongly (shown as the black bottom layer in Figure 3b), which reduces the effective contrast of the biological sample. Despite this, the FIB-SEM image in Figure 3b (cells before cut shown in Figure 3a) still clearly resolves the cell membrane-surface gap, achieving the first cross section visualization of cells on PEDOT surface. Here, we measured the effective distance of the plasma membrane from the surface. The cell membrane is seen in close contact with the flat PEDOT surface and the average cleft distance is measured to be 89±73 nm (stdv)), similar to the cleft distance for the flat quartz surface at 98±52 nm (stdv). Next, we compared the cleft distances for nanopillar substrates made of quartz and covered with a thin layer of PEDOT (Figure 3c–d). Our measurements show that the average cleft distances for quartz nanopillars and PEDOT nanopillars are similar (15±2.7 nm and 11±4.1 nm, stdv) but much smaller than that for the flat surfaces. The statistical details of these measurement are shown in Supplementary S10.
Figure 3. Comparison of quartz and PEDOT surfaces shows that the cleft distance is mainly determined by surface topologies.

a) An SEM image of a plasticized HL-1 cell on planar PEDOT. b) The FIB cross section reveals the plasma membrane and local ruffling on the planar PEDOT surface. c) An SEM image of a plasticized HL-1 cell on quartz nanopillars covered with a thin layer (10-20 nm) of PEDOT. d) The FIB cross section reveals the close contact of the plasma membrane to the PEDOT superficial layer on the nanopillar. e) Quantitative analysis of the average cleft values and the corresponding standard deviation calculated for quartz (Q) and PEDOT (P) substrates with planar and nanopillars surfaces show that cleft values are comparable for same structures but different materials.
Finally, we explored the capabilities of FIB/SEM method for volumetric imaging and multi-angle imaging. FIB-SEM allows repetitive milling and imaging, allowing the investigation of a volume of interest (VOI) (Figure 4a). We used low current (e.g. 80 pA) for sequential FIB milling, which achieves slice thickness of about 20-40 nm and well beyond the capability of mechanical slicing by means of ultramicrotomes (70 - 200 nm). Figures 4b&c show two representative cross-sections of the same cell (shown in Figure 4a) interacting with two different lines of nanopillars. By sequentially imaging a set of 72 sequential sections, we reconstructed a 3D intracellular space and its interaction with nanopillars using a segmented 3D reconstruction method (Figure 4d, Supplementary Movie 1). In particular, we modeled the 3D morphology of the nuclear envelope, nucleoli, and the non-adherent cellular membrane domain, which were individually constructed and overlaid to the remaining structures as shown in Figure 4e. The nuclear envelope appears to be bend upward on top of a nanopillar for as much as 800 nm (Figure 4f), agreeing well with our previous observation by TEM39.
Figure 4. FIB-SEM for sequential volumetric imaging and multi-angled imaging.
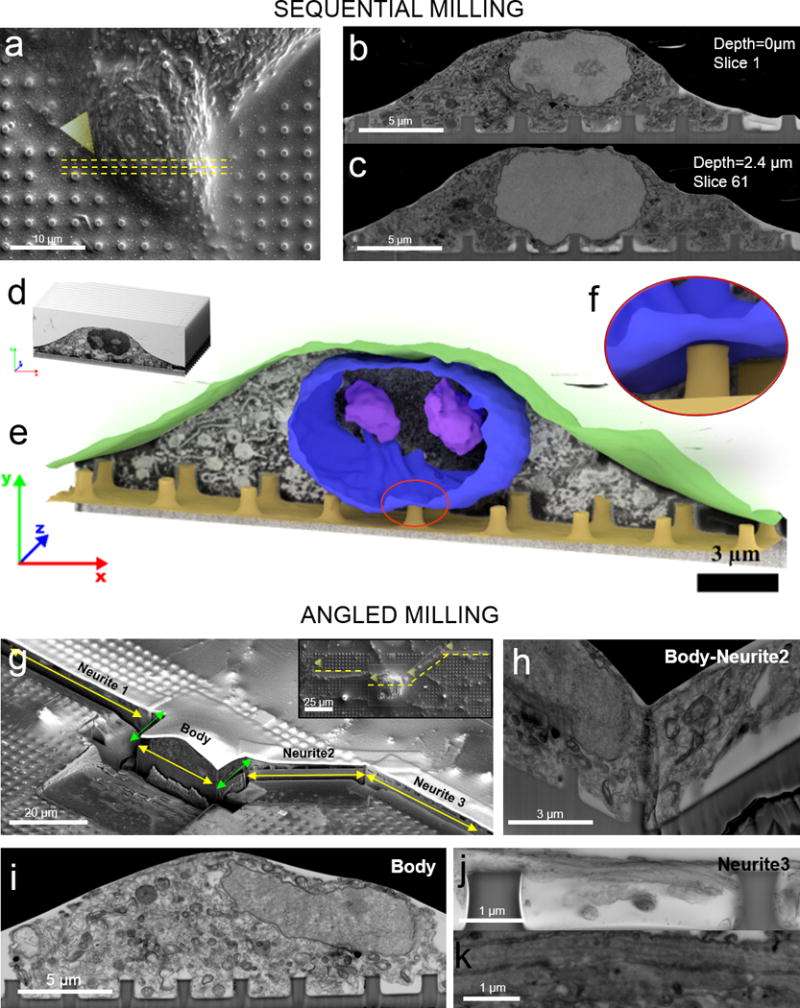
a) An SEM image of a plasticized HL-1 on nanopillars where yellow dashed lines indicate the region of interest for the sequential milling. b-c) SEM images of two exemplary slices from a stack of 78 slices at two different pillars’ lines. d-f) Images collected in the stack were assembled, segmented, and analyzed. Automated 3D reconstruction of the top membrane and the nuclear envelope were overlaid to SEM background image. Reconstruction shows that the nuclear envelope is deformed upward by a nanopillar. g) FIB milling of a neuron where yellow arrows indicates the regions of interest and green lines indicates the connecting regions (the inset shows a SEM image of the same neuron before FIB milling). h) A FIB-SEM image of the body-neurite 2 connecting region opened at 90-degree angle. i) A FIB-SEM image of the neuronal body on a line of nanopillars. j) A FIB-SEM image of neurite 3 on top of nanopillars. k) Zoomed-in image of neurites reveals multiple longitudinally orientate microtubules parallel to the direction of the neurite.
Unlike the ultramicrotome sectioning method that slices materials sequentially in only one direction, the FIB-SEM method is highly versatile and allows sectioning of the same sample with different directions at multiple locations. This capability is often important for cells with protrusions such as neurons. Primary cortical neurons from embryonic rats were cultured on a quartz substrate with arrays of solid nanopillars. After 5 days of culturing in vitro, neurons were fixed and processed for FIB-SEM imaging as described earlier. A SEM image in Figure 4g (insert) shows a neuron cell body together with multiple neurites growing out from the cell body. We first identified four regions of interest from the SEM image: the cell body, neurite-1, neurite-2 and neurite-3. Then, after coating a layer of Pt, FIB milling was used to cut open the interfaces along six connecting lines (yellow arrowed lines corresponding to four regions of interest and green arrowed lines being the connecting lines in Figure 4g). FIB-SEM imaging of the cell body shows the nucleus, large number of intracellular organelles and the plasma membrane wrapping around nanopillars (Figure 4i). By multi-angle milling, FIB-SEM also offers a unique advantage of examining a location from multiple directions as shown by the 90-degree intersection between the neurite-2 and the cell body (Figure 4h). The cross-section of neurite-3 is shown in Figure 4j, which illustrates a neurite attached to the top and the side of two nanopillars. A magnified image of a neurite reveals multiple longitudinally orientated microtubules parallel to the direction of the neurite (Figure 4k), comparable in morphology to those investigated by TEM40,41.
In conclusion, we demonstrate a new FIB-SEM method for imaging the cell-to-material interface in situ, without removing the substrate. The FIB-SEM method has unique advantages of examining a large sample area, opening up cross sections at any desired location, achieving volume reconstruction, and performing multi-directional milling. This method achieves a high contrast and resolution at 10 nm and is uniquely suitable to investigate the interface between the cell membrane and non-biological materials. Our study reveals a surprising discovery that the cleft width between the cell membrane and the substrate surface is strongly influenced by the surface topology. As the cell attachment and the membrane-to-material interface strongly influence the performance of medical implants and biosensors, our study suggests that surface topology is a crucial consideration for the development of new materials and devices for biological applications. Furthermore, as the FIB-SEM method is compatible with a variety of substrate materials and topographies, we expect that this method can be used for more sophisticated in vivo studies such as examining the interfaces between osteoblast and titanium implants. We also expect this FIB-SEM method be compatible with immunolabeling and genetically encoded EM enhancers42.
Supplementary Material
Acknowledgments
The authors thank the Stanford Nano Shared Facility (SNSF) for a seed grant to a complimentary use of the Helios 600i and Dr. Juliet Jamtgaard and Dr. Richard Chin for the useful discussions. The authors also acknowledge the Heart Rhythm Society for F.S.’s research fellowship, the National Science Foundation for the grants NSF 1055112 and NSF 1344302. Y.V.B was a user project at the Molecular Foundry, Lawrence Berkeley National Laboratory, all supported by the Office of Science, Office of Basic Energy Sciences, U.S. Department of Energy, under contract DE-AC02-05CH11231.
References
- 1.Langer R, Tirrell DA. Designing materials for biology and medicine. Nature. 2004;428:487–492. doi: 10.1038/nature02388. [DOI] [PubMed] [Google Scholar]
- 2.Anderson JM. Biological Responses to Materials. Annu Rev Mater Res. 2001;31:81–110. [Google Scholar]
- 3.Kieswetter K, Schwartz Z, Dean DD, Boyan BD. The role of implant surface characteristics in the healing of bone. Crit Rev Oral Biol Med Off Publ Am Assoc Oral Biol. 1996;7:329–345. doi: 10.1177/10454411960070040301. [DOI] [PubMed] [Google Scholar]
- 4.Rychly J, Nebe B. Interface Biology of Implants. Cell Adhes Migr. 2009;3:390–394. doi: 10.4161/cam.3.4.9524. [DOI] [PMC free article] [PubMed] [Google Scholar]
- 5.Olivares-Navarrete R, et al. Osteoblast Lineage Cells Can Discriminate Microscale Topographic Features on Titanium–Aluminum–Vanadium Surfaces. Ann Biomed Eng. 2014;42:2551–2561. doi: 10.1007/s10439-014-1108-3. [DOI] [PMC free article] [PubMed] [Google Scholar]
- 6.Chen W, Shao Y, Li X, Zhao G, Fu J. Nanotopographical surfaces for stem cell fate control: Engineering mechanobiology from the bottom. Nano Today. 2014;9:759–784. doi: 10.1016/j.nantod.2014.12.002. [DOI] [PMC free article] [PubMed] [Google Scholar]
- 7.Schneider GB, et al. Implant surface roughness affects osteoblast gene expression. J Dent Res. 2003;82:372–376. doi: 10.1177/154405910308200509. [DOI] [PubMed] [Google Scholar]
- 8.Luu TU, Gott SC, Woo BWK, Rao MP, Liu WF. Micro- and Nanopatterned Topographical Cues for Regulating Macrophage Cell Shape and Phenotype. ACS Appl Mater Interfaces. 2015;7:28665–28672. doi: 10.1021/acsami.5b10589. [DOI] [PMC free article] [PubMed] [Google Scholar]
- 9.Stevens MM, George JH. Exploring and Engineering the Cell Surface Interface. Science. 2005;310:1135–1138. doi: 10.1126/science.1106587. [DOI] [PubMed] [Google Scholar]
- 10.Kasemo B. Biological surface science. Surf Sci. 2002;500:656–677. [Google Scholar]
- 11.Oh S, et al. Stem cell fate dictated solely by altered nanotube dimension. Proc Natl Acad Sci. 2009;106:2130–2135. doi: 10.1073/pnas.0813200106. [DOI] [PMC free article] [PubMed] [Google Scholar]
- 12.Toma K, Kano H, Offenhäusser A. Label-Free Measurement of Cell–Electrode Cleft Gap Distance with High Spatial Resolution Surface Plasmon Microscopy. ACS Nano. 2014;8:12612–12619. doi: 10.1021/nn505521e. [DOI] [PubMed] [Google Scholar]
- 13.Hanson L, Lin ZC, Xie C, Cui Y, Cui B. Characterization of the Cell-Nanopillar Interface by Transmission Electron Microscopy. Nano Lett. 2012;12:5815–5820. doi: 10.1021/nl303163y. [DOI] [PMC free article] [PubMed] [Google Scholar]
- 14.Wrobel G, et al. Transmission electron microscopy study of the cell–sensor interface. J R Soc Interface. 2008;5:213–222. doi: 10.1098/rsif.2007.1094. [DOI] [PMC free article] [PubMed] [Google Scholar]
- 15.Kiessling V, Tamm LK. Measuring Distances in Supported Bilayers by Fluorescence Interference-Contrast Microscopy: Polymer Supports and SNARE Proteins. Biophys J. 2003;84:408–418. doi: 10.1016/S0006-3495(03)74861-9. [DOI] [PMC free article] [PubMed] [Google Scholar]
- 16.Lambacher A, Fromherz P. Fluorescence interference-contrast microscopy on oxidized silicon using a monomolecular dye layer. Appl Phys A. 1996;63:207–216. [Google Scholar]
- 17.Braun D, Fromherz P. Fluorescence interference-contrast microscopy of cell adhesion on oxidized silicon. Appl Phys A. 1997;65:341–348. [Google Scholar]
- 18.Ajo-Franklin CM, Ganesan PV, Boxer SG. Variable Incidence Angle Fluorescence Interference Contrast Microscopy for Z-Imaging Single Objects. Biophys J. 2005;89:2759–2769. doi: 10.1529/biophysj.105.066738. [DOI] [PMC free article] [PubMed] [Google Scholar]
- 19.Fendyur A, Mazurski N, Shappir J, Spira ME. Formation of Essential Ultrastructural Interface between Cultured Hippocampal Cells and Gold Mushroom-Shaped MEA- Toward ‘IN-CELL’ Recordings from Vertebrate Neurons. Front Neuroengineering. 2011;4 doi: 10.3389/fneng.2011.00014. [DOI] [PMC free article] [PubMed] [Google Scholar]
- 20.Hai A, et al. Changing gears from chemical adhesion of cells to flat substrata toward engulfment of micro-protrusions by active mechanisms. J Neural Eng. 2009;6:066009. doi: 10.1088/1741-2560/6/6/066009. [DOI] [PubMed] [Google Scholar]
- 21.Narayan K, Subramaniam S. Focused ion beams in biology. Nat Methods. 2015;12:1021–1031. doi: 10.1038/nmeth.3623. [DOI] [PMC free article] [PubMed] [Google Scholar]
- 22.Boyde A, MacOnnachie E. Volume changes during preparation of mouse embryonic tissue for scanning electron microscopy. Scanning. 1979;2:149–163. [Google Scholar]
- 23.Gusnard D, Kirschner RH. Cell and organelle shrinkage during preparation for scanning electron microscopy: effects of fixation, dehydration and critical point drying. J Microsc. 1977;110:51–57. doi: 10.1111/j.1365-2818.1977.tb00012.x. [DOI] [PubMed] [Google Scholar]
- 24.Belu A, et al. Ultra-thin resin embedding method for scanning electron microscopy of individual cells on high and low aspect ratio 3D nanostructures. J Microsc. 2016;263:78–86. doi: 10.1111/jmi.12378. [DOI] [PubMed] [Google Scholar]
- 25.Persson H, et al. Fibroblasts Cultured on Nanowires Exhibit Low Motility, Impaired Cell Division, and DNA Damage. Small. 2013;9:4006–4016. doi: 10.1002/smll.201300644. [DOI] [PMC free article] [PubMed] [Google Scholar]
- 26.Wierzbicki R, et al. Mapping the Complex Morphology of Cell Interactions with Nanowire Substrates Using FIB-SEM. PLoS ONE. 2013;8:e53307. doi: 10.1371/journal.pone.0053307. [DOI] [PMC free article] [PubMed] [Google Scholar]
- 27.Bittermann AG, Burkhardt C, Hall H. Imaging of Cell-to-Material Interfaces by SEM after in situ Focused Ion Beam Milling on Flat Surfaces and Complex 3D-Fibrous Structures. Adv Eng Mater. 2009;11:B182–B188. [Google Scholar]
- 28.Seyock S, Maybeck V, Offenhäusser A. How to image cell adhesion on soft polymers? Micron. 2017;92:39–42. doi: 10.1016/j.micron.2016.11.002. [DOI] [PubMed] [Google Scholar]
- 29.Collins VP, Arborgh B, Brunk U. A Comparison of the Effects of Three Widely Used Glutaraldehyde Fixatives on Cellular Volume and Structure. Acta Pathol Microbiol Scand [A] 1977;85A:157–168. doi: 10.1111/j.1699-0463.1977.tb00413.x. [DOI] [PubMed] [Google Scholar]
- 30.Jeansson M, Haraldsson B. Morphological and functional evidence for an important role of the endothelial cell glycocalyx in the glomerular barrier. Am J Physiol - Ren Physiol. 2006;290:F111–F116. doi: 10.1152/ajprenal.00173.2005. [DOI] [PubMed] [Google Scholar]
- 31.Tapia JC, et al. High-contrast en bloc staining of neuronal tissue for field emission scanning electron microscopy. Nat Protoc. 2012;7:193–206. doi: 10.1038/nprot.2011.439. [DOI] [PMC free article] [PubMed] [Google Scholar]
- 32.Bushby AJ, et al. Imaging three-dimensional tissue architectures by focused ion beam scanning electron microscopy. Nat Protoc. 2011;6:845–858. doi: 10.1038/nprot.2011.332. [DOI] [PubMed] [Google Scholar]
- 33.Santoro F, Neumann E, Panaitov G, Offenhäusser A. FIB section of cell–electrode interface: An approach for reducing curtaining effects. Microelectron Eng. 2014;124:17–21. [Google Scholar]
- 34.Santoro F, et al. Interfacing Electrogenic Cells with 3D Nanoelectrodes: Position, Shape, and Size Matter. ACS Nano. 2014;8:6713–6723. doi: 10.1021/nn500393p. [DOI] [PubMed] [Google Scholar]
- 35.Moran-Mirabal JM, Torres AJ, Samiee KT, Baird BA, Craighead HG. Cell investigation of nanostructures: zero-mode waveguides for plasma membrane studies with single molecule resolution. Nanotechnology. 2007;18:195101. [Google Scholar]
- 36.Richards CI, et al. Live-Cell Imaging of Single Receptor Composition Using Zero-Mode Waveguide Nanostructures. Nano Lett. 2012;12:3690–3694. doi: 10.1021/nl301480h. [DOI] [PMC free article] [PubMed] [Google Scholar]
- 37.Atilgan E, Wirtz D, Sun SX. Mechanics and Dynamics of Actin-Driven Thin Membrane Protrusions. Biophys J. 2006;90:65–76. doi: 10.1529/biophysj.105.071480. [DOI] [PMC free article] [PubMed] [Google Scholar]
- 38.Schafer DA. Coupling actin dynamics and membrane dynamics during endocytosis. Curr Opin Cell Biol. 2002;14:76–81. doi: 10.1016/s0955-0674(01)00297-6. [DOI] [PubMed] [Google Scholar]
- 39.Hanson L, et al. Vertical nanopillars for in situ probing of nuclear mechanics in adherent cells. Nat Nanotechnol. 2015;10:554–562. doi: 10.1038/nnano.2015.88. [DOI] [PMC free article] [PubMed] [Google Scholar]
- 40.Bartlett WP, Banker GA. An electron microscopic study of the development of axons and dendrites by hippocampal neurons in culture. I Cells which develop without intercellular contacts. J Neurosci. 1984;4:1944–1953. doi: 10.1523/JNEUROSCI.04-08-01944.1984. [DOI] [PMC free article] [PubMed] [Google Scholar]
- 41.Maxwell WL. Damage to Myelin and Oligodendrocytes: A Role in Chronic Outcomes Following Traumatic Brain Injury? Brain Sci. 2013;3:1374–1394. doi: 10.3390/brainsci3031374. [DOI] [PMC free article] [PubMed] [Google Scholar]
- 42.Lam SS, et al. Directed evolution of APEX2 for electron microscopy and proximity labeling. Nat Meth. 2015;12:51–54. doi: 10.1038/nmeth.3179. [DOI] [PMC free article] [PubMed] [Google Scholar]
Associated Data
This section collects any data citations, data availability statements, or supplementary materials included in this article.