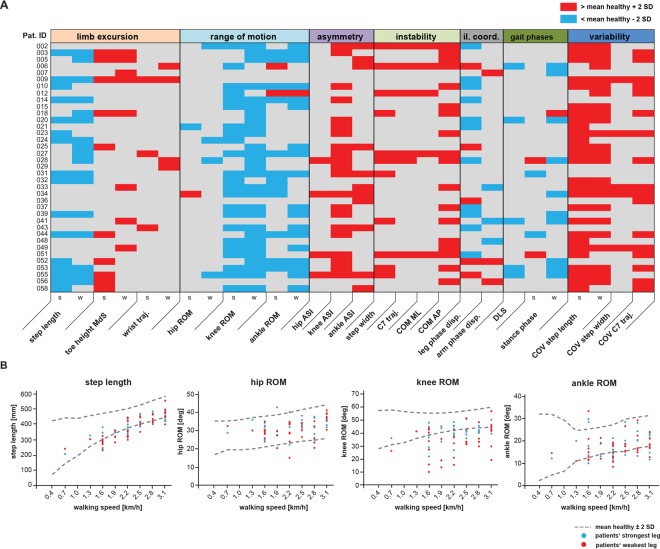
Figure 3.
Individual gait profiles of patients with MS. (A) Kinematic gait parameters for single subjects with MS (n = 37) walking at half-maximal gait speed (vmax50%) represented in a color-coded grading system. Twenty-eight parameters were classified as normal/unchanged (grey), pathologically reduced (blue) or pathologically increased (red) based on normative data obtained from 20 healthy controls. (B) Graphs show changes in selected gait parameters in subjects with MS in relation to walking speed. Values located outside the interval of the mean ± 2 SD of 20 healthy control subjects (dashed grey line) were defined as pathological. Data for the weakest leg is displayed in red, while values for the strongest leg are shown in blue. Abbreviations: AP: anteroposterior; ASI: asymmetry index; COM: centre of mass; COV: coefficient of variation; disp.: dispersion; deg: degrees; DLS: double-limb support; il. coord.: inter-limb coordination; s: strongest leg; MdS: midswing; ML: mediolateral; Pat. ID: patient identification number; ROM: range of motion; SD: standard deviation; traj.: trajectory; w- weakest leg.

