
Figure 3. Replication of core TFs in independent datasets.
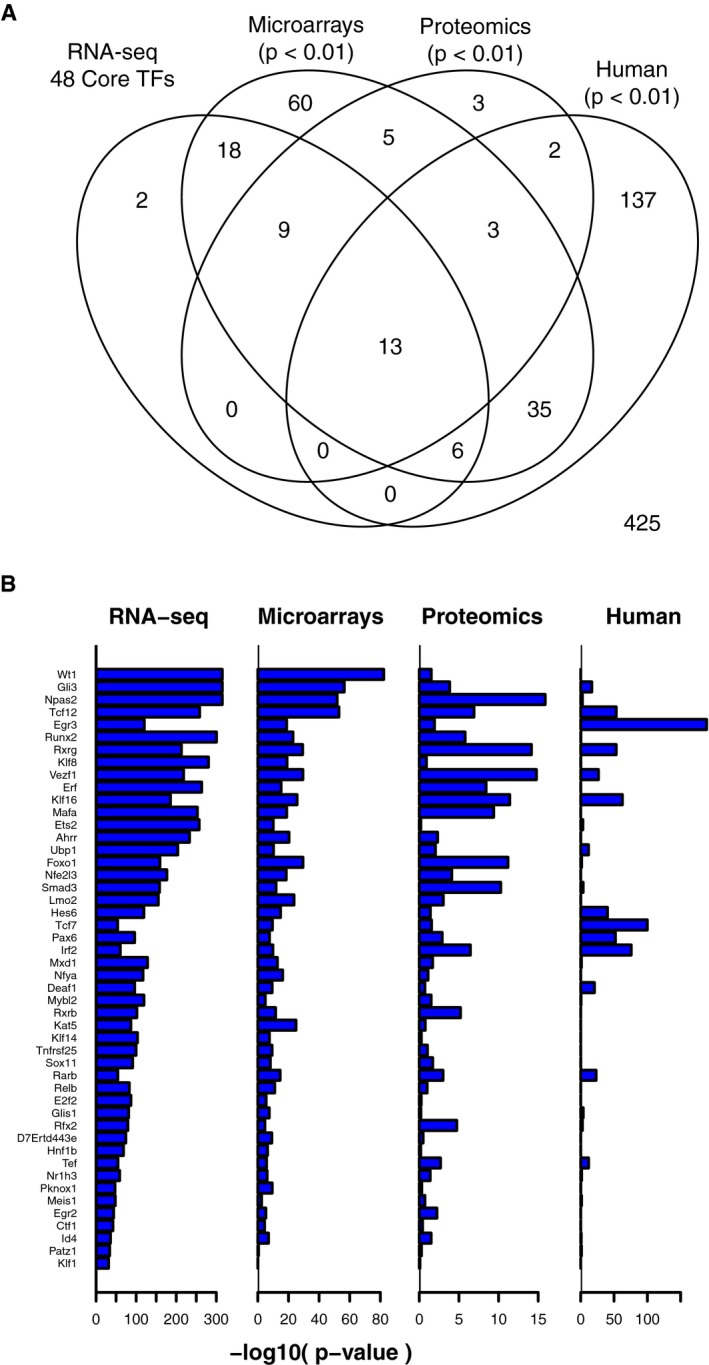
- Venn diagram showing overlap between core regulator TF‐target gene modules identified in the primary RNA‐seq dataset, compared to TF‐target gene modules enriched for differentially expressed genes in three independent datasets.
- −log10(P‐values) for the strength of enrichment of each of the core regulator TF‐target gene modules for differentially expressed genes in each of the four datasets.