

Abstract
Key points
Although the natural decline in walking performance with ageing affects the quality of life of a growing elderly population, its physiological origins remain unknown.
By using predictive neuromechanical simulations of human walking with age‐related neuro‐musculo‐skeletal changes, we find evidence that the loss of muscle strength and muscle contraction speed dominantly contribute to the reduced walking economy and speed.
The findings imply that focusing on recovering these muscular changes may be the only effective way to improve performance in elderly walking.
More generally, the work is of interest for investigating the physiological causes of altered gait due to age, injury and disorders.
Abstract
Healthy elderly people walk slower and energetically less efficiently than young adults. This decline in walking performance lowers the quality of life for a growing ageing population, and understanding its physiological origin is critical for devising interventions that can delay or revert it. However, the origin of the decline in walking performance remains unknown, as ageing produces a range of physiological changes whose individual effects on gait are difficult to separate in experiments with human subjects. Here we use a predictive neuromechanical model to separately address the effects of common age‐related changes to the skeletal, muscular and nervous systems. We find in computer simulations of this model that the combined changes produce gait consistent with elderly walking and that mainly the loss of muscle strength and mass reduces energy efficiency. In addition, we find that the slower preferred walking speed of elderly people emerges in the simulations when adapting to muscle fatigue, again mainly caused by muscle‐related changes. The results suggest that a focus on recovering these muscular changes may be the only effective way to improve performance in elderly walking.
Keywords: elderly gait, neuromechanical simulation, muscle atrophy, muscle fatigue, metabolic cost of transport
Key points
Although the natural decline in walking performance with ageing affects the quality of life of a growing elderly population, its physiological origins remain unknown.
By using predictive neuromechanical simulations of human walking with age‐related neuro‐musculo‐skeletal changes, we find evidence that the loss of muscle strength and muscle contraction speed dominantly contribute to the reduced walking economy and speed.
The findings imply that focusing on recovering these muscular changes may be the only effective way to improve performance in elderly walking.
More generally, the work is of interest for investigating the physiological causes of altered gait due to age, injury and disorders.
Introduction
Walking performance declines with ageing. Compared to young adults in their 20s, elderly people in their 70s walk with a 15–30% higher metabolic cost (Fig. 1) (Martin et al. 1992; Mian et al. 2006) and a 0.2–0.6 ms−1 slower speed (Himann et al. 1988; Lauretani et al. 2003). At the same time, the physiological properties of the locomotor apparatus change with ageing. The body's mass distribution shifts (Pavol et al. 2002), muscles become weaker (Goodpaster et al. 2006; Delmonico et al. 2009) and slower (Thelen, 2003; Nilwik et al. 2013), and neural signals become slower (Rivner et al. 2001) and noisier (Goble et al. 2009). Understanding how these physiological changes relate to the decline in walking performance is essential to improving mobility, and thus, the quality of life for elderly people.
Figure 1. Metabolic cost of transport (COT) in young and elderly people (measured by oxygen consumption).

The plot is reproduced from data reported in Martin et al. (1992).
Despite many experiments with human subjects, the physiological origins of the decline in walking performance remain obscure. Previous experimental studies have found that neither the mechanical work (Mian et al. 2006; Monaco & Micera, 2012) nor stability measures (Malatesta et al. 2003; Ortega et al. 2008) nor the basal metabolism (Mian et al. 2006) explain the increase in the metabolic cost of elderly walking. Other suggestions such as a change in control strategy (Peterson & Martin, 2010; Hortobagyi et al. 2011) or a decline in muscle force capacity (Lauretani et al. 2003; Monaco & Micera, 2012) remain debated or require further investigation for clarification (Martin et al. 1992). The decrease in walking speed seems to be even more difficult to explain, as it involves the notion of preference. For instance, the minimization of the cost of transport (COT), the metabolic energy consumed per distance travelled, is often argued to explain the preferred walking speed in animals and humans (Ralston 1958; Hoyt & Taylor 1981). Yet the speed at which the COT is minimal does not change much with ageing (Fig. 1) and, therefore, the COT cannot account for the lower walking speed elderly people prefer (Martin et al. 1992; Malatesta et al. 2003; Mian et al. 2006). The problem with understanding elderly gait is that age‐related changes in physiology cannot be independently controlled in experiments with humans, making it difficult to reveal a causal relationship between walking performance and a particular change.
This problem vanishes in simulation studies. In neuromechanical models of human gait, physiological changes can be independently controlled, and their effect on walking performance can be evaluated with computer simulations. So far, only a few such simulation studies have focused on age‐related changes. For instance, it has been found in simulations that the ability to walk with the joint angles of young adults is fairly robust to weakening muscles, although it would increase muscle stress (muscle force relative to its force capacity) (van der Krogt et al. 2012), and that weak muscles with softer tendons do not alter the net mechanical efficiency of the lower limb muscles in elderly gait, although individual muscle efficiencies shift (Monaco & Micera, 2012). However, in these previous studies, the neuromechanical models were simulated to follow walking trajectories observed in young and elderly adults, leaving it open whether the predicted effects result from the applied physiological changes or the enforced walking trajectories. This ambiguity can be resolved with neuromechanical models that generate walking behaviour.
Methods
Here, we use a predictive neuromechanical model to investigate the physiological origins of both the higher metabolic cost and the slower speed in elderly walking. Specifically, we modify a baseline model of young adult walking (Song & Geyer, 2015) (Fig. 2) to represent healthy elderly gait. The modifications mimic common age‐related physiological changes including skeletal changes (S 1: lighter legs and heavier trunk, Pavol et al. 2002; S 2: reduced range of hip extension, Roach & Miles, 1991), muscular changes (M 1: weaker and smaller muscles, Goodpaster et al. 2006; Delmonico et al. 2009; M 2: other muscle properties leading primarily to slower contraction, Thelen, 2003; Nilwik et al. 2013), and neural changes (N 1: slower neural conductance speed, Rivner et al. 2001; N 2: higher sensory and motor noise, Goble et al. 2009) (Table 1). We then simulate walking at different speeds (0.8–1.8 ms−1) with this model, and analyse which modifications trigger elderly‐like walking with higher metabolic cost and why the elderly prefer to walk slower.
Figure 2. Predictive neuromechanical model of human locomotion.

The model consists of skeletal, muscular and neural layers. The muscle lengths, l m, are defined by the joint angles of the skeletal system, φ j, and the muscle forces, F m, are converted to joint torques, T j, which actuate the skeletal system interacting with the ground. The muscles are activated based on the stimulation signals from the neural controller, which consists primarily of proprioceptive spinal reflexes. The sensory and motor noises, εs and εm, are added in our simulation based on studies in human standing posture. We use a noise model called S1M1 proposed in van der Kooij & Peterka (2011). We adapt the model by using white Gaussian noise instead of pink noise in the original model, as white noise is simpler to implement in our variable time‐step simulations and as other studies show human‐like standing posture, which has a pink power spectral density, can be reproduced with white noise (Asai et al. 2009; Suzuki et al. 2012). (m HAT, m thigh, m shank and m foot: masses of the head, arms and trunk (HAT), thigh, shank and foot segments; φhip: hip extension angle; CE: contractile element; F ce, l ce and v ce: force, length and velocity of CE; PE: parallel elasticity; SE: series elasticity; F pe: force of PE; A m: muscle activation; F max: maximum isometric force of CE; : force–length relationship of CE; : force–velocity relationship of CE; N: eccentric force enhancement, v max: maximum contraction speed; εref, pe: reference strain of parallel elasticity; ECC: excitation–contraction coupling time constants; τact and τdact: ECC time constants; and : neural transmission time delay.) [Color figure can be viewed at http://wileyonlinelibrary.com]
Table 1.
Skeletal, muscular and neural changes in the elderly model
| Physiological property | Modification from young model |
|---|---|
| S 1: body mass distribution (Pavol et al. 2002) | m leg: −10%; |
| S 2: range of motion (Roach & Miles, 1991) | max(φhip): −20% |
| M 1: muscle strength and mass (Goodpaster et al. 2006; Delmonico et al. 2009) | F max: −30%; m m: −10% |
| M 2: muscle properties (Thelen, 2003; Nilwik et al. 2013) | v max: −20%; N: +30%; εref, pe: −15%; τdact: +20%; p ft: −10% |
| N 1: neural conductance speed (Rivner et al. 2001) | : +15% |
| N 2: sensing and motor noise (Goble et al. 2009) | : +100% |
m total: total body mass; ; m m: muscle mass; p ft: proportion of fast‐twitch muscle fibres; other parameters defined in Fig. 2.
Baseline neuromechanical model
We adapt a previously proposed neuromechanical walking model that can generate diverse 3‐D human locomotion behaviours (Song & Geyer, 2015) and predict human responses during walking against a range of unexpected disturbances (Song & Geyer, 2017). The model represents the human body with a rigid body chain whose joints are actuated by Hill‐type muscles (Fig. 2). These muscle models combine an active, force‐producing element with passive series and parallel elasticities similar to human muscle–tendon units. The active elements are stimulated by feedback control circuits that simulate neural control circuits, relating sensory input from the muscle spindles and Golgi tendon organs (length and velocity of contractile elements, force of muscle–tendon units), from the vestibular system (trunk lean), and from mechanoreceptors underneath the feet (contact information as well as perceived leg loading) to the output of the α‐motoneurons. The resulting muscle contraction forces act through moment arms to produce joint torques, which together with the gravitational force and the ground reaction forces that the legs experience, generate walking in a physics‐based simulation of the human model. No human gait data are used in the simulation process, and the actual walking motion that emerges in the model depends solely on the values of its control parameters (such as the gain of a muscle's stretch reflex) and of its mechanical parameters (such as segment mass, maximum muscle force and contraction velocity).
We use the 2‐D sagittal plane portion of this model and add more physiological details relevant to the study of elderly gait. Specifically, the length and mass of skeletal segments (Winter, 2009), the strength and mass of muscles (Miller, 2014), and the range of joint motions (Roach & Miles, 1991) are further tuned. We also use a more detailed muscle activation dynamics model (the relationship between muscle excitation and contraction) (Thelen, 2003), and add sensory and motor noise (van der Kooij & Peterka, 2011), where the parameter values are all determined based on human experimental data.
Model modification on age‐related physiological properties
We modify the baseline model to represent healthy adults with an age of about 80 years. Pathological symptoms not observed in healthy elderly people, such as stooped posture (Hirose et al. 2004), are not considered. All modifications to the baseline model are presented in Table 1, where the specific values of changes are either adopted from previous modelling studies or estimated from available human data. The modifications are categorized into six groups based on the component of the model they apply to (Fig. 2). In the skeletal layer, the body mass distribution changes due to loss of leg muscles and gain of body fat (S 1) (Jensen & Fletcher, 1994; Pavol et al. 2002), and the range of hip extension reduces due to muscle contracture (S 2) (Roach & Miles, 1991; Kerrigan et al. 1998). In the muscular layer, the muscles lose strength (Thelen, 2003; Monaco & Micera, 2012) and mass, with much larger loss in the strength (M 1) (Goodpaster et al. 2006; Delmonico et al. 2009), and a number of muscle properties change, where the most prominent change is that of becoming slower (M 2) (Lexell, 1995; Thelen, 2003; Monaco & Micera, 2012; Nilwik et al. 2013). Since not much is known about how the control changes in elderly walking, we do not change the neural control structure, but we apply neural changes of reduced neural conductance speed (N 1) (Bouche et al. 1993; Rivner et al. 2001) and increased sensory and motor noise (N 2) (Goble et al. 2009). All changes are applied together to represent elderly people, and each change is applied individually to the baseline young model for further analysis.
Control parameter optimization
For each model with different physiological changes, we optimize the control parameters to minimize the cost
| (1) |
where T is the time duration, A m is muscle activation, v avg is the average walking speed, and v tgt is the target walking speed. All of these values are calculated during the last six steady steps of the simulation. The first term, , represents muscle fatigue and has been commonly used in neuromechanical modelling studies of human locomotion (Thelen & Anderson, 2006; Ackermann & van den Bogert, 2010; Miller et al. 2012) as an optimization cost (Appendix A, ‘Optimization cost’). For all models, we search for solutions at 0.8, 1.0, 1.2, 1.4, 1.6 and 1.8 ms−1, which covers the range of slow and fast walking speeds of healthy people (Murray et al. 1984).
We use covariance matrix adaptation evolution strategy (CMA‐ES) (Hansen, 2006) with the actual optimization cost constructed as multiple stages (Song & Geyer, 2015) that first search for steady and stable walking solutions with all joint angles within the range of motion, and then minimize eqn (1). A single trial of CMA‐ES is set to run for 400 generations with a population size of 16 and takes about 1 day on a modern desktop machine. To ensure convergence and to avoid bad local minima, we chain multiple CMA‐ES trials by initializing a new run (with a new unbiased covariance matrix) with a previous solution until the solutions do not improve and by starting new trials with different initial parameters. We continue this optimization process until most of the monitored walking features of a model, such as J (eqn (1)), COT, step length and trunk lean, show qualitatively smooth trends across all walking speeds. On average, the optimization process for one set of control parameters involved five CMA‐ES trials.
Results
Metabolic energy consumption
The simulations show that the combined modifications produce gait consistent with elderly walking. Like young and elderly people (Kerrigan et al. 1998; Monaco et al. 2009; Schmitz et al. 2009), the young and elderly models walk with more or less similar time trajectories of the joint angles and torques, the ground reaction forces, and the muscle activations. However, the elderly model has also adapted in ways common to elderly gait. It has more pelvic tilt with less hip extension throughout the gait cycle (Kerrigan et al. 1998; Monaco et al. 2009) and a smaller ankle plantarflexion torque during stance (Kerrigan et al. 1998; Monaco et al. 2009; Monaco & Micera, 2012) (Fig. 3). Most importantly, the metabolic cost has shifted as known from human experiments. It is, on average, 16% higher than in the young model across all walking speeds, and the walking speed that minimizes COT remains about the same in both models as observed in humans (compare Fig. 4 A and Fig. 1).
Figure 3. Kinematics, dynamics and muscle activations of young and elderly models.

The plots show gait data of the young and elderly models walking at 1.2 ms−1. The differences between the young and elderly models that are consistently observed across walking speeds (at least for 1.0–1.6 ms−1) are marked with shaded ovals. The ovals with a dashed border mark the differences that agree with reported human data, the ones with a dotted border mark the ones that oppose the reported human data, and the ones with no border do not have enough human data to compare with. We refer to human data that allow comparisons between young and elderly walking at similar speeds (Kerrigan et al. 1998; DeVita & Hortobagyi, 2000; Monaco et al. 2009; Schmitz et al. 2009; Monaco & Micera, 2012; Kim & Kim, 2014). (BW: body weight; LL: leg length; HFL: hip flexor; GLU: glutei; HAM: hamstring; RF: rectus femoris; VAS: vastii; BFSH: short head of biceps femoris; GAS: gastrocnemius; SOL: soleus; TA: tibialis anterior.)
Figure 4. Metabolic cost of transport (COT) and muscle fatigue of transport (FOT) of walking in simulation with age‐related physiological changes.

A, COT for slow to fast walking of the young (grey) and elderly (black) models (circle: simulation data; continuous line: least‐squares fitted quadratic polynomial; vertical dotted line: walking speed at the minimum of the fitted curve; horizontal dotted line: mean value of simulation data with value shown to the right). B, COT resolved by individual age‐related physiological changes. (and N 2 are omitted, as they had little effect. Applying the control parameters optimized for the young model for either or N 2 generates practically the same behaviour and, thus, the same COT and FOT.) C and D, FOT equivalent to A and B. (FTG: fatigue accumulated by all muscles over the distance travelled.) The contribution of individual muscles to the change in COT and FOT are discussed in Appendix B.
When the modifications are applied one by one, the simulations reveal that the increase in COT is triggered mainly by the loss of muscle strength and mass (M 1). Applying M 1 to the young model results in a substantial increase in the average COT (16%), while applying any of the other modifications does not (<5%) (Fig. 4 B). Further analysis of the muscle metabolic energy consumption model (, where m m is the muscle mass, h A, M is the activation and maintenance heat, h s is the shortening heat, and w M is the mechanical work) points to two factors that mainly and about equally contribute to the COT increase (in Appendix A, ‘Metabolic energy calculations’). The first factor is the decline in muscle quality. Ageing muscles weaken more than they lose mass (Goodpaster et al. 2006; Delmonico et al. 2009) (Table 1, M 1), which results in more energy consumed per amount of force produced due to the increase in activation and maintenance heat rate. Second, the size principle of motor unit recruitment amplifies the energy consumption of weaker muscles. Motor unit recruitment progresses from slow‐twitch muscle fibres at low activations to metabolically more expensive fast‐twitch fibres at higher activations (Martin et al. 1992; Bhargava et al. 2004), which is captured in the activation and maintenance heat rate of the metabolics model and further amplifies the energetic cost of producing the same force.
Our simulation results suggest training muscle strength and mass may be the only effective way to enhance metabolic economy in elderly walking. While it is known that physical training can reverse muscular changes and enhance walking performance in elderly people, the effects of different training regimes vary and it remains unclear which one is optimal (Lopopolo et al. 2006). Our results suggest that a training regime which focuses on restoring muscle strength and mass (M 1) may be most effective, and that reversing other physiological changes matters less (S 1, M 2, N 1) or not at all (S 2, N 2).
Preferred walking speed
Neither in human experiments nor in our computer simulations can the metabolic cost of transport explain the slower speed at which elderly people prefer to walk, but we find evidence that another criterion based on muscle fatigue can. Muscle fatigue is often studied in the elderly with regard to balance control and fall risk (dos Santos et al. 2017). Its effect on the preferred speed of walking is not well understood; however, fatigue of the tibialis anterior muscle has been shown to lower the speed at which humans prefer to transition from walking to running (Segers et al. 2007). We find that, when combined in a performance criterion similar to the COT, minimizing muscle fatigue suggests preferred walking speeds observed in young adults and elderly people. Specifically, we define the fatigue of transport (FOT) as the fatigue accumulated by all muscles over the distance travelled, , where the squared muscle activations is a gauge of fatigue commonly used in neuromechanical models (Appendix A, ‘Muscle fatigue calculations’) (Ackermann & van den Bogert, 2010). We then compute the FOT from our simulation data and find it is minimal at 1.49 ms−1 in the young model and at 1.21 ms−1 in the elderly model (Fig. 4 C). The two minima are consistent with the preferred walking speeds of young and elderly people (Himann et al. 1988; Lauretani et al. 2003), supporting the hypothesis that muscle fatigue could govern a person's preference on speed. The result may also explain the observation that fatigued young and elderly people do not change walking speed by much (Helbostad et al. 2007; Granacher et al. 2010), as their gait seems already optimal in this regard.
If muscle fatigue indeed governs the preferred speed, then the FOT calculations for the model variants with individual age‐related modifications show that restoring walking speed is more difficult than restoring metabolic economy. Similarly to the increase in metabolic costs, a shift of the minimum FOT towards slower walking speed in the elderly model results from the loss of muscle strength and mass (M 1, −0.32 ms−1). Yet, in contrast to the results for metabolic costs, the shift also results from the redistribution of the segment masses (S 1, −0.31 ms−1) and from the lower speed of muscle contraction (M 2, −0.18 ms−1) (Fig. 4 D). These results suggest that increasing the preferred walking speed would require a training that addresses all three changes simultaneously. However, the changes are connected at least in part by the age‐related atrophy of fast twitch fibres (Nilwik et al. 2013), which is associated with loss and slowdown of leg muscles and a related shift in mass distribution. A training that focuses on reversing this atrophy would thus seem most effective.
Discussion
Limitations
As with any simulation study, ours is based on assumptions that may limit its predictive capabilities. First, our model simplifies the neuromuscular structure of the human locomotor system. Although we have tried to include in this structure the parts that previous studies have suggested to influence elderly gait, any missing part may have an effect as well. For instance, we estimated the metabolic energy consumption of young and elderly muscles following the same formulation (Bhargava et al. 2004), but the validity of this assumption has not been tested. Second, we rely on a hypothesized neural control circuitry and an optimization criterion to identify walking gaits in our model. Although neither has been validated in human experiments, the optimization criterion we use is commonly applied in many studies on human locomotion performance (Thelen & Anderson, 2006; Ackermann & van den Bogert, 2010; Miller et al. 2012), and we find no qualitative differences in model outcome with alternative criteria of muscle fatigue and metabolic energy (Appendix A, ‘Optimization cost’). The control circuitry of the model has at least been demonstrated to predict human leg kinematics, kinetics and muscle activations in steady walking (Song & Geyer, 2015) and human responses to unexpected disturbances (Song & Geyer, 2017). An alternative to assuming a specific neural control circuitry would be to directly optimize the muscle stimulation patterns for obtaining walking gaits (Ackermann & van den Bogert, 2010; Miller et al. 2012). However, this alternative approach implies the human controller has no underlying structural constraints. Moreover, when muscle stimulation patterns are directly optimized, it is difficult to include the effects of control‐related changes, such as neural transmission delays (N 1), and sensory and motor noise (N 2).
Conclusion
We have investigated the physiological origins of the age‐related decline in walking performance with a predictive neuromechanical model. In simulations of this model with physiological changes known to affect elderly people, we have found that their increased metabolic cost of walking is caused mainly by the loss of muscle strength and mass. In addition, we have found that the slower preferred walking speed of elderly people would emerge if humans adapt to muscle fatigue rather than energy economy, and that this adaptation occurs in response to several muscle‐related changes in physiology. The results suggest that reversing these changes is the only effective way to enhance the performance of elderly walking. Physical training has been shown to achieve such a reversion, although it remains unclear precisely which training regimes work well (Lopopolo et al. 2006). A regime with a focus on restoring the fast‐twitch muscle fibres (Pyka et al. 1994; Nilwik et al. 2013) may be most effective.
Additional information
Competing interests
None declared.
Author contributions
Both authors designed the research and drafted the article. S.S. conducted the simulation studies. Both authors approved the final version of the manuscript, agreed to be accountable for all aspects of the work, and qualify for authorship. All those who qualify for authorship are listed.
Funding
This work is supported in part by the Richard King Mellon Foundation Presidential Fellowship in the Life Sciences at Carnegie Mellon University.
Acknowledgements
We thank H. van der Kooij and Y. Suzuki for discussions and clarifications on modelling noise in the human nervous system and S. Collins, B. Umberger and G. Sawicki for discussions on muscle physiology.
A. Physiological criteria of gait
Optimization cost
Our human model is based on the model proposed in Song & Geyer (2015). In that work, we used the metabolic energy as the cost criterion for optimization. Here, instead, we switched to muscle fatigue (eqn (1)). We made this switch because the cost associated with muscle fatigue is computationally simpler, and still results in human‐like kinematics, kinetics and muscle activations (Fig. A1). In fact, as in other studies on modelling human walking and running (Ackermann & van den Bogert, 2010; Miller et al. 2012), we observed that the fatigue‐optimal walking showed kinematics more similar to human gait; specifically, the knee flexion during early stance and ankle dorsiflexion in late stance became more similar.
Figure A1. Kinematics, dynamics and muscle activations when optimized for different costs.

The plots show gait data of young adults and the baseline young model walking at 1.2 ms−1 while minimizing either muscle fatigue (eqn (1)) or metabolic energy (Song & Geyer, 2015). The metabolic energy is calculated using the model proposed in Umberger (2010). Optimizing with the energy model proposed in Bhargava et al. (2004) results in a gait that is somewhat between those optimized with Umberger's model and with muscle fatigue (not shown), which is reasonable due to the convex activation‐to‐cost relationship in the fatigue calculations (‘Metabolic energy calculations’ in Appendix A).
Given that the details of the gait data also depend on the simplified musculoskeletal system and the underlying control structure of the model, small differences in the resulting gait may not be enough to judge the plausibility of the corresponding costs. Nevertheless, other simulation studies consistently find fatigue‐like costs result in more knee flexion during stance (Ackermann & van den Bogert, 2010), although in some control models, this can lead to crouched gaits with too much knee flexion (Wang et al. 2012).
Metabolic energy calculations
The activation‐to‐metabolics relationship remains debated with competing evidence (Saugen and Vøllestad, 1995; Hunter et al. 2001; Christie et al. 2014). Here we present the effect of the activation‐to‐metabolics relationship on the COT‐to‐walking‐speed relationship (Fig. A2). In our main study, we have used the Bhargava's muscle metabolics model, which has a convex activation‐to‐metabolics relationship based on the size principle of motor unit recruitment (Fig. A2 A). On the other hand, the Umberger's model has a concave relationship (Fig. A2 F), while in more recent studies (Uchida et al. 2016; Jackson et al. 2017) this model has been adapted to have the convex relationship (similar to Fig. A2 B). We have adapted the original Bhargava's and Umberger's models to have convex, linear or concave relationships and found that the COT calculation is much affected by the activation‐to‐metabolics relationship and that the convex relationship results in COT‐to‐speed relationships closest to those observed in young and elderly people. Moreover, the increase in COT of the elderly model without the size principle decreases to about half (compare Fig. A2 A–C), indicating that both the decline in muscle quality and the size principle contribute about equally to the 16% COT increase of the elderly model.
Figure A2. Metabolic COT calculations with different models.
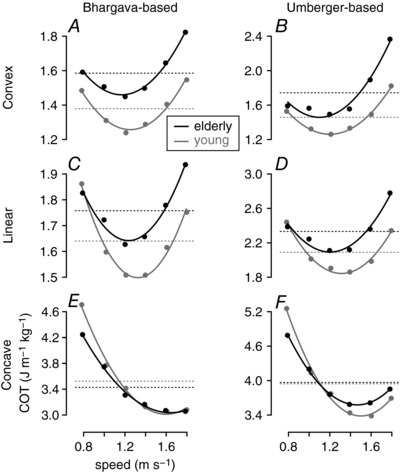
COT–speed relationships are shown, where the COTs are calculated differently based on Bhargava's (Bhargava et al. 2004) and Umberger's (Umberger, 2010) muscle metabolics models. The original models are adapted to have convex, linear or concave activation‐to‐metabolics relationships.
Muscle fatigue calculations
We have used the integration of squared muscle activation () as an estimate for muscle fatigue. While this estimate is often used in neuromechanical studies of human locomotion (Ackermann & van den Bogert, 2010; Miller et al. 2012), exponents of 1.5–5.0 of either muscle activations or normalized muscle force () have also been considered (Crowninshield & Brand, 1981; Ackermann & van den Bogert, 2010; Miller et al. 2012), while metabolic energy depends on muscle activation more linearly (Ackermann & van den Bogert, 2010; Umberger, 2010) (Fig. A3 A). We have found that the fatigue‐like measures of exponents higher than one of muscle activation and force suggest slower walking speeds for elderly people (Fig. A3 C–F), while the energy‐like measure does not (Fig. A3 A). This overall trend supports our conclusion that minimizing for FOT, but not COT, can explain slower walking speeds in elderly people.
Figure A3. Muscle FOT calculations with different models.
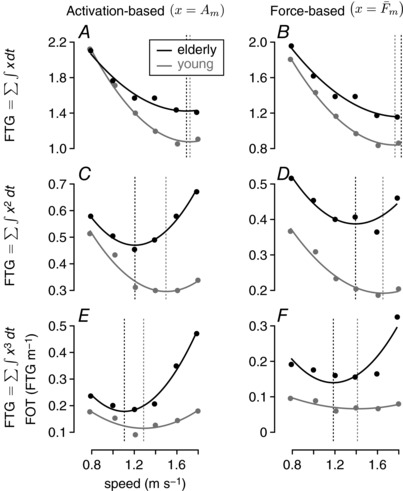
FOT–speed relationships are shown, where the FOTs are calculated as exponents of either muscle activation or normalized muscle force. Exponents of one (A and B), which are actually closer to a measure of metabolic energy than muscle fatigue (Ackermann & van den Bogert, 2010), are shown for comparison.
B. Contributions of individual muscles in COT and FOT
Three muscles show meaningful differences (>5%) in the contributions to the total metabolic COT between the elderly model and the young model (Fig. A4 A). The elderly model uses more actuation of the hip flexors (HFL) and less actuation of the ankle extensors (GAS, gastrocnemius; SOL, soleus), which is in line with what is observed in elderly people (Judge et al. 1996; Monaco et al. 2009; Schmitz et al. 2009; Buddhadev & Martin, 2016). Although the change in muscle properties (M 2) does not have much effect on the total COT, it is the main contributor to the change in muscle coordination (Fig. A4 B), suggesting that the slower muscles of elderly people are not suitable any more for performing fast ankle push off, and thus they use hip flexors more to propel the limbs forward. For the contributions to the total muscle FOT, three hip muscles (HFL; GLU, glutei; HAM, hamstring) show meaningful changes (>5%) in the elderly model (Fig. A4 C). Mainly the loss of muscle strength and mass (M 1) contributes to these changes (Fig. A4 D).
Figure A4. Metabolic COT and muscle FOT of individual muscles during walking with age‐related physiological properties.

A and B, COT of individual muscles. C and B, FOT of individual muscles. Only the muscles that show differences of more than 5% of the total COT or FOT are shown. [Color figure can be viewed at http://wileyonlinelibrary.com]
Edited by: Janet Taylor & Dario Farina
References
- Ackermann M & van den Bogert AJ (2010). Optimality principles for model‐based prediction of human gait. J Biomech 43, 1055–1060. [DOI] [PMC free article] [PubMed] [Google Scholar]
- Asai Y, Tasaka Y, Nomura K, Nomura T, Casadio M & Morasso P (2009). A model of postural control in quiet standing: Robust compensation of delay‐induced instability using intermittent activation of feedback control. PLoS One 4, e6169. [DOI] [PMC free article] [PubMed] [Google Scholar]
- Bhargava LJ, Pandy MG & Anderson FC (2004). A phenomenological model for estimating metabolic energy consumption in muscle contraction. J Biomech 37, 81–88. [DOI] [PubMed] [Google Scholar]
- Bouche P, Cattelin F, Saint‐Jean O, Léger JM, Queslati S, Guez D, Moulonguet A, Brault Y, Aquino JP & Simunek P (1993). Clinical and electrophysiological study of the peripheral nervous system in the elderly. J Neurol 240, 263–268. [DOI] [PubMed] [Google Scholar]
- Buddhadev HH & Martin PE (2016). Effects of age and physical activity status on redistribution of joint work during walking. Gait Posture 50, 131–136. [DOI] [PubMed] [Google Scholar]
- Christie AD, Tonson A, Larsen RG, DeBlois JP & Kent JA (2014). Human skeletal muscle metabolic economy in vivo: effects of contraction intensity, age, and mobility impairment. Am J Physiol Regul Integr Comp Physiol 307, R1124–R1135. [DOI] [PMC free article] [PubMed] [Google Scholar]
- Crowninshield RD & Brand RA (1981). A physiologically based criterion of muscle force prediction in locomotion. J Biomech 14, 793–801. [DOI] [PubMed] [Google Scholar]
- Delmonico MJ, Harris TB, Visser M, Park SW, Conroy MB, Velasquez‐Mieyer P, Boudreau R, Manini TM, Nevitt M, Newman AB & Goodpaster BH (2009). Longitudinal study of muscle strength, quality, and adipose tissue infiltration. Am J Clin Nutr 90, 1579–1585. [DOI] [PMC free article] [PubMed] [Google Scholar]
- DeVita P & Hortobagyi T (2000). Age causes a redistribution of joint torques and powers during gait. J Appl Physiol (1985) 88, 1804–1811. [DOI] [PubMed] [Google Scholar]
- dos Santos PCR, Orcioli‐Silva D, Simieli L, Pereira VIA & Barbieri FA (2017). The influence of muscle fatigue on walking: The role of aging and Parkinson's disease In Locomotion and Posture in Older Adults: The Role of Aging and Movement Disorders, ed. Barbieri FA. & Vitório R, pp. 143–159. Springer International Publishing, Cham, Switzerland. [Google Scholar]
- Goble DJ, Coxon JP, Wenderoth N, Van Impe A & Swinnen SP (2009). Proprioceptive sensibility in the elderly: Degeneration, functional consequences and plastic‐adaptive processes. Neurosci Biobehav Rev 33, 271–278. [DOI] [PubMed] [Google Scholar]
- Goodpaster BH, Park SW, Harris TB, Kritchevsky SB, Nevitt M, Schwartz AV, Simonsick EM, Tylavsky FA, Visser M & Newman AB; Health ABC Study (2006). The loss of skeletal muscle strength, mass, and quality in older adults: the health, aging and body composition study. J Gerontol A Biol Sci Med Sci 61, 1059–1064. [DOI] [PubMed] [Google Scholar]
- Granacher U, Wolf I, Wehrle A, Bridenbaugh S & Kressig RW (2010). Effects of muscle fatigue on gait characteristics under single and dual‐task conditions in young and older adults. J Neuroeng Rehabil 7, 56. [DOI] [PMC free article] [PubMed] [Google Scholar]
- Hansen N (2006). The CMA evolution strategy: a comparing review In Towards a New Evolutionary Computation: Advances on Estimation of Distribution Algorithms (Studies in Fuzziness and Soft Computing), vol. 192, ed. Lozano JA, Larrañaga P, Inza I. & Bengoetxea E, pp. 75–102. Springer Science & Business Media. [Google Scholar]
- Helbostad JL, Leirfall S, Moe‐Nilssen R & Sletvold O (2007). Physical fatigue affects gait characteristics in older persons. J Gerontol A Biol Sci Med Sci 62, 1010–1015. [DOI] [PubMed] [Google Scholar]
- Himann JE, Cunningham DA, Rechnitzer PA & Peterson DH (1988). Age‐related changes in speed of walking. Med Sci Sports Exerc 20, 161–166. [DOI] [PubMed] [Google Scholar]
- Hirose D, Ishida K, Nagano Y, Takahashi T & Yamamoto H (2004). Posture of the trunk in the sagittal plane is associated with gait in community‐dwelling elderly population. Clin Biomech (Bristol, Avon) 19, 57–63. [DOI] [PubMed] [Google Scholar]
- Hortobagyi T, Finch A, Solnik S, Rider P & De Vita P (2011). Association between muscle activation and metabolic cost of walking in young and old adults. J Gerontol A Biol Sci Med Sci 66A, 541–547. [DOI] [PMC free article] [PubMed] [Google Scholar]
- Hoyt DF & Taylor CR (1981). Gait and the energetics of locomotion in horses. Nature 292, 239. [Google Scholar]
- Hunter GR, Newcomer BR, Larson‐Meyer DE, Bamman MM & Weinsier RL (2001). Muscle metabolic economy is inversely related to exercise intensity and type‐II myofiber distribution. Muscle Nerve 24, 654–661. [DOI] [PubMed] [Google Scholar]
- Jackson RW, Dembia CL, Delp SL & Collins SH (2017). Muscle‐tendon mechanics explain unexpected effects of exoskeleton assistance on metabolic rate during walking. J Exp Biol 220, 2082–2095. [DOI] [PMC free article] [PubMed] [Google Scholar]
- Jensen RK & Fletcher P (1994). Distribution of mass to the segments of elderly males and females. J Biomech 27, 89–96. [DOI] [PubMed] [Google Scholar]
- Judge JO, Davis RB & Ounpuu S (1996). Step length reductions in advanced age: the role of ankle and hip kinetics. J Gerontol A Biol Sci Med Sci 51, M303–M312. [DOI] [PubMed] [Google Scholar]
- Kerrigan DC, Todd MK, Della Croce U, Lipsitz LA & Collins JJ (1998). Biomechanical gait alterations independent of speed in the healthy elderly: Evidence for specific limiting impairments. Arch Phys Med Rehabil 79, 317–322. [DOI] [PubMed] [Google Scholar]
- Kim WS & Kim EY (2014). Comparing self‐selected speed walking of the elderly with self‐selected slow, moderate, and fast speed walking of young adults. Ann Rehabil Med 38, 101–108. [DOI] [PMC free article] [PubMed] [Google Scholar]
- Lauretani F, Russo CR, Bandinelli S, Bartali B, Cavazzini C, Di Iorio A, Corsi AM, Rantanen T, Guralnik JM & Ferrucci L (2003). Age‐associated changes in skeletal muscles and their effect on mobility: an operational diagnosis of sarcopenia. J Appl Physiol (1985) 95, 1851–1860. [DOI] [PubMed] [Google Scholar]
- Lexell J (1995). Human aging, muscle mass, and fiber type composition. J Gerontol A Biol Sci Med Sci 50A (Special Issue), 11–16. [DOI] [PubMed] [Google Scholar]
- Lopopolo R, Greco M, Sullivan D & Craik R (2006). Effect of therapeutic exercise on gait speed in community‐dwelling elderly people: a meta‐analysis. Phys Ther 86, 520–540. [PubMed] [Google Scholar]
- Malatesta D, Simar D, Dauvilliers Y, Candau R, Borrani F, Prefaut C & Caillaud C (2003). Energy cost of walking and gait instability in healthy 65‐ and 80‐yr‐olds. J Appl Physiol (1985) 95, 2248–2256. [DOI] [PubMed] [Google Scholar]
- Martin PE, Rothstein DE & Larish DD (1992). Effects of age and physical activity status on the speed‐aerobic demand relationship of walking. J Appl Physiol (1985) 73, 200–206. [DOI] [PubMed] [Google Scholar]
- Mian OS, Thom JM, Ardigo LP, Narici MV & Minetti AE (2006). Metabolic cost, mechanical work, and efficiency during walking in young and older men. Acta Physiol (Oxf) 186, 127–139. [DOI] [PubMed] [Google Scholar]
- Miller RH (2014). A comparison of muscle energy models for simulating human walking in three dimensions. J Biomech 47, 1373–1381. [DOI] [PubMed] [Google Scholar]
- Miller RH, Umberger BR, Hamill J & Caldwell GE (2012). Evaluation of the minimum energy hypothesis and other potential optimality criteria for human running. Proc R Soc Lond B Biol Sci 279, 1498–1505. [DOI] [PMC free article] [PubMed] [Google Scholar]
- Monaco V & Micera S (2012). Age‐related neuromuscular adaptation does not affect the mechanical efficiency of lower limbs during walking. Gait Posture 36, 350–355. [DOI] [PubMed] [Google Scholar]
- Monaco V, Rinaldi LA, Macrì G & Micera S (2009). During walking elders increase efforts at proximal joints and keep low kinetics at the ankle. Clin Biomech 24, 493–498. [DOI] [PubMed] [Google Scholar]
- Murray MP, Mollinger LA, Gardner GM & Sepic S. (1984). Kinematic and EMG patterns during slow, free, and fast walking. J Orthop Res 2, 272–280. [DOI] [PubMed] [Google Scholar]
- Nilwik R, Snijders T, Leenders M, Groen BBL, van Kranenburg J, Verdijk LB & Van Loon LJC (2013). The decline in skeletal muscle mass with aging is mainly attributed to a reduction in type II muscle fiber size. Exp Gerontol 48, 492–498. [DOI] [PubMed] [Google Scholar]
- Ortega JD, Fehlman LA & Farley CT (2008). Effects of aging and arm swing on the metabolic cost of stability in human walking. J Biomech 41, 3303–3308. [DOI] [PMC free article] [PubMed] [Google Scholar]
- Pavol MJ, Owings TM & Grabiner MD (2002). Body segment inertial parameter estimation for the general population of older adults. J Biomech 35, 707–712. [DOI] [PubMed] [Google Scholar]
- Peterson DS & Martin PE (2010). Effects of age and walking speed on coactivation and cost of walking in healthy adults. Gait Posture 31, 355–359. [DOI] [PubMed] [Google Scholar]
- Pyka G, Lindenberger E, Charette S & Marcus R (1994). Muscle strength and fiber adaptations to a year‐long resistance training program in elderly men and women. J Gerontol 49, M22–M27. [DOI] [PubMed] [Google Scholar]
- Ralston HJ (1958). Energy‐speed relation and optimal speed during level walking. Arbeitsphysiologie 17, 277–283. [DOI] [PubMed] [Google Scholar]
- Rivner MH, Swift TR & Malik K (2001). Influence of age and height on nerve conduction. Muscle Nerve 24, 1134–1141. [DOI] [PubMed] [Google Scholar]
- Roach KE & Miles TP (1991). Normal hip and knee active range of motion: the relationship to age. Phys Ther 71, 656–665. [DOI] [PubMed] [Google Scholar]
- Saugen E & Vøllestad NK (1995). Nonlinear relationship between heat production and force during voluntary contractions in humans. J Appl Physiol (1985) 79, 2043–2049. [DOI] [PubMed] [Google Scholar]
- Schmitz A, Silder A, Heiderscheit B, Mahoney J & Thelen DG (2009). Differences in lower‐extremity muscular activation during walking between healthy older and young adults. J Electromyogr Kinesiol 19, 1085–1091. [DOI] [PMC free article] [PubMed] [Google Scholar]
- Segers V, Lenoir M, Aerts P & De Clercq D (2007). Influence of M. tibialis anterior fatigue on the walk‐to‐run and run‐to‐walk transition in non‐steady state locomotion. Gait Posture 25, 639–647. [DOI] [PubMed] [Google Scholar]
- Song S & Geyer H (2015). A neural circuitry that emphasizes spinal feedback generates diverse behaviours of human locomotion. J Physiol 593, 3493–3511. [DOI] [PMC free article] [PubMed] [Google Scholar]
- Song S & Geyer H (2017). Evaluation of a neuromechanical walking control model using disturbance experiments. Front Comput Neurosci 11, 15. [DOI] [PMC free article] [PubMed] [Google Scholar]
- Suzuki Y, Nomura T, Casadio M & Morasso P (2012). Intermittent control with ankle, hip, and mixed strategies during quiet standing: A theoretical proposal based on a double inverted pendulum model. J Theor Biol 310, 55–79. [DOI] [PubMed] [Google Scholar]
- Thelen DG (2003). Adjustment of muscle mechanics model parameters to simulate dynamic contractions in older adults. J Biomech Eng 125, 70–77. [DOI] [PubMed] [Google Scholar]
- Thelen DG & Anderson FC (2006). Using computed muscle control to generate forward dynamic simulations of human walking from experimental data. J Biomech 39, 1107–1115. [DOI] [PubMed] [Google Scholar]
- Uchida TK, Hicks JL, Dembia CL & Delp SL (2016). Stretching your energetic budget: How tendon compliance affects the metabolic cost of running. PLoS One 11, 1–19. [DOI] [PMC free article] [PubMed] [Google Scholar]
- Umberger BR (2010). Stance and swing phase costs in human walking. J Royal Soc Interface 7, 1329–1340. [DOI] [PMC free article] [PubMed] [Google Scholar]
- van der Kooij H & Peterka RJ (2011). Non‐linear stimulus‐response behavior of the human stance control system is predicted by optimization of a system with sensory and motor noise. J Comput Neurosci 30, 759–778. [DOI] [PMC free article] [PubMed] [Google Scholar]
- van der Krogt MM, Delp SL & Schwartz MH (2012). How robust is human gait to muscle weakness? Gait Posture 36, 113–119. [DOI] [PMC free article] [PubMed] [Google Scholar]
- Wang J, Hamner SR, Delp SL & Koltun V (2012). Optimizing locomotion controllers using biologically‐based actuators and objectives. ACM Trans Graph 31, 25. [DOI] [PMC free article] [PubMed] [Google Scholar]
- Winder DA (2009). Anthropometry In Biomechanics and motor control of human movement, 4th edn, pp. 82–106. John Wiley & Sons, Hoboken, New Jersey. [Google Scholar]