
FIGURE 2.
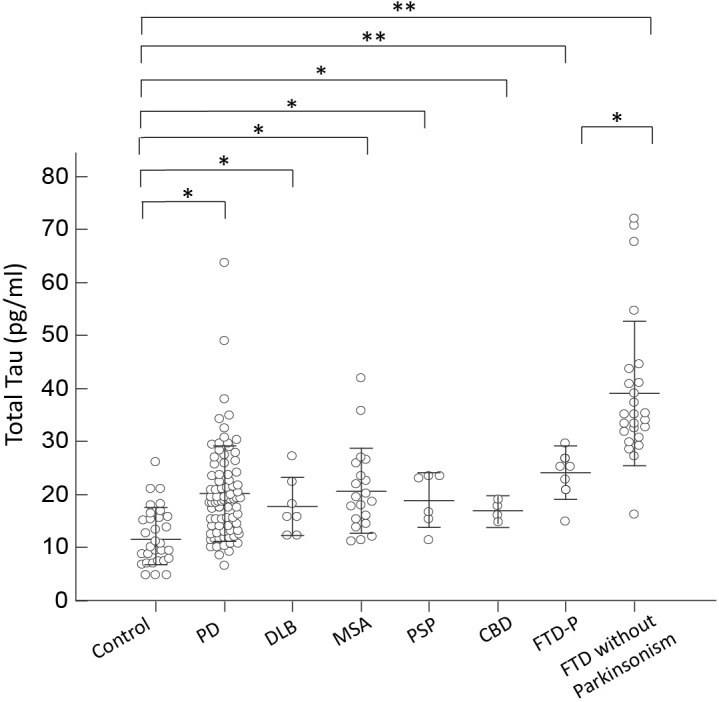
Plasma total tau levels for all participants in the study. Plasma total tau levels of normal controls and patients in different disease groups. The plasma total tau level was significantly increased in patients with FTD compared to normal control participants and patients with PD, DLB, MSA, PSP, or CBD (p < 0.001). The mean ± 1 standard deviation (SD) was illustrated as horizontal lines in each disease group. ∗p < 0.05; ∗∗p < 0.01.